Envista Management presentation December 2, 2019 - Envista Investor ...
←
→
Page content transcription
If your browser does not render page correctly, please read the page content below

Envista Management presentation December 2, 2019

Disclaimer
 This presentation is intended solely for investors that are qualified institutional buyers solely for the purposes of familiarizing such investors with Envista Holdings Corporation (the “Company” or “Envista”) and determining
 whether such investors might have an interest in the Company. Any offering of the Company’s securities will only be made by means of a registration statement (including a prospectus) filed with the SEC, after such
 registration statement becomes effective. No such registration statement has become effective, as of the date of this presentation. This presentation shall not constitute an offer to sell or the solicitation of an offer to buy
 these securities, nor shall there be any sale of these securities in any state or jurisdiction in which such offer, solicitation or sale would be unlawful prior to registration or qualification under the securities laws of any such
 state or jurisdiction.

 This presentation may contain forward-looking statements and such statements are intended to be covered by the safe harbor provided by the same. Forward-looking statements are subject to substantial risks and
 uncertainties, many of which are difficult to predict and are generally beyond management’s control. These forward-looking statements may include information about possible or assumed future results of the Company,
 or its business, financial condition, liquidity, results of operations, plans and objectives. When used in this presentation, the words “believe,” “expect,” “anticipate,” “estimate,” “plan,” “continue,” “intend,” “should,” “may” or
 similar expressions, are intended to identify forward-looking statements. Statements regarding the following subjects, among others, may be forward-looking: the Company's expectations regarding the completion, timing
 and sizing of its proposed offerings; the Company’s business and investment strategy; the Company’s operating results; the Company’s ability to obtain and maintain financing arrangements; the return on equity, the yield
 on investments; and changes in business conditions and the general economy. The forward-looking statements are based on management’s beliefs, assumptions and expectations of future performance, taking into
 account all information currently available to the Company. Forward-looking statements are not predictions of future events. These beliefs, assumptions and expectations can change as a result of many possible events
 or factors, not all of which are known to the Company.

 This presentation may contain statistics and other data that in some cases has been obtained from or compiled from information made available by third-party service providers. The Company makes no representation or
 warranty, expressed or implied, with respect to the accuracy, reasonableness or completeness of such information.

 The information contained herein does not constitute investment, legal, accounting, regulatory, taxation or other advice and the information does not take into account your investment objectives or legal, accounting,
 regulatory, taxation or financial situation or particular needs. You are solely responsible for forming your own opinions and conclusions on such matters and the market and for making your own independent assessment
 of the information.

 With respect to the non-GAAP financial measures of adjusted EBITDA, adjusted EBITDA margin, core sales, and free cash flow referenced in the following presentation, definitions and the accompanying information
 required by SEC Regulation G can be found in the “Investors” section of Envista's website and can also be found at the end of this presentation. In this presentation, all figures relate to Envista’s continuing operations and
 sales amounts are in millions.

 Additional Information: Danaher Corporation (“Danaher”) commenced an offer to its stockholders to exchange their shares of Danaher common stock for shares of Envista common stock owned by Danaher on November
 15, 2019. The terms and conditions of the exchange offer are more fully described in the registration statement filed by Envista with the SEC and the Schedule TO filed by Danaher with the SEC. The prospectus, which is
 included in the registration statement, and other filed documents contain important information about Envista, Danaher, the exchange offer and related matters. Investors and security holders are urged to read carefully
 and in its entirety the prospectus and any other relevant documents filed with the SEC by Danaher and Envista, if and when they become available and before making any investment decision. None of Danaher, Envista,
 or any of their respective directors or officers or any dealer manager appointed with respect to the exchange offer makes any recommendation as to whether investors should participate in the exchange offer. Investors
 will be able to obtain a free copy of the prospectus and other related documents filed with the SEC by Danaher and Envista at the SEC's website at www.sec.gov.

                                                                                                                                                                                                                  2
Exchange offering summary

           Issuer:                                  Envista Holdings Corporation (“NVST” or “Envista”)
                                                    Up to an aggregate of 127,868,000 shares* of NVST common stock, representing a ~$3.6bn total deal
           Offer to Exchange:
                                                    value1, for outstanding shares of Danaher Corporation (“DHR” or “Danaher”) common stock

           Target Discount on NVST:                 7% based on average VWAPs of DHR and NVST during the Averaging Period (subject to the Upper Limit)

           Upper Limit:                             5.5784 shares of NVST per share of DHR validly tendered

           Averaging Period:                        Expected to be December 9, 10 and 11, 2019

           Expiration:                              Expected to be 12:00 midnight, New York City time, at the end of the day on December 13, 2019

           Exchange / Ticker:                       NYSE / NVST

           Dealer Managers:                         Goldman Sachs & Co. LLC; J.P. Morgan Securities LLC

           Minimum Condition:                       30% shares of NVST distributed (38,360,400 of NVST distributed)

           * representing Danaher’s entire remaining interest in Envista

1   Total deal value based on a full distribution of Danaher’s remaining interest in Envista, at the Envista closing price as of November 29, 2019.   3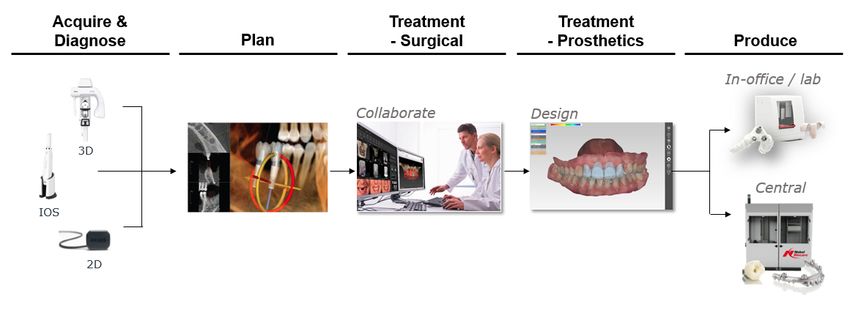
Recent updates
Investments beginning to                                                                                              +DD                                    +MSD
                                                                                                            China Core Growth                        Ormco Core Growth
enhance growth                                                                                              through 3rd Quarter                      through 3rd Quarter

Traction on cost initiatives
                                                                                                               +100 BPS                                      +12%
improving margin and cash flow
                                                                                                                  Specialty Q3 OMX                      Q3 free cash flow1

Significant new products
in development for 2020+
                                                                                                               Clear aligners                Digital / IOS    Implants

                                   Making progress towards enhanced business performance
1: Free cash flow is a non-GAAP financial measure. For a reconciliation to the most directly comparable GAAP measure, please see Appendix.
                                                                                                                                                                 4
Investment highlights

       Positioned to accelerate growth with a leading position in some of the most attractive
       segments of Dental

       Significant opportunity to expand margins through operating leverage, productivity
       initiatives and improving portfolio mix

       Flexible capital structure and strong cash flow profile for M&A to further improve growth
       profile

  Leveraging the Envista Business System to create long-term shareholder value
                                                                                      5
Envista at a glance                                                               Sales
                                                                                By segment

                                                                                           48%
Outstanding brands with leading
                                                                                                                           $2.8B
                                                                                                 52%

positions                                                                                               >70% Consumables

                                                                                Equipment & Consumables
                                                                                Specialty Products & Technologies          Total Sales

Dental market has strong secular                                                 By geography
growth drivers
                                                                                                                           ~56%
                                                                                           6%

                                                                                                 23%
                                                                                       23%

Scale in faster growing areas:                                                                   48%                       Gross Margin
Emerging Markets (“EM”),                                                         EM     NA       W-EU     ROW

Implants & Orthodontics
                                                                                   By channel                              Mid-teens
                                                                                       0
                                                                                                                           EBITDA Margin1
                                                                                                 49%
                                                                                       51%
All financial metrics based on 2018 unless otherwise indicated; all pie chart
percentages are % of 2018 sales; ODM = Other Developed Markets

1: EBITDA Margin is a non-GAAP financial measure. For a reconciliation to the      Distributor     Direct
most directly comparable GAAP measure, please see Appendix.
                                                                                                                                            6
Envista senior management team
                Amir Aghdaei                               Operating Leaders
                    President & CEO
                                                               Amir Aghdaei               • 11 years with DHR
                                                                                          • Led Dental business since December 2015
                                                               President & CEO            • Prior President of DHR Communications Platform
  Patrik Eriksson                Hans Geiselhöringer
President, KaVo Kerr            President, Nobel Biocare
                                                               Howard Yu                  • 8 years with DHR, including 3 years with Beckman
                                                                                            Coulter
                                                               CFO                        • Prior CFO of Nobel Biocare and Ormco
  Filippo Impieri                        Jeff Kappler
  Special Markets                      President, Ormco
                                                               Patrik Eriksson            • 7 years with DHR / Envista
                                                                                          • Prior President of Ormco
                                                               President, KaVo Kerr       • >25 years in dental industry
    Howard Yu                          Curt Bludworth
      CFO                                  CHRO
                                                               Hans Geiselhöringer        • Joined DHR as part of Nobel Biocare acquisition
                                                                                            in 2014
                                                               President, Nobel Biocare   • >30 years in dental industry
    Mischa Reis                         Mark Nance
Strategy & Corp Dev                    General Counsel
                                                               Jeff Kappler               • 12 years with DHR, including 3 years with Fluke
                                                                                            and 5 years with Veeder-Root
                                     John Marotta              President, Ormco           • Led Latin America and Imaging / Sensor business
   Claudia Ortiz                                                                            for Envista
                                   Envista Business
      RA/QA
                                Systems & Supply Chain
                                                               Julie Xing                 • 19 years of experience in pharmaceutical, biotech,
                                                                                            diagnosis, and other areas within the healthcare
                       Julie Xing                              President, China             industry
                    President, China

              Team responsible for transformation in place since 2016                                                      7
Relationships Built on Respect        Better Choices, Better Outcomes
Leadership                            Lean and Fundamentals

      Innovation in Action       Continuous Improvement as a
      Growth                     Competitive Advantage
                                 Envista Business System

                                                        88
                                                                  8I
EBS drives Envista transformation
Pre-2016 Today Current / future work
>10 OpCos 3 OpCos Further cost reduction
- Target additional annualized
>40 Mfg sites >25% reduction savings
- Consolidate MFG sites
>190 Locations - Reduce TU/IMG brands
>40% reduction
Commercial execution
Multiple competing Imaging/Treatment - Multi-brand implant
brands/OpCos Unit brands from
- EM expansion
11 to 6
Limited G&A Consolidation of back- New product development
leverage office functions - Spark, Implants, Digital
Focus on improving core growth and margin expansion
Note: Envista Business System (EBS) 9Business segments Specialty Products & Technologies Equipment & Consumables World-class implant and orthodontic systems Comprehensive portfolio with strong brands • Total Sales: ~$1.4B • Total Sales: ~$1.5B • EBITDA Margin: >20% • EBITDA Margin: >10% • Channel: >90% Direct • Channel: >90% Distribution Strong position with leading brands in some of the most attractive segments of Dental Note: All financial metrics based on 2018 unless otherwise indicated 10
Leading player in some of the most
attractive segments of dental
                                                                  Segment   Segment
          Envista                      Category                                        Key brands
                                                                    size1   growth2

                                       Imaging                      $2B       MSD

           Equipment &                 Instruments / Treatment
                                                                    $4B       LSD
           Consumables                 units / Other equipment

                                       Consumables                  $7B       LSD

                                       Implants                     $5B       MSD
              Specialty                                Wires &
             Products &                                             $2B       LSD
                                                       brackets
            Technologies               Orthodontics
                                                       Clear
                                                                   $2.5B     >10%
                                                       aligners

                                       Envista’s brands have a long track record of success
1Represents estimated 2018 industry size
2Represents estimated growth over last three years                                              11
Source: Management estimates, iData, public reports
Secular trends support long-term
market growth
An aging population Dental digitization DSO growth EM: Middle-class
+1B people over DD+ growth in digital HSD growth of DSOs2 +1.5B EM middle-class
age 60 by 2050 diagnostics penetration1 people by 2030
• >20% of 60+ yr lost all teeth • Transforming dentist’s work • Increased dental access • Increased dental access
• More complex dental cases • Drives procedure de-skilling • Growing specialties • Growing discretionary $
spend
Strong drivers that support improving Specialty penetration
Source: United Nations. Global Economy and Development Working Paper 100 of the Brookings Institution, public reports, management estimates
1 3D Imaging and standalone intra-oral scanner penetration in the US growing fromDemonstrated success in China
Envista Greater China sales
2011 Today
Equipment &
Products Complete portfolio
ortho
2 small rep offices ~10 offices
DD+CAGR Local Presence ~40 associates >900 associates
Coastal cities All Tier 1 & 2 cities
$213M
Local R&D None >30 engineers
Manufacturing
None 2
Sites
$200M in annual sales with DD+ growth
13Sales growth acceleration: Commercial
investments
Investment in SG&A
“Feet on the street” ($ in millions)
• >3,000 employees in our commercial organization, >400 in China
$1,131
• 10% growth since 2016 $1,056
Training & education
• >100,000 dentists reached each year through >4,000 events
Service infrastructure
• Daily dentist interactions
2016 2018
• Field & remote service capability in North America
% of sales 38% 40%
Significant commercial scale with deep clinical and workflow expertise
14Sales growth acceleration: Innovation
investments
Investments R&D spend
>$475M +$30M ~2X
($ in millions)
~$170
Cumulative
Software engineer
R&D spend Annual R&D spend
increase
(2016-2018) (2018 vs. 2016)
(2018 vs. 2015)
Results – investment areas ~$140
• Development & introduction of Spark clear aligners
• Developing differentiated N1 implant system
• Strengthening digital capabilities – imaging and workflow software
2016 2018
% of sales 5% 6%
Innovation to drive sustainable competitive advantage
15Driving sustainable long-term core
growth1 LSD / MSD
LSD
FLAT
2018 core growth New product Impact from product Emerging Additional growth Further emerging Long-term core
introductions rationalizations market penetration from new products market revenue growth
penetration
Combination of rationalization, EM and new products accelerates growth
1 These are not projections and do not constitute guidance; they are growth drivers and are subject to significant business, economic, regulatory and competitive uncertainties and contingencies,
many of which are beyond the control of the Company and its management, and are based upon assumptions with respect to future decisions, which are subject to change. Actual results will vary 16
and those variations may be material. Nothing in this presentation should be regarded as a representation by any person that these drivers will be achieved and the Company undertakes no duty to
update this information.Growth drivers by segment
EM Brand Major
penetration rationalization new products
Specialty Products Value
& Technologies Implants
N1/Surface
technology1
Equipment &
Consumables
X Pro X500
1 Regulatory approvals not yet received for N1. Not for sale in the U.S. 17Spark clear aligner system
Highlights
• Advanced clear aligner technology
• Target Ormco’s core Orthodontist customer base
• Available in Australia and the US
Differentiators
• TruGEN™ material is designed to be clearer than the
leading competitor
• Spark’s™ custom trays are designed to enhance patient
comfort
• Spark™ is proven to have minimal aligner stain
Broader introduction in 2020 expected to contribute to Specialty growth
18N1 Implant System
Lowering barriers of adoption for patients
and clinicians
Reducing • Minimally invasive, less trauma to bone
Patient fear of • Less discomfort, noise and vibration
surgery • Drill speed 50 rpm vs >1,000 rpm1
Enabling more • Shorter learning curve and faster to train
clinicians to • More control and guidance, gentle shaping of bone
perform surgery instead of invasive cutting; 2 tools vs 5-6 drills1
Shorter time-to- • Faster integration of implant with bone (reduction of
healing time by 2/3)2
teeth with higher • Immediate restorations embrace better soft tissue
predictably integration, enhances short and long-term performance
Initial launch in Europe in 2020 and anticipate other geographies to follow
Note: Regulatory approvals not yet received for N1. Not for sale in the U.S.
1 Conventional
19
2 Internal pre-clinical dataDTX StudioTM software suite
DTX Workflow
• All clinical patient images /
files in one place
• One system: image
acquisition through
treatment delivery
• Easy, efficient
collaboration
• Multi-specialty
• Open architecture
• Usage info (e.g.
equipment productivity)
DTX Studio™ ecosystem provides simple workflows designed to enhance user experience
20X Pro / X 500 Intraoral Scanner (IOS)
X Pro X 500
X Pro
Seamless workflow integration – designed for DTX
Feature set comparable with other leading offerings
X500
Strong point solution - bridge to DTX studio
OEM partnership
Opportunity to serve different segments of IOS market
21Expanding operating margin
Margin opportunity Long-term margin expansion1
1 Operating leverage
Portfolio mix – higher growth Specialty
2 Products and Technologies business
3 Benefits of cost reduction initiatives
Operating margin Revenue growth Higher Specialty Cost savings Long-term
today fall-through mix operating margin
Operating leverage, portfolio mix and cost reduction drive >200bps of margin expansion
1 These are not projections and do not constitute guidance; they are growth drivers and are subject to significant business, economic, regulatory and competitive uncertainties and contingencies, many of
which are beyond the control of the Company and its management, and are based upon assumptions with respect to future decisions, which are subject to change. Actual results will vary and those variations 22
may be material. Nothing in this presentation should be regarded as a representation by any person that these drivers will be achieved and the Company undertakes no duty to update this information.Reducing complexity, footprint and
cost structure Imaging / treatment unit brand
Cost savings target consolidation
# brands
Indirect Costs $15M Material >40%
Productivity
$15M 2015 2018 2022
Site consolidation
$60M # sites
>35%
annualized
2015 2018 2022
savings
Supplier consolidation
# suppliers >20,000
Productivity
initiatives $30M 2018 2022
Significant long-term opportunity for cost reduction
23Capital deployment priorities
Envista M&A approach Capacity to execute
# M&A deals
Market
2003 - 2015 >25
Company
2016 - 2018 2
Valuation
2016 – 2018
FCF1
>$1B
Nimbleness to build a better Envista
1: Free cash flow is a non-GAAP financial measure. For a reconciliation to the most directly comparable GAAP measure, please see Appendix. 24Envista M&A priorities
Focus on most attractive segments / geographies
Platform
bolt-ons Enter low share / low penetration categories
Technology
Gain access to new technologies impacting dentistry
acquisitions
and Leverage strong brand and/or channel of Envista
investments
Enter attractive near-in dental adjacencies
Adjacencies
Focus where we have “right to play”
Enhancing Envista growth with small / mid-size opportunities
25Envista strategy
Core sales growth1,2 Margin expansion1
Flat today to +LSD/MSD long-term Mid-teens EBITDA margin2 today with
meaningful expansion
Acquisition growth Continuous improvement
>$1B free cash flow2 over last 3 years EBS at the core of what we do
Strong EPS growth and compounding returns
1 These are not projections and do not constitute guidance; they are growth drivers and are subject to significant business, economic, regulatory and competitive uncertainties and contingencies, many of which are beyond the control of the Company and its management, and
are based upon assumptions with respect to future decisions, which are subject to change. Actual results will vary and those variations may be material. Nothing in this presentation should be regarded as a representation by any person that these drivers will be achieved and the
Company undertakes no duty to update this information.
26
2 : Core sales growth, free cash flow and EBITDA margin are non-GAAP financial measure. For a reconciliation to the most directly comparable GAAP measure, please see Appendix.27
Appendix

           28
Historical growth performance
Historical core growth Sales growth drivers
2017 2018 • Equipment and Consumables impacted by:
• Distributor realignment
4.0%
3.5%
• Distributor de-stocking
• Emerging markets grew at high-single digit
0.5% rates
0.0%
• Specialty business experienced growth across
regions
-2.5%
-3.5%
Specialty E&C Envista
Stable growth in Specialty and Emerging Markets
29Historical margin performance
Historical Adjusted EBITDA margin1 Margin drivers
($ in millions)
$563 • Continued growth investments
• Research and development
$491 • Sales and marketing
• Margin impact from distributor destocking and
realignment
2016A Adjusted R&D S&M Other cost 2018A Adjusted
EBITDA investments investments increases; EBITDA1
Gross profit
changes
Continued investment to set business up for success
1: Adjusted EBITDA and Adjusted EBITDA margin are non-GAAP financial measures. For a reconciliation to 30
the most directly comparable GAAP measures, please see Appendix.Envista history
Acquire / Build Transformation
2004 2006 2008 2010 2012 2014 2016 2017 2018
Equipment &
Imaging
Consumables Consolidation
Orthodontics Dental
Complex
Sybron
Dental
Implants
Consolidation
Built from >25 acquisitions, focused on integration / consolidation of platform since 2016
31Reconciliation of Adjusted EBITDA
Nine-Month Period Ended Year Ended December 31
September September September
($ in millions) 20181 2018 2017 2016
27, 20191 27, 2019 28, 2018
(unaudited) (unaudited) (unaudited) (unaudited)
Reported Net Earnings (GAAP) $153.2 $161.5 $179.5 $219.2 $230.7 $301.1 $272.0
Interest expense, net 11.4 0.2 - 15.2 - - -
Income taxes 36.5 39.4 53.2 66.7 70.4 85.6 129.7
Depreciation 29.8 29.8 29.1 39.4 39.4 39.7 43.8
Amortization 67.3 67.3 68.0 90.6 90.6 81.7 83.4
EBITDA (Non-GAAP) $298.2 $298.2 $329.8 $431.1 $431.1 $508.1 $528.9
-
Accruals for significant legal matters - - 36.0 36.0 - -
Restructuring costs and asset impairments 8.7 8.7 17.3 23.7 23.7 35.8 34.4
-
Settlement of liabilities - - - - (10.4) -
Adjusted EBITDA (Non-GAAP) $306.9 $306.9 $347.1 $490.8 $490.8 $533.5 $563.3
Sales $2,031.1 $2,031.1 $2,085.5 $2,844.5 $2,844.5 $2,810.9 $2,785.4
EBITDA Margin (EBITDA/Sales) 14.7% 14.7% 15.8% 15.2% 15.2% 18.1% 19.0%
Adjusted EBITDA Margin (Adjusted
15.1% 15.1% 16.6% 17.3% 17.3% 19.0% 20.2%
EBITDA/Sales)
1: Pro forma - The unaudited pro forma information set forth below reflects Envista’s historical audited combined annual and unaudited consolidated and combined interim financial
information, as adjusted for interest expense and related tax effect to give effect to the separation from Danaher, initial public offering and related debt transaction, collectively, the
“Transaction” as if the Transaction had occurred on January 1, 2018. The unaudited pro forma information is illustrative and not intended to represent what Envista’s results of
operations or financial position would have been had the separation occurred on the date indicated or to project Envista’s results of operations or financial position for any future 32
period.Reconciliation of Free Cash Flow
Three-Month Period Ended Year Ended December 31
September September
2018 2017 2016
($ in millions) 27, 2019 28, 2018
(unaudited) (unaudited)
Net cash used in investing
($20.7) ($9.6) ($75.5) ($54.9) ($59.4)
activities (GAAP)
Net cash provided by (used in)
111.2 (70.6) (324.6) (304.2) (357.6)
financing activies (GAAP)
Net cash provided by
$97.8 $80.2 $400.1 $359.1 $417.0
operating activities (GAAP)
Less: payments for additions to
property plant & equipment (19.8) (9.6) (72.2) (48.9) (49.1)
(capital expenditures) (GAAP)
Plus: proceeds from sales of
property, plant & equipment 1.2 - - 0.1 0.9
(capital disposals) (GAAP)
Free Cash Flow (Non-GAAP) $79.2 $70.6 $327.9 $310.3 $368.8
33Reconciliation of Core Sales Growth
Consolidated Core Sales Growth
2018 vs. 2017 2017 vs. 2016
Total sales growth (GAAP) 1.0% 1.0%
Less the impact of:
Currency exchange rates -0.5% -1.0%
Core sales growth (non-GAAP) 0.5% 0.0%
Specialty Products & Technologies Core Sales
2018 vs. 2017 2017 vs. 2016
Growth
Total sales growth (GAAP) 4.5% 5.0%
Less the impact of:
Currency exchange rates -1.0% -1.0%
Core sales growth (non-GAAP) 3.5% 4.0%
Equipment & Consumables Core Sales Growth
2018 vs. 2017 2017 vs. 2016
Total sales growth (GAAP) -1.5% -2.5%
Less the impact of:
Acquisitions and other -0.5% 0.0%
Currency exchange rates -0.5% -1.0%
Core sales growth (non-GAAP) -2.5% -3.5%
Note: We use the term “core sales” to refer to GAAP sales excluding (1) sales from acquired businesses recorded prior to the first anniversary of the acquisition (“acquisitions”), (2) sales from discontinued products and (3) the impact of currency
translation. Effective with the third quarter of 2019, Envista modified the definition of core sales to exclude the impact from sales of discontinued products on a prospective basis. The periods set forth in this presentation include the impact from sales
of discontinued products in core growth. Sales from discontinued products includes major brands or major products that the Company has made the decision to discontinue as part of a portfolio restructuring. Discontinued brands or products would
include those which the Company is no longer manufacturing, investing research or development and expects to discontinue all significant sales within one year from the decision date to discontinue. The portion of the sales attributable to
discontinued products is calculated as the decline in year-over-year sales for those products or brands which were discontinued in the current period. The portion of GAAP sales attributable to currency exchange rates is calculated as the difference
between (a) the period-to-period change in sales (excluding acquisition sales) and (b) the period-to-period change in sales (excluding acquisition sales) after applying current period foreign exchange rates to the prior year period. We use the term
“core sales growth” to refer to the measure of comparing current period core sales with the corresponding period of the prior year.
34Non-GAAP Reconciliation
Statement Regarding Non-GAAP Measures
Each of the non-GAAP measures set forth above should be considered in addition to, and not as a replacement for or superior to, the comparable GAAP measure, and may not be comparable to similarly titled measures reported by other companies.
Management believes that these measures provide useful information to investors by offering additional ways of viewing Envista’s results that, when reconciled to the corresponding GAAP measure, help our investors to:
• with respect to Adjusted EBITDA, understand the long-term profitability trends of Envista’s business and compare Envista’s profitability to
prior and future periods and to our peers;
• with respect to core sales, identify underlying growth trends in Envista’s business and compare Envista’s revenue performance with prior and future periods
and to Envista’s peers; and
• with respect to free cash flow (the “FCF Measure”), understand Envista ’s ability to generate cash without external financings, strengthen its balance
sheet, invest in its business and grow its business through acquisitions and other strategic opportunities (although a limitation of free cash flow is that
it does not take into account the Company’s debt service requirements and other non discretionary expenditures, and as a result the entire free cash
flow amount is not necessarily available for discretionary expenditures).
Management uses these non-GAAP measures to measure the Envista’s operating and financial performance.
The items excluded from the non-GAAP measures set forth above have been excluded for the following reasons:
• With respect to Adjusted EBITDA:
o Envista excludes the amortization of acquisition-related intangible assets because the amount and timing of such charges are significantly impacted by the timing, size, number and nature of the acquisitions Envista
consummates. While Envista has a history of significant acquisition activity, Envista does not acquire businesses on a predictable cycle, and the amount of an acquisition’s purchase price allocated to intangible assets and related
amortization term are unique to each acquisition and can vary significantly from acquisition to acquisition. Exclusion of this amortization expense facilitates more consistent comparisons of operating results over time between
Envista’s newly acquired and long-held businesses, and with both acquisitive and non-acquisitive peer companies. Envista believes however that it is important for investors to understand that such intangible assets contribute to
revenue generation and that intangible asset amortization related to past acquisitions will recur in future periods until such intangible assets have been fully amortized.
o Envista excludes costs incurred pursuant to discrete restructuring plans that are fundamentally different (in terms of the size, strategic nature and planning requirements, as well as the inconsistent frequency, of such plans) from
the ongoing productivity improvements that result from application of the Envista Business System. Because these restructuring plans are incremental to the core activities that arise in the ordinary course of Envista’s business
and Envista believes are not indicative of Envista’s ongoing operating costs in a given period, Envista excludes these costs from the calculation of Adjusted EBITDA to facilitate a more consistent comparison of operating results
over time.
o With respect to the other items excluded from Adjusted EBITDA, Envista excludes these items because they are of a nature and/or size that occur with inconsistent frequency, occur for reasons that may be unrelated to Envista’s
35 commercial performance during the period and/or Envista believes that such items may obscure underlying business trends and make comparisons of long-term performance difficult.
• With respect to core sales, (1) Envista excludes the impact of currency translation because it is not under management’s control, is subject to volatility and can obscure underlying business trends, (2) Envista excludes sales from
discontinued products because discontinued products do not have a continuing contribution to operations and management believes that excluding such items provides investors with a means of evaluating Envista’s on-going operations
and facilitates comparisons to its peers, and (3) Envista excludes the effect of acquisitions and divested product lines because the timing, size, number and nature of such transactions can vary significantly from period-to-period and
between Envista and Envista’s peers, which Envista believes may obscure underlying business trends and make comparisons of long-term performance difficult.
o In order to establish period-to-period comparability, beginning with the third quarter of 2019 (the first quarter during which Envista reported its results as a separate, public company), Envista modified the definition of core sales to
exclude the impact from sales of discontinued products on a prospective basis. The periods set forth in this presentation include he impact from sales of discontinued products in core growth.
• With respect to the FCF Measure, Envista excludes payments for additions to property, plant and equipment (net of the proceeds from capital disposals) to demonstrate the amount of operating cash flow for the period that remains after
accounting for its capital expenditure requirements.
35You can also read