Recommendations for what areas to prioritise PM2.5 monitoring in Northland airsheds - Prepared for Northland Regional Council June 2020 - Envirolink
←
→
Page content transcription
If your browser does not render page correctly, please read the page content below
Recommendations for what areas
 to prioritise PM2.5 monitoring in
        Northland airsheds

      Prepared for Northland Regional Council

                    June 2020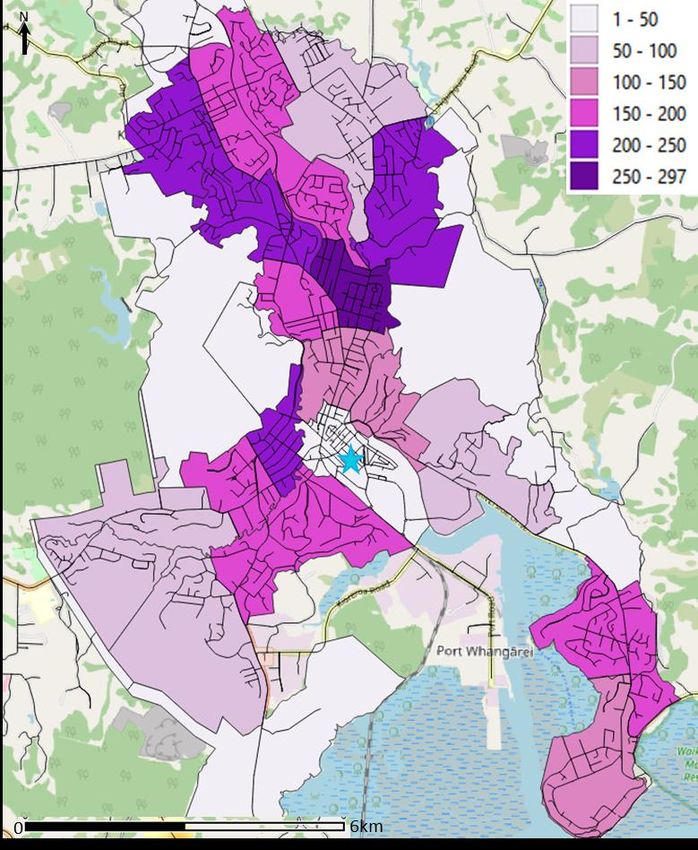
Prepared by:
Elizabeth Somervell

For any information regarding this report please contact:
Guy Coulson
Group manager
Air Quality and Health
+64-9-375 4503
Email: guy.coulson@niwa.co.nz

National Institute of Water & Atmospheric Research Ltd
Private Bag 99940
Viaduct Harbour
Auckland 1010

Phone +64 9 375 2050

NIWA CLIENT REPORT No:     2020110AK
Report date:               June 2020
NIWA Project:              ELF20103

 Quality Assurance Statement

                                Reviewed by:                    Guy Coulson

                                Formatting checked by:          Emma Hope-Ede

                                                                Jonathan Moores
                                Approved for release by:
                                                                Regional Manager, Auckland

© All rights reserved. This publication may not be reproduced or copied in any form without the permission of
the copyright owner(s). Such permission is only to be given in accordance with the terms of the client’s
contract with NIWA. This copyright extends to all forms of copying and any storage of material in any kind of
information retrieval system.

Whilst NIWA has used all reasonable endeavours to ensure that the information contained in this document is
accurate, NIWA does not give any express or implied warranty as to the completeness of the information
contained herein, or that it will be suitable for any purpose(s) other than those specifically contemplated
during the Project or agreed by NIWA and the Client.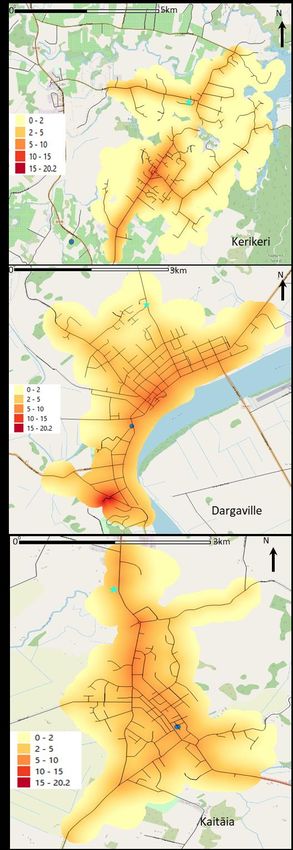
Contents

Executive summary ............................................................................................................. 5

1       Introduction .............................................................................................................. 6
        1.1      Method of Review .................................................................................................... 7

2       Data reviewed ........................................................................................................... 8
        2.1      Demographic data .................................................................................................... 8
        2.2      Emission source data ................................................................................................ 9
        2.3      Concentration data ................................................................................................. 18
        2.4      Climatology ............................................................................................................. 26

3       Airsheds .................................................................................................................. 28
        3.1      Whangārei............................................................................................................... 28
        3.2      Marsden Point ........................................................................................................ 29
        3.3      Kerikeri .................................................................................................................... 30
        3.4      Dargaville ................................................................................................................ 31
        3.5      Kaitāia ..................................................................................................................... 31

4       Conclusion and Recommendations ........................................................................... 33

5       Acknowledgements ................................................................................................. 34

Appendix A                     NZTA traffic counters in the Northland airsheds ................................ 35

Appendix B                     Meteorological sites for long-term climatology ................................. 37

Tables
Table 2-1:           Major industrial sources in or around NRC airsheds.                                                                     17

Figures
Figure 1-1:          The five designated airsheds in Northland.                                                                               7
Figure 2-1:          Population growth of districts in Northland 2006-2018.                                                                   8
Figure 2-2:          Annual Average Daily Traffic numbers recorded in Whangārei.                                                              9
Figure 2-3:          Annual Average Daily Traffic numbers recorded in Marsden Point.                                                         10
Figure 2-4:          Annual Average Daily Traffic numbers recorded in Kerikeri, Dargaville and
                     Kaitāia.                                                                                                                10
Figure 2-5:          Households using wood-burning for home-heating in Whangārei.                                                            13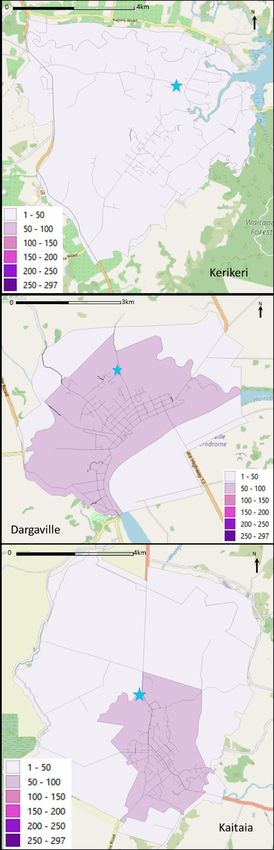
Figure 2-6:    Households using wood-burning for home-heating in Whangārei and Marsden
               Point airsheds.                                                                    14
Figure 2-7:    Households using wood-burning for home-heating in Kerikeri, Dargaville and
               Kaitāia.                                                                           15
Figure 2-8:    Example of ship movements into Marsden Point Port.                                 16
Figure 2-9:    Distribution of traffic related air pollution in Whangārei.                        19
Figure 2-10:   Distribution of traffic related air pollution in Marsden Point.                    20
Figure 2-11:   Distribution of traffic related air pollution in Kerikeri, Dargaville and Kaitāia. 21
Figure 2-12:   Long term record of Daily Average PM10 (µg.m-3) at Whangārei - Robert St and
               Ruakaka.                                                                           22
                                           -3
Figure 2-13:   Daily average PM10 (µg.m ) at temporary monitoring sites.                          23
Figure 2-14:   Boxplot of measured PM10 across Northland since 2012.                              24
                                               -3
Figure 2-15:   Monthly average PM10 (µg.m ) at Whangārei and Ruakaka.                             24
                                            -3
Figure 2-16:   Daily average PM2.5 (µg.m ) for Whangārei.                                         25
Figure 2-17:   Long-term monthly rainfall measured at relevant meteorological sites.              26
Figure 2-18:   Long-term monthly mean windspeed measured at relevant meteorological
               sites.                                                                             27
Figure 2-19:   Long-term monthly minimum temperature measured at relevant
               meteorological sites.                                                              27
Figure 3-1:    All relevant emissions and concentration information for the Whangārei
               airshed.                                                                           28
Figure 3-2:    All relevant emissions and concentration information for the Marsden Point
               airshed.                                                                           29
Figure 3-3:    All relevant emissions and concentration information for the Kerikeri airshed.
                                                                                                  30
Figure 3-4:    All relevant emissions and concentration information for the Dargaville
               airshed.                                                                           31
Figure 3-5:    All relevant emissions and concentration information for the Kaitāia airshed. 32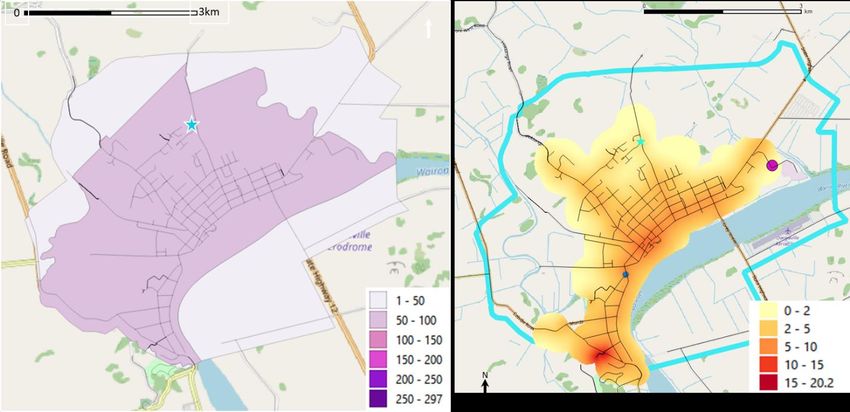
Executive summary
Northland Regional Council (NRC) have requested NIWA review all historical monitoring and
modelling data for Northland and formulate a monitoring plan for PM2.5 across their five regional
designated airsheds (Whangārei, Marsden Point, Kerikeri, Dargaville and Kaitāia). This plan will allow
each area to be screened for potentially elevated PM2.5 concentrations in anticipation of a National
Environmental Standard for PM2.5 being introduced in the near future.

Data of different types have been reviewed for each airshed:

   1.   Census data,

   2.   Emissions data from traffic, domestic heating and industrial sources,

   3.   Concentration data derived from the Traffic Impact Model and NRC PM10 and PM2.5
        monitoring, and

   4.   Terrain, land use and climatological data.

By combining these different types of information along with their relative impacts on potential
PM2.5 concentrations the following prioritisation for monitoring is recommended:

        1.   Whangārei, with a recommendation to move the monitoring site further north into the
             Whau Valley,

        2.   Kaitāia, due to its marginally elevated PM10 concentrations, to determine if these are
             caused mainly by sources of coarse fraction PM10 and not PM2.5,

        3.   Dargaville, as it has marginally higher wood-burner density,

        4.   Kerikeri because of its lower wood-burner density and finally,

        5.   Marsden Point, to gain greater understanding of the range of PM2.5 concentrations
             possible in the largely industrial area.

This review has been funded through an MBIE Envirolink Medium Advice Grant (ELF20103, MBIE
Contract C01X1917).

Recommendations for what areas to prioritise PM2.5 monitoring in Northland airsheds                   5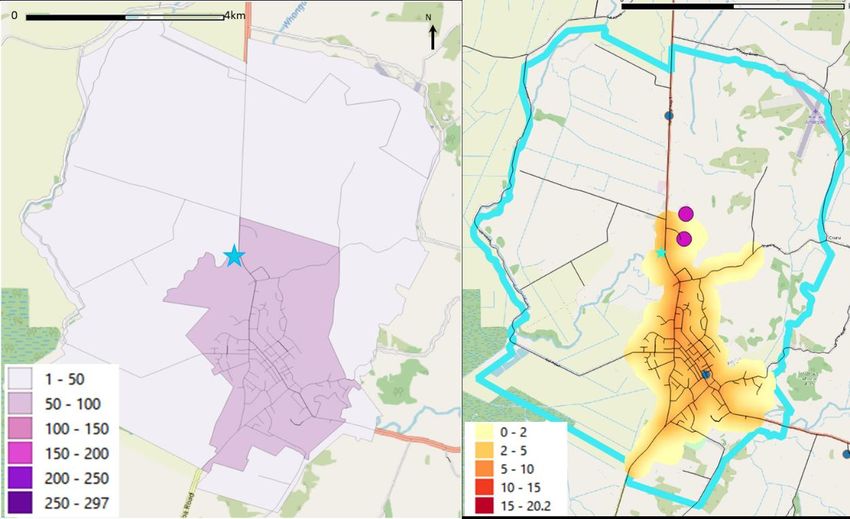
1       Introduction
Air quality is an important environmental health problem in New Zealand and is regulated under the
Resource Management Act (1991, RMA) and associated National Environmental Standards (NES).
Currently, there is no standard for PM2.5, that is concentrations of airborne particles no larger than
2.5 micrometres in diameter. However, a review of the NES is ongoing and is expected to result in a
new standard for PM2.5 in the near future.

Although, Northland Regional Council (NRC) does not have a statutory requirement under existing
legislation to monitor PM2.5, NRC wants to be prepared to commence regulatory monitoring, in a
reasoned and practical sequence of areas, beginning with areas that are most likely to have elevated
concentrations.

To that end, they have requested NIWA review historical monitoring and modelling data for
Northland and formulate a monitoring plan for PM2.5 across the five regional designated airsheds
(Whangārei, Marsden Point, Kerikeri, Dargaville and Kaitāia - see Figure 1-1), that will allow each area
to be screened for potentially elevated PM2.5 concentrations.

This review will provide the council with the relevant information to monitor and implement air
quality management plans for PM2.5.

This report outlines the review and provides details on:

         1.   the datasets used,

         2.   the methods used to estimate relative PM2.5 concentrations across the region’s
              airsheds,

         3.   a ranking of the five airsheds from potentially highest to lowest PM2.5 concentrations,
              and

         4.   a list of potential hotspots suitable for NES compliant monitoring, and more
              representative locations suitable for population health monitoring.

6                      Recommendations for what areas to prioritise PM2.5 monitoring in Northland airsheds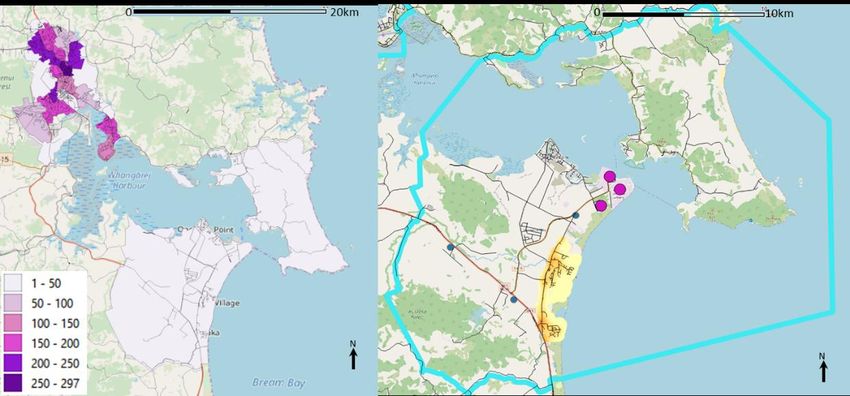
Figure 1-1:   The five designated airsheds in Northland.

1.1     Method of Review
Section 2 provides details about datasets used to rank the five airsheds in Northland and comprises
four sections:

   1.   Demographic, which gives some insight into the potential pressures on air quality,

   2.   Emission sources, which provides information about the variation in their expected strength
        and location, regardless of the extent of measurements that have been undertaken,

   3.   Concentration data, either measured or modelled which gives insight into the relative
        ambient air quality that can be expected in the airsheds, and

   4.   Climatological data, which includes long-term measures of meteorological variables.

Section 3 then looks at each airshed individually to determine where would be most suitable location
for NES compliant monitoring, and to anticipate the relative strength of PM2.5 concentrations that
can be expected in the airshed.

Recommendations for what areas to prioritise PM2.5 monitoring in Northland airsheds                   7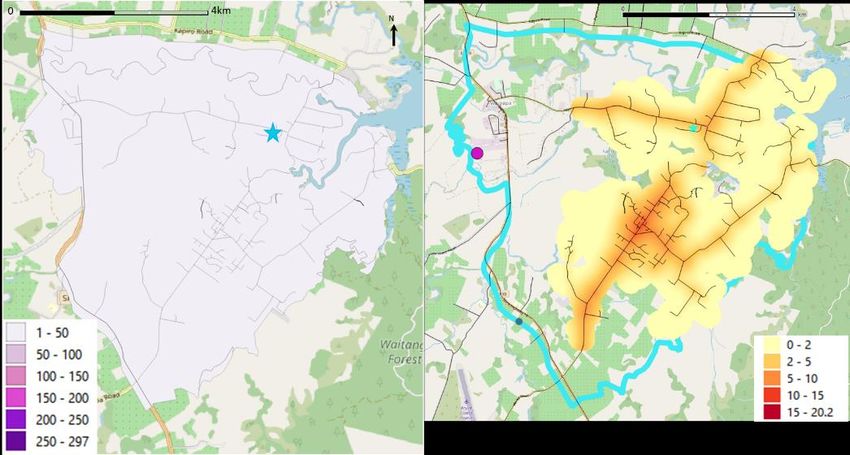
2       Data reviewed
This section provides details about datasets used to rank the five airsheds in Northland and
comprises four sections:

2.1     Demographic data
The New Zealand census takes place every five years (natural disasters permitting) and the most
recent was conducted in 2018. Currently only preliminary results are available, at the district level.
Figure 2-1 shows the population growth in Northland’s districts. Although growth was flat between
2006 and 2013, since then there have been steady increases in all three districts. Whangārei, which
includes the airsheds of Whangārei City and Marsden Point is growing by 3.4% per annum. The Far
North, which includes the airsheds of Kaitāia and Kerikeri is growing by 3.2% per annum. The Kaipara
district (including Dargaville) is growing the fastest, at 3.8% per annum but as it has a much lower
population, the absolute increase in pressure is lower than for Whangārei or the Far North. As a
comparison the annual growth in national population over the same period is 2.1%.

The demographic data suggests a steadily growing pressure on the environment, particularly in
population-based emissions from vehicles and domestic biomass burning. Whangārei, as well as
having the largest population, is also the smallest district and so the population density is greater,
producing a greater emission density that is continuously increasing.

Figure 2-1: Population growth of districts in Northland 2006-2018. Census data from ‘2018 Census
population and dwelling counts – amended.xlsx’, downloaded from https://www.stats.govt.nz/information-
releases/2018-census-population-and-dwelling-counts

8                      Recommendations for what areas to prioritise PM2.5 monitoring in Northland airsheds
2.2     Emission source data
The greatest source of PM2.5 is combustion of either fossil fuels or biomass. Although many different
activities include combustion and thus produce PM2.5 emissions, this review focusses on the
population dependent combustion emissions from traffic and domestic heating. Mention is made of
other sources but detailed analyses of these are excluded from this review. They include:

   1.   Stand-alone processing or industrial plants (such as cement and fertiliser plants, meatworks,
        dairy factories, timber processing, and fibre board manufacture plants), which are managed
        by the consenting process

   2.   Oil refining and energy production activities, also strictly controlled by the consenting
        process

   3.   the agricultural and horticultural sectors, including the use of seasonal or rural burning, and

   4.   bush or wildfires.

2.2.1 Traffic
The New Zealand Transport Agency (NZTA) maintains a network of automatic traffic counters
throughout New Zealand and publishes the counts at https://www.nzta.govt.nz/resources/state-
highway-traffic-volumes/

Figure 2-2, Figure 2-3 and Figure 2-4 show the Annual Average Daily Traffic (AADT) for the counters in
each of the five airsheds. The details of each counter, including location can be found in Appendix A.
The location of the counters are also included in the maps of traffic related air pollution found in
Section 2.3.1.

Figure 2-2: Annual Average Daily Traffic numbers recorded in Whangārei. Each line represents one NZTA
counter location. Details can be found in Appendix A.

Recommendations for what areas to prioritise PM2.5 monitoring in Northland airsheds                     9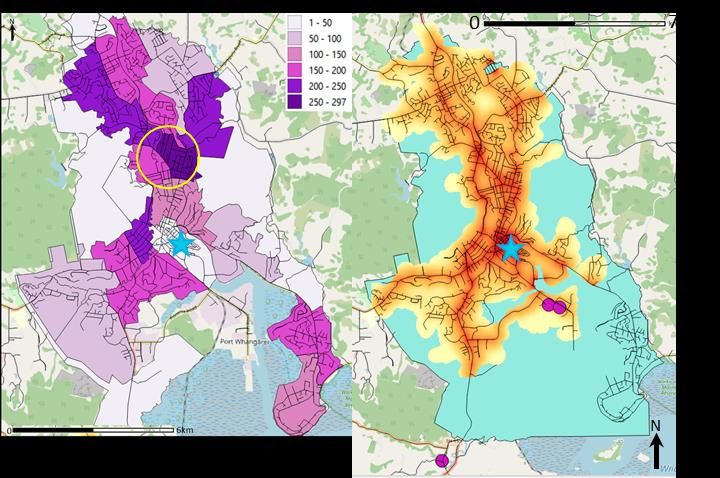
Figure 2-3: Annual Average Daily Traffic numbers recorded in Marsden Point. Each line represents one
NZTA counter location. Details can be found in Appendix A.

Figure 2-4: Annual Average Daily Traffic numbers recorded in Kerikeri, Dargaville and Kaitāia. Each line
represents one NZTA counter location. Details can be found in Appendix A.

From the counters arrayed around and along SH1 through Whangārei, traffic has grown between
2.6% and 4.4% per annum. In the Marsden Point airshed traffic has grown between 4.0% and 5.3%.
Traffic along SH1 by Kerikeri has grown 5.3% per annum, in Dargaville by 2.0% and in Kaitāia by 3.9%.
These increases are in line with population growth in the region.

While Whangārei and Marsden point have comparable traffic numbers, mostly between 12,000 to
20,000 vehicles per day, Whangārei has some counts that are growing towards 30,000 (counter IDs

10                      Recommendations for what areas to prioritise PM2.5 monitoring in Northland airsheds
01N00264 and 01N00267). These could be potential hotspots for traffic related air pollution,
including PM2.5.

However, total vehicle numbers are not the only factor in producing elevated concentrations.
Congestion and stop-start traffic significantly raise the impact of vehicle numbers, as each is more
likely to produce higher emissions per kilometre travelled.

Another factor is the type of vehicles. Heavy Duty Vehicles (HDVs) have large diesel engines that
produce more emissions than a standard passenger vehicle. The percentage of HDVs at the
Whangārei City counters ranges from 4.5 to 7.9%. The counters in the Marsden Point airshed see up
to 19.2% HDVs. This will have a significant impact on the traffic emissions at those sites. Counts at
the Marsden Point sites are also increasing at some of the greatest rates in the region - around 5%
per annum – indicating growing industrial activity in the area.

The AADTs for the counters in the three other airsheds are all substantially lower, ranging from
around 6,000 to 7,500 AADT.

Recommendations for what areas to prioritise PM2.5 monitoring in Northland airsheds                    11
2.2.2 Domestic Heating
There is no direct count of domestic wood-burners available for New Zealand cities or regions. The
closest proxy comes from the NZ census which includes a question about what methods people use
for heating their houses:

      “which types of heating are used most often in this dwelling”

(Stats NZ (2018). 2018 Census: Design of forms. Retrieved from www.stats.govt.nz)

Participants can choose as many options as are appropriate to them including wood and coal
burning. This data is not currently available for the 2018 census. Presented here are the results for
the 2013 census, at the Census Area Unit (CAU) level. We have taken the total number of households
that used wood-burning per CAU normalised by the area of that CAU. The spatial distribution of
those answers can be seen in Figure 2-5, Figure 2-6 and Figure 2-7.

Both the Marsden Point (Ruakaka site) and Kerikeri airsheds have the lowest density of wood burner
use among Northland’s airsheds. Kaitāia and Dargaville show slightly greater wood burner density in
their central townships. However, Whangārei clearly has the highest density and the highest
variation of density of wood burner use among the airsheds. There are several suburbs which may
have poorer air quality due to wood-burning, particularly Mairtown, Whau Valley, Kamo West, south-
east of Tikipunga and east of Woodhill. This area also has the highest traffic counts from the NZTA
counters.

The variation seen across Whangārei strongly suggests that while a single monitoring site might
adequately capture the air quality of the smaller townships, a number of potential sites might
represent Whangārei air quality equally well.

12                     Recommendations for what areas to prioritise PM2.5 monitoring in Northland airsheds
Figure 2-5: Households using wood-burning for home-heating in Whangārei. (households per square kilometre) (Blue star is the current monitoring site) Recommendations for what areas to prioritise PM2.5 monitoring in Northland airsheds 13
Figure 2-6: Households using wood-burning for home-heating in Whangārei and Marsden Point airsheds.
(households per square kilometre) (Blue star is the current monitoring site)

14                    Recommendations for what areas to prioritise PM2.5 monitoring in Northland airsheds
Figure 2-7: Households using wood-burning for home-heating in Kerikeri, Dargaville and Kaitāia.
(households per square kilometre) (Blue star was the temporary monitoring site)

Recommendations for what areas to prioritise PM2.5 monitoring in Northland airsheds               15
2.2.3 Additional sources

Marsden Point and shipping
Long-term data for shipping activity in and around Whangārei and Marsden Point is lacking, however
it is important to mention this extra source of pollution, as it could impact ambient air quality and is
expected to grow. Figure 2-8 gives an example of ships arriving into Marsden Point Port. Of particular
importance are the number of tankers and cargo ships which are burning fuel oil, and the number of
tug movements associated with those larger vessels. Tugs use diesel for fuel and so while they have
significantly less impact than the larger vessels, because their activity is continuous, they collectively
may also contribute to poorer air quality.

For comparison, the maximum number of ships arriving on any day in Marsden Point in Figure 2-8 is
20. The maximum for the same period at Tauranga Port was 26 and for Auckland was 193 (88 of
which were passenger ferries).

Figure 2-8: Example of ship movements into Marsden Point Port. from
https://www.marinetraffic.com/en/ais/details/ports/2741/_:058752d7206e132258a558864b4f7c49

16                     Recommendations for what areas to prioritise PM2.5 monitoring in Northland airsheds
Major consented industries
Table 2-1 shows other major industries which may contribute to ambient PM2.5 concentrations, along
with any consent conditions limiting their emissions, and their locations. These sources are shown in
the maps in Section 3.

Table 2-1:    Major industrial sources in or around NRC airsheds.

   Airshed          Industry       Easting    Northing       Description of        Description of Permitted
                                   (NZTM)     (NZTM)        Emission Activity              Emission

 Whangārei       Carter Holt       1720976    6043790     Three 9.5 MW wood        Consent limit cumulative
                 Harvey Building                          boilers                  emission of PM10 from
                 Products                                                          three boiler is 5.4 kg per
                                                                                   hour

                 Downer NZ         1721323    6043704     diesel fired hot-mix     Consent limit – TSP 250
                 limited                                  asphalt plant            mg/m3

                 Golden Bay        1717558    6038961     outside airshed but
                 Cement                                   discharge could
                                                          contribute to airshed.

                 Other sources are several sand blasting and boat repair sheds

 Marsden         Carter Holt       1733884    6031659                              TSP consent limit from
 Point           Harvey LVL                                                        wood fired boiler stack
                                                                                   150 mg/m3 and from
                                                                                   baghouse 50 mg/m3

                 New Zealand       1734839    6032508
                 Refining
                 Company

                 Northport         1734351    6033188     Various shipping
                                                          related activities

                 Other sources are sand blasting, cement batching plants

 Dargaville      Silver Fern       1680411    6023434     wood pallet boiler       TSP consent limit 250
                 Farms Limited                                                     mg/m3

                 Other sources are sand blaster, cement batching plant etc

 Kerikeri        Waipapa Pine      1683195    6102670     wood fired 6 MW          consent limit for TSP 330
                 Limited                                  boiler                   mg/m3

 Kaitāia         Juken NZ Ltd,     1623794    6117165     wood fired boiler        total TSP 2.8kg per hour.
                 Northland Mill                           stacks                   Individual stack limit 50
                                                                                   mg/m3.

                 Juken NZ Ltd,     1623758    6116702                              TSP from all stacks 7.8 kg
                 Triboard Mill                                                     per hour.

Recommendations for what areas to prioritise PM2.5 monitoring in Northland airsheds                             17
2.3 Concentration data Two types of concentration data are presented here: modelled traffic-related air pollution and measured PM10 and PM2.5 from NRC’s regulatory monitoring sites. 2.3.1 Traffic Impact Model Concentrations arising from traffic emissions have been estimated using NIWA’s Traffic Impact Model (TIM), which is derived from concentration data from the NZTA’s passive nitrogen dioxide (NO2) network (https://niwa.co.nz/atmosphere/research-projects/traffic-emissions-mapping-black- carbon-and-nitrogen-dioxide). The concentration data has been combined with CoreLogic’s traffic model (https://www.nzta.govt.nz/about-us/open-data/national-road-centreline-data-request). to allow the relationships between traffic and air pollution to be extrapolated to all urban areas around the country. The Traffic Impact Model is currently calibrated or scaled to NO2 rather than PM2.5, however, the spatial patterns will remain the same, regardless of what pollutant is expressed. So, the current model is useful in identifying potential hotspots of traffic related air pollution. Figure 2-9, Figure 2-10 and Figure 2-11 show the patterns of traffic related air pollution in the five Northland airsheds. The maximum concentrations are all moderate and below the WHO guideline value of 40 µg.m-3 for annual NO2 concentration. Therefore, the contribution of traffic to PM2.5 concentrations is unlikely to be significant. 18 Recommendations for what areas to prioritise PM2.5 monitoring in Northland airsheds
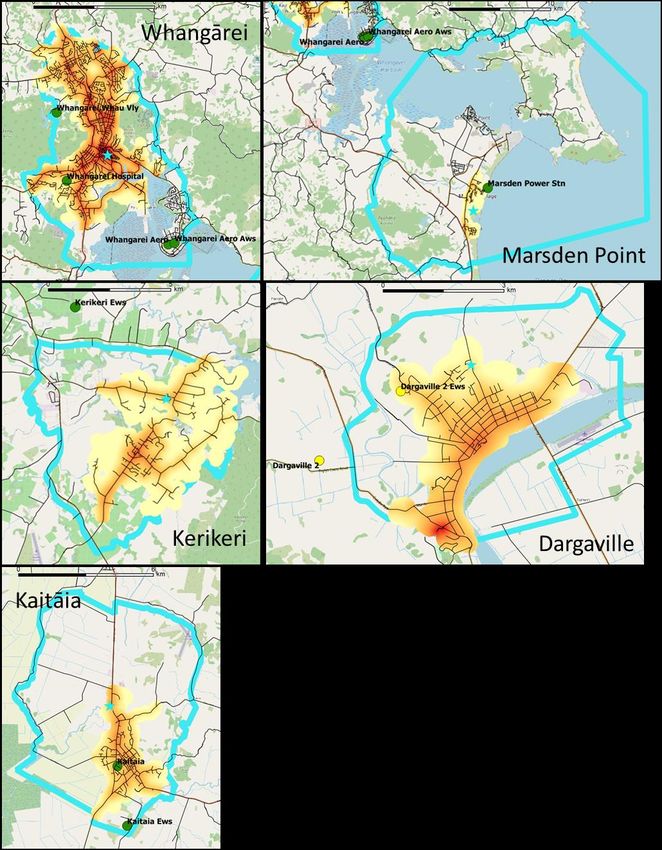
Figure 2-9: Distribution of traffic related air pollution in Whangārei. expressed as concentrations of NO2
(µg.m-3). NZTA traffic counters shown as blue dots. Robert St monitoring site as blue star.

Figure 2-9 shows that there are pollution hotspots away from the state highway, in the Whangārei
city centre just northwest of the current monitoring site.

Recommendations for what areas to prioritise PM2.5 monitoring in Northland airsheds                          19
Figure 2-10 shows the predicted concentrations for the Ruakaka township, which does not include
the larger area of the airshed, where the state highway runs. This is because the Traffic Impact Model
has only been developed for urban areas; the assumptions providing the basis of the model (in terms
of fleet makeup, emissions and dispersion characteristics) are only valid in urban areas, not industrial
areas. It is a fair assumption, based on the NZTA traffic counts, that the highest concentrations of
traffic related air pollution in the Marsden Point airshed will be at the intersection of SH1 and SH15,
rather than in the Ruakaka township.

Figure 2-10: Distribution of traffic related air pollution in Marsden Point. expressed as concentrations of
NO2 (µg.m-3). NZTA traffic counter shown as blue dot.

Figure 2-11 shows the spatial distribution over the three smaller airsheds. The model indicates that
the main intersection in Kerikeri has potentially high concentrations of traffic related air pollution.
Dargaville has an unusual hotspot in the south of the township which may be an artefact carried
through from the traffic model into the TIM. This irregularity should be ignored (pers. Comm., Ian
Longley, NIWA). Both Dargaville and Kaitāia have elevated concentrations along the main road, but
no substantial hotspots.

20                      Recommendations for what areas to prioritise PM2.5 monitoring in Northland airsheds
Figure 2-11: Distribution of traffic related air pollution in Kerikeri, Dargaville and Kaitāia. expressed as
concentrations of NO2 (µg.m-3). NZTA traffic counters shown as blue dots. NRC monitoring sites as blue stars.

Recommendations for what areas to prioritise PM2.5 monitoring in Northland airsheds                             21
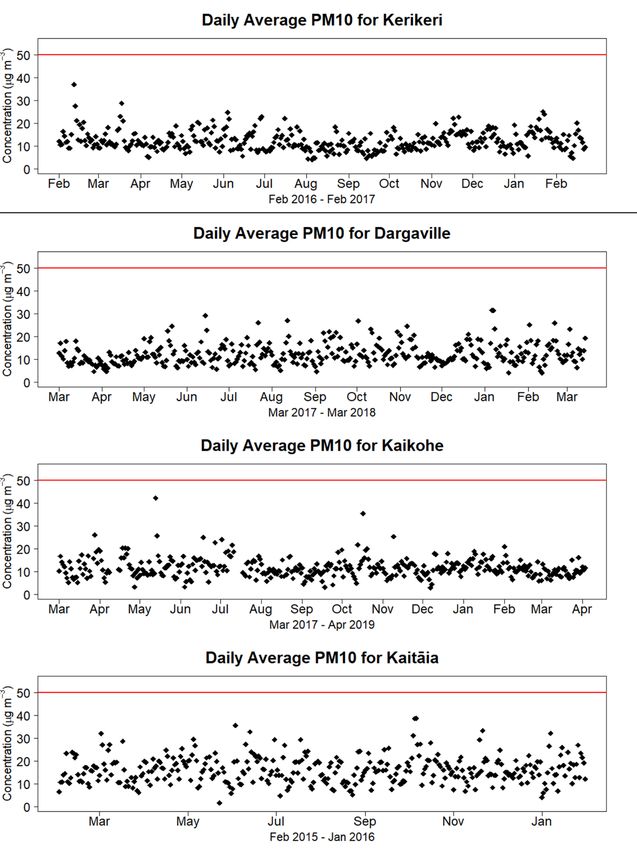
2.3.2 Measurement data from NRC - PM10
Northland Regional Council have two long-term measurement sites: one in the city centre of
Whangārei and one in Ruakaka in the Marsden Point airshed. In addition, temporary measurement
sites have been set up in Kaitāia, Kaikohe, Dargaville and Kerikeri for one year at a time.

Figure 2-12 shows the daily average concentrations of PM10 at Robert St in Whangārei city centre and
Ruakaka. Figure 2-13 shows the daily average concentrations of PM10 at the four temporary sites. The
NES concentration limit of 50 µg.m-3 is highlighted as a red line. The period of monitoring is also
noted. At no location has the NES been breached during monitoring except one day at Kerikeri (5th
October 2016) which reached 95.5 µg.m-3. This is off the scale of Figure 2-13. The 10-minute data for
that day shows a large pollution event in the evening, probably a fire near the monitoring site,
although no record of such an event could be found.

Figure 2-12: Long term record of Daily Average PM10 (µg.m-3) at Whangārei - Robert St and Ruakaka. NES
daily average concentration limit of 50 µg m-3shown by red line.

22                     Recommendations for what areas to prioritise PM2.5 monitoring in Northland airsheds
Figure 2-13: Daily average PM10 (µg.m-3) at temporary monitoring sites. NES daily average concentration
limit of 50 µg m-3shown by red line.

Recommendations for what areas to prioritise PM2.5 monitoring in Northland airsheds                       23
Although not directly comparable as the measurements were taken at different times, Figure 2-14
shows the daily average concentrations across the five airsheds and Kaikohe, in order to give a
general impression of the range of concentrations measured. Kaitāia stands out as having had
elevated concentrations compared to the other time series. There is no obvious reason for this, and
it does not necessarily mean that PM2.5 concentrations would also be above the regional norm. The
reason may be a source of coarser particles recorded only in the PM10 band of particle size.

Figure 2-14: Boxplot of measured PM10 across Northland since 2012.

Of the two ubiquitous PM2.5 emission sources, domestic heating follows a seasonal cycle that can be
difficult to pick out of a daily time-series. For this reason, Figure 2-15 shows the monthly average
concentrations for the two long-term time series. There is no discernible wintertime elevation. Often
there are summertime elevations, which could be due to more sea salt or natural dust in the
atmosphere. Similarly, for the temporary sites, no seasonal differences are noticeable.

Figure 2-15: Monthly average PM10 (µg.m-3) at Whangārei and Ruakaka. Winter months shaded in blue.

24                     Recommendations for what areas to prioritise PM2.5 monitoring in Northland airsheds
2.3.3 Measurement data from NRC - PM2.5

Northland Regional Council began measuring PM2.5 at their Whangārei site in July 2016. Figure 2-16
shows the daily average concentrations for PM2.5 up until mid-2019. Although no NES concentration
limit exists yet for PM2.5, the World Health Organisation (WHO) has a guideline limit of 25 µg.m-3 as a
daily average. This is shown in the figure as a red line. There is a clear seasonal pattern, with elevated
concentrations during the winter months, at times approaching the guideline limit. This is evidence
for some domestic wood-burning activity occurring in the vicinity of the measurement site.

Figure 2-16: Daily average PM2.5 (µg.m-3) for Whangārei. Red line is the WHO guideline value.

Recommendations for what areas to prioritise PM2.5 monitoring in Northland airsheds                    25
2.4     Climatology
The impact of air pollution can be modified by the meteorological conditions into which pollutants
are emitted. In this section, we present the seasonal cycles of three long-term variables which can
impact air pollutant concentrations. For each variable, at least 10 years of data are used. In order to
maximise the availability of such long-term measures, and to provide some indication of variation
within an area, we present data from all available sites rather than choosing one site per airshed.

The locations of all the meteorological sites used can be found in Appendix B. The absolute value of
these variables is less important than how the airsheds compare with one another, particularly
during the winter months when PM2.5 emissions are highest due to wood-burning.

2.4.1 Rainfall
Rain washes pollutant out of the atmosphere, so rainfall suppresses concentrations. Figure 2-17
shows the average amount of rain that can be expected in any given month. The airsheds experience
within 50 mm of same rainfall as one another, with Dargaville the driest area for most of the year
and Kerikeri the wettest.

Figure 2-17: Long-term monthly rainfall measured at relevant meteorological sites.

26                     Recommendations for what areas to prioritise PM2.5 monitoring in Northland airsheds
2.4.2 Mean Windspeed
Windspeed determines how quickly air pollution disperses. Pollutants will accumulate when the
windspeed drops off, which is most common overnight. Figure 2-18 shows that there are measurable
differences between the airsheds. Kaitāia and Dargaville are windier than Whangārei and Kerikeri.
Kerikeri is relatively sheltered compared to the other airsheds.

Figure 2-18: Long-term monthly mean windspeed measured at relevant meteorological sites.

2.4.3 Minimum Temperature
Low temperatures can prompt wood-burning emissions to increase as there is a greater need for
domestic heating. Figure 2-19 shows there is very little difference in average monthly temperatures
between the airsheds, as should be expected for areas that are relatively close to one another.

Figure 2-19: Long-term monthly minimum temperature measured at relevant meteorological sites.

Recommendations for what areas to prioritise PM2.5 monitoring in Northland airsheds               27
3       Airsheds
In this section, the figures show the various types of information from Section 2 together, in order to
more easily compare the spatial patterns of the data. From this we determine what level of PM2.5
concentrations might be expected across each airshed and where might be expected to experience
the greatest concentrations.

3.1     Whangārei
Whangārei is the airshed with the highest population. As such, air pollution here has greater health
impacts than in other airsheds. In this sense, situating the monitoring site in a location that captures
the exposure of the population is more important than in areas where the monitoring site represents
a smaller population. Figure 3-1 brings together the maps of sources and predicted concentrations
for Whangārei from previous sections.

Figure 3-1: All relevant emissions and concentration information for the Whangārei airshed. (Wood-burner
density on the left with the recommended monitoring area circled in yellow, and predicted traffic related air
pollution on the right, with pink dots locating consented emissions)

Average windspeeds (Figure 2-18) suggest there may be Issues with air pollution accumulating rather
than dispersing efficiently on still nights. This will be exacerbated by the terrain, as the main part of
the city runs along a valley. During calm periods the airflow will follow the terrain, sinking towards
the valley floor. In the PM2.5 record (Figure 2-16), elevated concentrations can be seen during the
winter period. The current monitoring site is located in an area expected to have some of the highest
concentrations of traffic related air pollution (Figure 2-9). However, the primary source of PM2.5 in
urban areas is woodsmoke and the monitor currently sits in an area with relatively low wood-burner
density (Figure 2-5 and Figure 3-1 below – first panel). Many areas have higher wood-burner density,
suggesting multiple areas that could provide an alternative monitoring site. As the NES specifies that
monitoring sites should be positioned where the worst air quality can be expected, the first option
would be to move further north into the Whau Valley-Mairtown area, where wood-burner density is
highest. The site would ideally still be close to the major roads to pick up the impact of traffic running

28                      Recommendations for what areas to prioritise PM2.5 monitoring in Northland airsheds
along SH1 as well as the larger woodsmoke source. The suggested area is circled in Figure3-1, left
panel.

3.2     Marsden Point
Marsden Point is a largely industrial area with a small residential population in the coastal town of
Ruakaka. Figure 3-2 brings together the maps of sources and predicted concentrations for Marsden
Point - Ruakaka from previous sections. Wood-burner density is minimal in Ruakaka, as is the impact
of traffic related air pollution, as predicted by the Traffic Impact Model. The area is flat and coastal
and so has very favourable dispersion.

Figure 3-2: All relevant emissions and concentration information for the Marsden Point airshed. (Wood-
burner density on the left, and predicted traffic related air pollution on the right, with pink dots locating
consented emissions)

There are three consented industrial sources (see Figure 3-2, second panel – purple dots) but these
are emitting at elevation rather than ground level, and so should not be impacting ground level
concentrations significantly. Figure 2-12 and Figure 2-15 show that PM10 concentrations measured at
Ruakaka are not cause for concern and peak over the summer, most likely due to higher amounts of
sea spray. Th amount of sea spray being measured in the coarse fraction of PM10 may be masking a
wintertime elevation of PM2.5.

Because much of the Marsden Point airshed is industrial rather than residential, this is the airshed
with the highest uncertainties about overall air quality. There is a high percentage of Heavy Duty
Vehicles moving in and out of the area along SH15, and it is unclear what ground level emissions are
being generated by the area’s everyday industrial activities. It may be worth conducting a screening
assessment in the areas outside of the Ruakaka township to understand this better, either with low
cost particle sensors, or using passive diffusion tubes for gas pollutants. However, in terms of the
concentrations experienced by the residential population of the airshed, PM2.5 should have little
impact.

Recommendations for what areas to prioritise PM2.5 monitoring in Northland airsheds                             29
3.3      Kerikeri
Figure 3-3 brings together the maps of sources and predicted concentrations for Kerikeri from
previous sections. The town of Kerikeri is relatively flat, with low wood-burner density. There is some
impact of traffic along the main road, which is slightly higher in expected concentrations than where
the temporary monitoring site was situated (blue star in figures). Kerikeri had the lowest average
windspeeds of all the airsheds (see Figure 2-18), indicating that dispersion here will be the least
efficient. However, there is no indication that concentrations of PM2.5 will be problematic.

Figure 3-3: All relevant emissions and concentration information for the Kerikeri airshed. (Wood-burner
density on the left, and predicted traffic related air pollution on the right, with pink dots locating consented
emissions)

30                       Recommendations for what areas to prioritise PM2.5 monitoring in Northland airsheds
3.4     Dargaville
Figure 3-4 brings together the maps of sources and predicted concentrations for Dargaville from
previous sections. Dargaville sits by a river in flat terrain and has slightly denser wood-burner
emissions than Kerikeri or Ruakaka. There is some impact of traffic along the main road (not counting
the hotspot in the southern part of the town – we are confident it is an artefact generated by the
modelled traffic data). Dargaville has the highest average windspeeds of the airsheds, so dispersion
should reduce any significant accumulation of pollution over winter. The previous location of the
monitoring site was along a minor road set back from the river. Situating the monitor along the main
road, near the river which should experience drainage flows during calm nights in winter, should
provide the best chance of capturing peak PM2.5 concentrations in Dargaville.

Figure 3-4: All relevant emissions and concentration information for the Dargaville airshed. (Wood-burner
density on the left, and predicted traffic related air pollution on the right, with pink dots locating consented
emissions)

3.5     Kaitāia
Figure 3-5 brings together the maps of sources and predicted concentrations for Kaitāia from
previous sections. Kaitāia has slightly higher wood-burner density than Ruakaka or Kerikeri in the
town and is also relatively flat. There are two consented activities to the north of the town, in the
centre of the airshed and the previous monitoring site was near these along the main road. However,
this is just on the edge of the highest wood burner density in Kaitāia and it may be advisable to move
the site further south into the town proper, so it is surrounded by woodsmoke in the winter. Figure
2-14 showed that Kaitāia’s PM10 concentrations were elevated compared to the other smaller

Recommendations for what areas to prioritise PM2.5 monitoring in Northland airsheds                           31
airsheds. This may have been the impact of meteorology that year, or it may indicate a local source
of PM10.

Figure 3-5: All relevant emissions and concentration information for the Kaitāia airshed. (Wood-burner
density on the left, and predicted traffic related air pollution on the right, with pink dots locating consented
emissions)

32                       Recommendations for what areas to prioritise PM2.5 monitoring in Northland airsheds
4       Conclusion and Recommendations

For the most part the concentration data and the estimates of relative emissions suggest that
concentrations of PM2.5 will be relatively low in the Northland airsheds and that little potential exists
for breaching a new NES concentration limit for PM2.5. The exception to this is Whangārei City, where
there is evidence of consistently elevated concentrations of PM2.5 during wintertime. The current
measurement site is in an area of potentially the lowest density emission source for woodsmoke,
although it is close to some of the highest impacts of traffic related air pollution. Testing a different
site further north in the suburb of Mairtown or Whau Valley, where the highest potential impact of
both traffic and woodsmoke coincide, is advisable.

This is the highest priority for new monitoring, in order to understand how poor air quality can be
over winter in Whangārei, particularly as it has the highest population density in Northland and so
the most people are exposed to these elevated concentrations.

For the remaining airsheds, we suggest considering Kaitāia, Dargaville and Kerikeri in the following
order:

Firstly, Kaitāia, as it had elevated an PM10 concentration distribution compared to the other airsheds.
It would be good to confirm that 2015-16 was either an anomalous year, or to identify a local source
of coarser particles. Secondly, Dargaville also has slightly higher wood-burner density with no
obvious anomalies or outstanding questions. We recommend considering moving the monitoring
closer to the river to capture the most polluted conditions.

Then Kerikeri. Although Kerikeri has slightly greater pollution from traffic it has the lowest wood
burner density, which is likely to be the most significant factor in determining PM2.5 concentrations.

Finally, an exploratory monitoring campaign around the Marsden Point airshed is advisable. Although
the woodsmoke emission source is minimal and the Ruakaka township itself may have the best PM2.5
concentrations of all the airsheds due to this and its coastal situation, there are high numbers of HDV
vehicles in the area, unknown industrial sources and shipping sources, which will have a much
greater impact on the PM2.5 record than on the PM10 concentration record. This may be currently
swamped with sea salt and other coarser natural particles in the PM10 record. In addition, the
Marsden Point airshed is geographically larger and so there may be more potential hotspots.

In terms of representative monitoring for population health assessments, almost any practical site
away from the main road will be suitable for the smaller four airsheds, as their emissions vary very
little spatially. The challenge arises in Whangārei where there is potentially a great deal of spatial
variation. It is possible that the current site will prove just as adequate for health monitoring, as a
site in a medium density wood burner area away from the state highway, such as Raumanga or Kamo
East. Only a screening campaign involving mobile monitoring or a network of low-cost sensors would
be able to determine which was closer to the average concentration across the airshed.

Recommendations for what areas to prioritise PM2.5 monitoring in Northland airsheds                    33
5       Acknowledgements
This review has been funded through an MBIE Envirolink Medium Advice Grant (ELF20103, MBIE
Contract C01X1917).

Thanks to Obi Khanal for all his advice and support.

34                    Recommendations for what areas to prioritise PM2.5 monitoring in Northland airsheds
Appendix A              NZTA traffic counters in the Northland airsheds
Table A-1:    NZTA traffic counters located in NRC airsheds.

   Airshed         Counter        NZMG        NZMG        AADT   AADT      AADT       AADT    AADT     %
                   Number          East       North       2014   2015      2016       2017    2018    HDV

 Kerikeri        01000015       2628962     6606655      5694    6119     6691        7275    7201    4.5

 Dargaville      01200151       2629607     6610833      5542    5615     5725        5869    6094    6.8

 Kaitaia         01N00112       2629126     6607312      5006    4985     4372        4377    4467    5.0

 Whangarei       01400000       2629683     6608229      19229   20180    20862       21242   21689   5.7

 Whangarei       01N00261       2629283     6606203      14698   15680    16151       17283   17944   4.9

 Whangarei       01N00262       2629017     6604791      18818   20876    20994       20908   21987   6.1

 Whangarei
 (close to       01N10265       2636981     6591601      12261   13131    13176       13583   14231   11.7
 Robert St)

 Whangarei
 (close to       01N00264       2640001     6588917      23282   26019    25449       25911   27378   13.4
 Robert St)

 Whangarei       01N00267       2643317     6593144      23925   25322    26547       27732   27652   19.2

 Whangarei       01N00268       2594816     6661592      16905   18013    19103       20206   20375   5.9

 Marsden
                 01N00287       2588781     6583883      11818   12898    13936       14547   14968   6.5
 Point

 Marsden
                 01N80291       2534362     6681265      15564   16603    17791       18796   19468   5.9
 Point

 Marsden
                 15A00006       2535015     6676513      3746    3705     3855        4249    4500    4.6
 Point

Recommendations for what areas to prioritise PM2.5 monitoring in Northland airsheds                   35
Figure A-1: Position of NZTA traffic counters within Whangārei, labelled with IDs. 36 Recommendations for what areas to prioritise PM2.5 monitoring in Northland airsheds
Appendix B              Meteorological sites for long-term climatology

Figure B-1:   Meteorological sites used for long-term climatology. Green and yellow dots.

Recommendations for what areas to prioritise PM2.5 monitoring in Northland airsheds         37
You can also read