Air Quality Conformity Analysis - 2018-2021 Statewide Transportation Improvement Program - Greater Portland Council of ...
←
→
Page content transcription
If your browser does not render page correctly, please read the page content below
June 2018                                      Air Quality Conformity Analysis

Air Quality Conformity Analysis

2018-2021 Statewide Transportation
Improvement Program

June 2018

Prepared by:

Maine Department of Transportation
Bureau of Planning
16 State House Station
Augusta, ME 04333-0016

With Assistance from:

Maine Department of Environmental Protection
Bureau of Air Quality
17 State House Station
Augusta, Maine 04333
June 2018                                                                                           Air Quality Conformity Analysis

                                                           CONTENTS

AIR QUALITY CONFORMITY ANALYSIS ................................................................................ 1
INTRODUCTION ....................................................................................................................... 1
MAINE’S AIR QUALITY DESIGNATIONS ................................................................................ 1
   Ozone .................................................................................................................................... 2

CONFORMITY REQUIREMENTS ............................................................................................. 4
   Regional Emissions Analysis.............................................................................................. 4

APPLICABLE TRANSPORTATION PLANS AND PROGRAMS ............................................... 5
   Transportation Plans ........................................................................................................... 5
   Transportation Improvement Programs ............................................................................. 5

INTERAGENCY CONSULTATION ............................................................................................ 6
METHODOLOGY ...................................................................................................................... 7
   Interagency Consultation .................................................................................................... 7
   Travel Demand Modeling ..................................................................................................... 7
   Build Scenario Emissions ................................................................................................... 9
   Conformity Determination ..................................................................................................10
   Public Comment ..................................................................................................................10

CONFORMITY TESTS .............................................................................................................10
ANALYSIS RESULTS ..............................................................................................................11
CONFORMITY DETERMINATION ...........................................................................................12
   Conclusion ..........................................................................................................................12

                                                         APPENDICES

APPENDIX A: MOVES Modeling Approach ......................................................................... A-1

                                                    LIST OF FIGURES

Figure 1: Maine’s Ozone Maintenance Areas………………………………………………………3
Figure 2: Conformity Process Flow ........................................................................................ 8
June 2018 Air Quality Conformity Analysis
LIST OF TABLES
Table 1: Maine’s Ozone Maintenance Areas by County and Municipality............................ 3
Table 2: 8-Hour Ozone Conformity Tests ..............................................................................10
Table 3: Non-Exempt Regionally Significant Projects .........................................................11
Table 4: Portland Area Conformity Tests ..............................................................................12
Table 5: Midcoast Area Conformity Tests .............................................................................12May 2018 Air Quality Conformity Analysis
Air Quality Conformity Analysis
INTRODUCTION
This report documents the air quality conformity determination for the 2018-2021 Statewide
Transportation Improvement Program (STIP). The report was prepared by the Maine
Department of Transportation (MaineDOT) and the Maine Department of Environmental
Protection (DEP) in coordination with Portland Area Comprehensive Transportation Committee
(PACTS) Metropolitan Planning Organization (MPO) and Kittery Area Comprehensive
Transportation System (KACTS) Metropolitan Planning Organization.
Transportation conformity is required under the Clean Air Act (CAA) and the Clean Air Act
Amendments of 1990 (CAAA). The purpose of the transportation conformity process is to
ensure that federally funded or approved transportation projects, programs and plans are
reviewed and evaluated for their impacts on air quality. Specifically, the projects and other
federally funded activities contained in the Long-Range Transportation Plan (LRTP) or STIP
may not cause or contribute to new violations, exacerbate existing violations, or interfere with
the timely attainment of air quality standards. The transportation conformity process requires the
active participation of all agencies (federal, state, and local) that implement federally funded
transportation projects and programs within the Portland and Midcoast areas.
This report demonstrates transportation conformity for Maine’s former maintenance areas for
the ozone National Ambient Air Quality Standards (NAAQS). This analysis has been prepared
in accordance with U.S. Environmental Protection Agency’s (EPA) final conformity rule. The
following sections of this report briefly discuss Maine’s air quality designations, identify the
applicable transportation plans/program in the conformity analysis, describe the interagency
consultation process, highlight the methodology used to perform the current analysis, and
present the final conformity determination.
MAINE’S AIR QUALITY DESIGNATIONS
The CAA requires EPA to set National Ambient Air Quality Standards (NAAQS) for pollutants
considered harmful to public health and the environment. The CAA established two types of
national air quality standards. Primary air quality standards set limits to protect public health,
including the health of "sensitive" populations such as asthmatics, children, and the elderly.
Secondary air quality standards set limits to protect public welfare, including protection against
decreased visibility, damage to animals, crops, vegetation, and buildings.
The EPA Office of Air Quality Planning and Standards (OAQPS) has set NAAQS for six
principal pollutants, which are called "criteria" pollutants. The six criteria pollutants are carbon
monoxide, lead, nitrogen oxides, particulate matter, ozone, and sulfur dioxides.
Areas that do not meet the NAAQS are designated as nonattainment areas and, as a result, are
subject to transportation conformity. Maintenance areas are geographic regions that were
previously designated as nonattainment, but are now consistently meeting the NAAQS.
Transportation conformity requires nonattainment and maintenance areas to demonstrate that
all future transportation projects will not hinder the area from reaching and maintaining its
attainment goals.
1June 2018 Air Quality Conformity Analysis
Maine previously had two regions (Portland and Midcoast) designated as maintenance areas for
the 8-hour ozone standard and one small area (downtown Presque Isle) designated as a
maintenance area for PM10. No carbon monoxide, lead, nitrogen oxides, or sulfur dioxide
nonattainment areas have been identified in Maine.
Ozone
In 1997, the EPA issued the 8-hour Ozone NAAQS. Based on the available evidence, EPA
determined that the previous 1-hour ozone standard was inadequate for protecting public
health. Scientific information shows that ozone can affect human health at lower levels, and
over longer exposure times than one hour. The 8-hour NAAQS for Ozone was revised on March
27, 20081 from 0.08 parts per million (ppm) over an 8-hour period to 0.075 ppm. The fourth
highest value in a year, rounded to the nearest 0.001 and averaged over three years, may not
exceed this level at any monitor in the area. The revised standard was effective May 27, 2008.
On July 20, 2012, the entire State of Maine was designated as attainment for the 2008 8-hour
ozone NAAQS, thus transportation conformity is not required for the 2008 NAAQS. Under the
previous (1997) ozone NAAQS, Maine had two regions (Portland and Midcoast) designated as
maintenance areas and subject to transportation conformity requirements under the Clean Air
Act. On February 13, 2015 EPA published a final rule that revoked the 1997 ozone NAAQS for
all purposes, including transportation conformity.
On February 16, 2018, the U.S. Court of Appeals for the District of Columbia vacated major
portions of the 2015 rule that established procedures for transitioning from the 1997 NAAQS to
the 2008 NAAQS. As a result of this decision, the State of Maine is once again subject to
transportation conformity requirements for the Portland and Midcoast 8-hour ozone
maintenance areas established under the 1997 ozone NAAQS.
Figure 1 shows the boundaries of Maine’s two former 8-hour ozone maintenance areas and
their relationship to the two metropolitan planning areas. The Portland 8-hour ozone
maintenance area encompasses portions of four counties, and includes 55 municipalities. The
Portland ozone area also encompasses the transportation planning jurisdictions of the KACTS
and PACTS MPOs. The Midcoast 8-hour ozone maintenance encompasses portions of four
counties and includes 54 municipalities. Table 1 describes each ozone maintenance area by
county and municipality.
1
Office of the Federal Register, Federal Register: March 27, 2008 (Volume 73, Number 60), (Government Printing Office), 16436-
16514.
2June 2018 Air Quality Conformity Analysis
Figure 1: Maine’s Ozone Maintenance Areas
Table 1: Maine’s Ozone Maintenance Areas by County and Municipality
Area County Towns
Alfred, Arundel, Berwick, Biddeford, Buxton, Dayton, Eliot, Hollis, Kennebunk, Kennebunkport,
Portland York Kittery, Limington, Lyman, North Berwick, Ogunquit, Old Orchard Beach, Saco, Sanford, South
Berwick, Wells, and York
Brunswick, Cape Elizabeth, Casco, Cumberland, Falmouth, Freeport, Frye Island, Gorham, Gray,
Portland Cumberland Harpswell, Long Island, New Gloucester, North Yarmouth, Portland, Pownal, Raymond,
Scarborough, South Portland, Standish, Westbrook, Windham, and Yarmouth
Portland Androscoggin Durham
Portland Sagadahoc Arrowsic, Bath, Bowdoin, Bowdoinham, Georgetown, Perkins Twp, Phippsburg, Richmond,
Topsham, West Bath, and Woolwich.
Alna, Boothbay, Boothbay Harbor, Bremen, Bristol, Damariscotta, Dresden, Edgecomb, Monhegan
Midcoast Lincoln
Island Plt, Newcastle, Nobleboro, South Bristol, Southport, Waldoboro, Westport, and Wiscasset
3June 2018 Air Quality Conformity Analysis
Area County Towns
Camden, Cushing, Criehaven Twp, Friendship, Isle Au Haut, Matinicus Isle Plt, Muscle Ridge
Midcoast Knox Shoals Twp, North Haven, Owls Head, Rockland, Rockport, South Thomaston, St. George,
Thomaston, Vinalhaven, and Warren
Midcoast Waldo Islesboro
Bar Harbor, Blue Hill, Brooklin, Brooksville, Cranberry Isles, Deer Isle, Frenchboro, Gouldsboro,
Midcoast Hancock Hancock, Lamoine, Mt. Desert, Sedgwick, Sorrento, Southwest Harbor, Stonington, Sullivan,
Surry, Swans Island, Tremont, Trenton, and Winter Harbor
CONFORMITY REQUIREMENTS
Ground level ozone is produced by the reaction of several pollutants in the presence of sunlight.
Volatile organic compounds (VOC) and nitrogen oxides (NOx) are the primary reactants. Thus,
under the EPA conformity regulations, both VOC and NOx must be analyzed for regional
transportation conformity in ozone nonattainment and maintenance areas.
Regional Emissions Analysis
The federal transportation conformity rule2 specifies criteria and procedures for conformity
determinations for transportation plans, programs, and projects and their respective
amendments. The federal transportation conformity rule was first promulgated on November 24,
1993, by EPA, following the passage of amendments to the federal Clean Air Act in 1990. The
federal transportation conformity rule has been amended several times since its initial release to
reflect both EPA rule changes and court opinions.
The primary criteria for transportation conformity determinations include:
1. Conformity Tests. The plan or program must pass all the applicable conformity tests using
motor vehicle emissions budgets (MVEB) or interim emissions approved by EPA for
transportation conformity purposes (Sections 93.118 and 93.119).
2. Latest Planning Assumptions and Emission Models. The conformity determinations
must be based upon the most recent planning assumptions and latest emission estimation
models available (Sections 93.110 and 93.111).
3. Timely Implementation of TCMs. The plan or program must provide for the timely
implementation of any transportation control measures (TCM) specifically identified in the
State Implementation Plan (SIP) (Section 93.113). At this time no TCMs are specifically
identified in Maine’s SIP. Therefore, this condition is met and will not be addressed further.
4. Interagency Consultation. The conformity determinations must be made in accordance
with the consultation procedures outlined in sections 93.105 and 93.112 of the federal
conformity regulation and section 4 of Maine’s transportation conformity regulation3 .
2
United States Environmental Protection Agency. 40 CFR Part 93. Determining Conformity of Federal Actions to State or Federal
Implementation Plans. As amended on August 24, 2016.
3
Maine Department of Environmental Protection. 06-096 CMR Chapter 139. Transportation Conformity. Effective September 19,
2007.
4June 2018 Air Quality Conformity Analysis
APPLICABLE TRANSPORTATION PLANS AND PROGRAMS
As noted earlier, conformity determinations are required in nonattainment areas and
maintenance areas for the adoption, acceptance, approval, or support of transportation plans
and Transportation Improvement Programs (TIPs). The following section briefly describes the
statewide and metropolitan transportation planning and programming process that is required
for the allocation of federal funding sources. It should be noted that transportation planning is a
continuing, comprehensive and collaborative process designed to encourage and promote the
development of a multimodal transportation system to ensure safe and efficient movement of
people and goods while balancing environmental and community needs. The extent of the
transportation planning process is too large to be adequately addressed in this document.
Therefore, the scope of this particular section is limited to the specific transportation activities
requiring a conformity analysis. For more information on the transportation planning process
and links to Maine’s four MPOs, the agencies primarily responsible for transportation planning in
the metropolitan planning areas, can be found on MaineDOT’s website at
http://www.maine.gov/mdot/planning/.
Transportation Plans
A transportation plan is a document resulting from regional or statewide collaboration and
consensus on a region or state's transportation system, and serving as the defining vision for
the region's or state's transportation systems and services. Transportation plans, often called
long-range transportation plans, establish a framework of goals, objectives, policies, and
investment strategies for addressing anticipated challenges and future trends. Each MPO is
responsible for preparing a long-range transportation plan that encompasses their metropolitan
planning area. MaineDOT is responsible for preparing a statewide long-range transportation
plan. The statewide transportation plan must be consistent with the MPO transportation plans.
Connecting Maine is Maine’s integrated, long-range, multimodal transportation plan for the next
20 years. It establishes a framework of goals, objectives, and performance-based strategies for
addressing anticipated challenges and future trends. Connecting Maine also focuses on the link
between Maine’s transportation system and achieving a statewide vision of economic vitality,
environmental stewardship, and quality of life.
Transportation Improvement Programs
A TIP is a staged, multiyear, intermodal program of transportation projects which is consistent
with the metropolitan transportation plan or statewide transportation plan. The TIP includes a
prioritized listing of transportation projects to be carried out during the specified federal fiscal
year time frame. Each MPO is responsible for preparing a TIP for the applicable metropolitan
planning area. MaineDOT is responsible for preparing a STIP that includes all projects with
federal financial commitments for the specified federal fiscal year time frame. The STIP
includes all projects listed in the MPO’s TIPs.
The 2018-2021 STIP constitutes MaineDOT’s plan for obligating federal funds provided by
FHWA and FTA for federal fiscal years 2018-2021. The STIP also incorporates the TIPs, and
associated projects, from Maine’s four MPOs. Therefore, the conformity determination for 2018-
2021 STIP is applicable to the entire ozone maintenance area, including the KACTS and
PACTS MPO areas.
This report documents the air quality conformity determination for the following STIP and TIPs:
5June 2018 Air Quality Conformity Analysis
• 2018-2021 Statewide Transportation Improvement Program
• 2018-2021 PACTS Transportation Improvement Program
• 2018-2021 KACTS Transportation Improvement Program
INTERAGENCY CONSULTATION
Transportation conformity is a collaborative process among federal, state, and local agencies.
Every three months, MaineDOT convenes an interagency consultation committee meeting with
representatives from the following agencies:
• MaineDOT
• DEP
• Maine Turnpike Authority (MTA)
• PACTS
• KACTS
• Androscoggin Transportation Resource Center (ATRC)
• Greater Portland Council of Governments (GPCOG)
• Southern Maine Planning and Development Commission (SMPDC)
• FHWA
• FTA
• EPA
The consultation meetings have been held regularly since 1992.
The general purposes of the interagency consultation meetings are to:
• Provide a forum for discussion and decision making regarding all areas of transportation
conformity including, but not limited to, the development of the SIP, MVEBs, transportation
plans, STIPS/TIPs and associated conformity documents
• Evaluate events that will trigger new conformity determinations
• Determine latest planning assumptions and emission models
• Identify projects requiring a regional emissions or hot-spot analysis
• Develop a format for presenting the transportation conformity determination
• Establish a public participation process for the conformity determination
The conformity analysis is prepared by MaineDOT with assistance from DEP under the
guidance of the interagency consultation committee. The decisions made by the consultation
committee serve as the basis for the conformity analysis and the ultimate conformity
determination. The conformity analysis and the applicable transportation plans and programs
are made available for public review and comment.
6June 2018 Air Quality Conformity Analysis
The specific purposes of the interagency consultation meetings and the roles and
responsibilities for the agencies (DEP, MaineDOT, PACTS, and KACTS) responsible for
performing the conformity analysis are established in Section 4 of Maine’s transportation
conformity regulation4. As part of the SIP, the interagency consultation procedures contained in
Maine’s transportation conformity regulation are federally enforceable.
METHODOLOGY
The conformity process is complex, not in concept, but in detail. Simply stated, emission
estimates from highway-related mobile sources in the Portland and Midcoast areas are
developed using the Statewide Travel Demand Model to generate vehicle miles traveled (VMT)
and the EPA’s MOVES model to estimate VOC and NOx emissions by County. The conformity
process involves a number of key assumptions and socioeconomic inputs developed by
MaineDOT, DEP and the MPOs and reviewed by the interagency consultation committee.
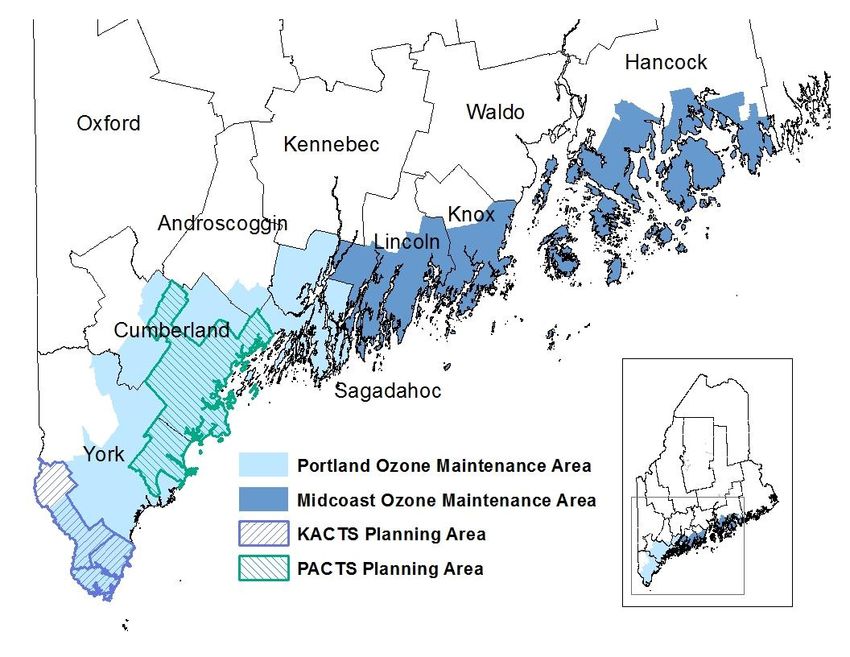
Figure 3, on page 9, summarizes the conformity process and highlights the key activities
including, interagency consultation, travel demand modeling, emissions modeling, public review,
and the final conformity determination. The analysis presented in this document was prepared
by MaineDOT with technical assistance from DEP.
Interagency Consultation
As illustrated in Figure 3, interagency consultation is the initial step in the transportation
conformity process. The interagency consultation committee serves both a technical and
regulatory reference and a decision-making body regarding key planning assumptions and other
factors. Specifically, the committee identifies regionally-significant projects, determines the
appropriate conformity tests and analysis years, evaluates projects for their VMT reduction (or
creation) potential, and makes other key decisions when necessary. The interagency
consultation committee is described in further detail in the previous section.
Travel Demand Modeling
The transportation conformity rule stipulates that the conformity determination must be based on
the most current planning assumptions and models. Thus, a critical element of the conformity
analysis is the traffic demand estimate. The statewide travel demand model relies on
population demographics, employment, and economic activity to forecast VMT. A REMI model
is used to establish base year and forecast year population and employment for nine regions in
Maine. The travel demand model, based on the TRIPS modeling software, provides a standard
forecast of statewide traffic growth that can be used to evaluate capital improvement projects,
test transportation alternatives, and forecast VMT. The statewide model is specifically
programmed to address recreational travel patterns that lead to peak traffic and congestion
during the summer tourist season. During the development of the model, MaineDOT reviewed
population increases in states that provide the largest number of visitors to Maine
(Massachusetts, Connecticut, Rhode Island, New York, and New Jersey) and projected growth
in service employment in order generate an estimate of recreational and seasonal trips.
4
Ibid.
7June 2018 Air Quality Conformity Analysis
Figure 2: Conformity Process Flow
VMT Estimates
Once the results of the travel demand modeling are finalized, the annual growth rates are then
applied to a base year5 of vehicle-miles traveled (VMT) to estimate traffic levels for the analysis
years. Any changes to VMT resulting from the construction of non-exempt or regionally
significant projects is then added to the total for each applicable county. The final output of the
travel demand modeling process is an estimation of average summer day VMT for each county
within Maine’s two ozone maintenance areas.
MOVES Modeling
The Motor Vehicle Emissions Simulator (MOVES) is a model developed by EPA that calculates
emissions of Hydrocarbons (HC), Carbon Monoxide (CO), Nitrogen Oxides (NOx), Carbon
Dioxide (CO2), Particulate Matter (PM), and toxics from cars, trucks, and motorcycles for
specified vehicle fleet, fuel, temperature, and speed conditions.
5
The base year VMT for this conformity determination is 2016. VMT estimates for all highways in the State were generated using
actual traffic counts taken during the 2015 calendar year.
8June 2018 Air Quality Conformity Analysis
As part of a cooperative agreement with MaineDOT, DEP performed the MOVES model
analysis and conformity calculations. EPA Region 1 provided guidance on the setup and use of
the MOVES emissions model and reviewed the MOVES input files that were used for
developing the emission inventories for the regional emissions analysis. The input files can be
made available upon request. Background information on the modelling approach utilized to
perform the MOVES model analysis can be found as Appendix A .
As noted above, MOVES generates emission inventories for certain pollutants based on a
number of input factors including environmental conditions, vehicle fleet mix, emission controls,
and fuel parameters. The following list provides a brief summary of several assumptions used
in the regional emissions analysis for ozone precursors (VOC and NOx):
Inspection and Maintenance (I/M)
The I/M program modeled in the conformity analysis includes statewide annual inspections of
On-Board Diagnostic (OBD) systems for all light-duty gas vehicles and trucks (1996 models and
newer). The model runs also include annual gas cap pressure testing for all light-duty gas
vehicles and trucks (1995 models and older) in Cumberland County only. In addition, Maine
inspects various vehicle components for safety and proper operation6, although such
inspections are not captured by the MOVES model in the conformity analysis.
Fuel Parameters
The fuel parameters specified in the emissions modeling include conventional gasoline (no
RFG, national default value) with a summertime (May 1st through September 15) Reid vapor
pressure (RVP) of 9.0 psi in Hancock and Waldo counties and reformulated gasoline with a
summertime RVP of 7.0 psi in York, Cumberland, Androscoggin, Sagadahoc, Lincoln and Knox
counties7.
Maine LEV (Low Emission Vehicles)
All new vehicles sold in the U.S. are subject to emission standards set by either the federal
government or the State of California. California is the only state with the authority to set its own
vehicle standards; other states may adopt either the California or the federal standards. Maine
has adopted California’s LEV I, LEV II, and LEV III standards8.
Build Scenario Emissions
MaineDOT and DEP work together to bring together estimates of VMT at various speed ranges
by the emission factors for those speeds as generated by EPA’s MOVES model. Output from
the travel demand modeling process (build scenario VMT) is multiplied by the outputs from
MOVES emissions modeling process (area specific emission factors) to generate build scenario
emissions for each maintenance area. The build scenario emissions are forecasts of highway-
related motor vehicle emissions based several socioeconomic inputs and a comprehensive
transportation network that includes all regionally significant transportation projects identified in
the STIP and LRTP.
6
MRSA 29-A §1751. Motor vehicle inspection. As amended 2001.
7
Maine Department of Environmental Protection. 06-096 CMR Chapter 119. Motor Vehicle Fuel Volatility Limit. As amended July
15, 2015.
8
Maine Department of Environmental Protection. 06-096 CMR Chapter 127. New Motor Vehicle Emission Standards. As
amended May 19, 2015.
9June 2018 Air Quality Conformity Analysis
Conformity Determination
The conformity determination for ozone is completed by comparing VOC and NOx build
scenario emission estimates for analysis years against the applicable conformity tests. The
build scenario emissions must be less than or equal to the required tests given in Table 2 for the
plan or TIP/STIP to pass conformity for ozone. The next section describes the required tests
(MVEBs and baseline emissions) in further detail. The final conformity determination and
associated air quality analysis is reviewed by the interagency consultation committee prior to
public release and federal approval.
Public Comment
Air quality conformity analysis for LRTPs require a 45-day comment period and conformity
analysis for TIPs and STIPs require a 30-day comment period. Hard copies of all documents are
made available at all MPOs, MaineDOT Regional Offices and federal depository libraries across
the state. Comments are accepted for at least 30 days after notification for the TIP/STIP
conformity analysis and up to 45 days after notification for the LRP conformity analysis. The
conformity analysis is also available on the web at …
CONFORMITY TESTS
The DEP is responsible for the development of the entire SIP. The DEP identifies how pollution
from all sources will be reduced sufficiently to meet the federal air quality standards in the
Portland and Midcoast areas. As part of this process, MVEBs are developed by DEP and
approved by EPA. The MVEBs are the total allowable emissions from all highway-mobile
sources within an area for a certain date. Maine currently has MVEBs for VOC and NOx in
each ozone maintenance area. The DEP consults with MaineDOT and the interagency
consultation committee during the development of the SIP and MVEBs.
EPA’s conformity rule requires that emissions in the “Build” scenario must be less than or equal
to the MVEBs for the last year of the maintenance plan. The last year of Maine’s maintenance
plan for the Portland and Midcoast areas was 2016. The 2016 MVEBs are listed below. For all
analysis years, emissions must be less than or equal to the MVEBs established for the most
recent prior year. For example: Portland area build emissions in 2025 must be equal to or less
than the 2016 MEVBs. Midcoast area build emissions in 2025 must be equal to or less than the
2016 MEVBs. The applicable conformity tests are shown in Table 2.
Table 2: 8-Hour Ozone Conformity Tests
Emissions Budget
Area Required Tests
VOC NOx
kg/day tons/day kg/day tons/day
Build Emissions < or = 2016 MVEBs 15,112.79 16.659 29,789.22 32.837
Portland
Build Emissions < or = 2016 Baseline Emissions 3,413.74 3.763 5,665.37 6.245
Midcoast
10June 2018 Air Quality Conformity Analysis
In order for the plan or program to conform to the SIP, the analysis must pass the applicable
tests for each analysis year. For the Midcoast area, the analysis years for this conformity
analysis are, 2025, 2035 and 2040. The analysis years for the Portland area are 2025, 2035
and 2040.
ANALYSIS RESULTS
The following table list all regionally significant transportation projects in the Portland and
Midcoast areas. The VMT changes associated with these projects are captured in the overall
VMT estimates for the maintenance areas in Appendix A. The resulting increase or decrease in
emissions from all regionally significant projects in the 2018-2021 STIP and the 2018-2021
PACTS and KACTS TIPs is, therefore, reflected in the conformity tests in Tables 4 and 5.
Table 3: Non-Exempt Regionally Significant Projects
WIN County Towns Scope Description Work Plan Description
Pave, stripe, and sign a new Park and
NEW
022176.00 Lincoln Boothbay Ride facility located at the Boothbay Fire
CONSTRUCTION
Station.
ROUNDABOUT Located at the intersection of Route 25,
020210.00 Cumberland Standish
CONSTRUCTION Manchester Road and Saco Road.
"Rotary" area intersections of Harnois
INTERSECTION Street/Main Street/Cumberland Street;
018637.00 Cumberland Westbrook
IMPROVEMENTS Main Street/Warren Avenue; and Main
Street/Forest Street. PACTS Sponsored.
Beginning at Bedford Street and
ROUNDABOUT
018624.00 Cumberland Portland extending west 0.09 of a mile. PACTS
CONSTRUCTION
Sponsored.
Located at the intersection of Route 1
020899.00 York York TRAFFIC SIGNALS and New Connector Road. KACTS
Sponsored.
INTERSECTION Located at the intersection of Route 236
019429.00 York Eliot
IMPROVEMENTS and Depot Road.
Danforth Street Crossing Bridge (#3525)
018419.00 Cumberland Portland BRIDGE REMOVAL over Danforth Street. Located 0.02 of a
mile south of Route 1A.
Repare bridge deck and improve for
BRIDGE DECK
019270.00 York Kittery Hard Shoulder Running during peak
REHABILATION
congestion conditions.
South NEW Widen the turnpike to 6 lanes from Exit
n/a Cumberland
Portland CONSTRUCTION 44 to Exit 52
11June 2018 Air Quality Conformity Analysis
CONFORMITY DETERMINATION
A regional emissions analysis for VOC and NOx was conducted for both the Portland and
Midcoast 8-hour Ozone Maintenance Areas. The analysis was conducted using the latest
planning assumptions and emission models under the guidance of the interagency consultation
committee. The results of the analysis in Tables 5 and 6 demonstrate that VOC and NOx
emissions for the Portland and Midcoast areas for each of the “build” scenarios are less than the
applicable MVEBs.
Table 4: Portland Area Conformity Tests
Portland Area Conformity Tests (tons per summer day)
2025 2035 2040
Test VOC NOx VOC NOx VOC NOx
Build 6.566 11.325 4.152 7.021 3.779 6.549
Budget 16.659 32.837 16.659 32.837 16.659 32.837
Result PASS PASS PASS PASS PASS PASS
Table 5: Midcoast Area Conformity Tests
Midcoast Area Conformity Tests (tons per summer day)
2025 2035 2040
Test VOC NOx VOC NOx VOC NOx
Build 1.982 2.603 1.260 1.407 1.154 1.256
Budget 3.763 6.245 3.763 6.245 3.763 6.245
Result PASS PASS PASS PASS PASS PASS
Conclusion
The conformity analysis demonstrates that all the required conformity tests were satisfied in the
Portland and Midcoast maintenance areas for each analysis year. The regional emissions
analysis demonstrates that the transportation-related emissions of VOC and NOx are less than
the established budgets for each analysis year under the build scenarios for both 8-hour Ozone
Maintenance Areas. Therefore, the 2018-2021 STIP and the 2018-2021 PACTS and KACTS
TIPs conform to the current SIP and satisfy the conformity requirements of the Clean Air Act
Amendments of 1990.
12APPENDIX A
MOVES2014 RUN SPEC INFORMATION
County Inventory – LEV Emissions Portion County Inventory- ZEV Emissions Portion
FILE NAME: FILE NAME:
YYYY_STCTY_TPSD_?psi_LEVZEVmmddyy.mrs YYYY_STCTY_TPSD_?psi_LEVZEVmmddyy.mrs
SCALE- Onroad/County/Inventory SCALE – Onroad/County/Inventory
TIME SPAN– Hour/YYYY/ Weekdays/July/00:00-23:59 TIME SPAN– Hour/YYYY/ Weekdays/July/00:00-23:59
GEOGRAPHIC BOUNDS- County GEOGRAPHIC BOUNDS- County
YYYY_STCTY_TPSD_?psi_LEVZEVmmddyy_in YYYY_STCTY_TPSD_?psi_LEVZEVmmddyy_in
VEHICLES/EQUIPMENT-All vehicles for these fuels VEHICLES/EQUIPMENT-All vehicles for these fuels
Compressed Natural Gas Compressed Natural Gas
Diesel Fuel Diesel Fuel
Electricity Electricity
Gasoline Gasoline
ROAD TYPE- ALL Road Types ROAD TYPE- ALL Road Types
POLLUTANTS AND PROCESSES- No Evap Permeation POLLUTANTS AND PROCESSES-EvapPermeation only
VOC- and all prerequisites VOC- and all prerequisites
NOX- and all prerequisites
MANAGE INPUT DATA SETS MANAGE INPUT DATA SETS
Apply /MOVES2014_early_NLEV/ Remove /MOVES2014_early_NLEV/
/moves2014_mylevs/ /moves2014_mylevs/
Clear the default AVFT fuel data in Input the M14_MEDEP_AVFT.xlsx table into
the CDM fuel tab section when applying these the AVFT fuel data CDM section when
databases. applying evap permeation processes.
OUTPUT OUTPUT
GENERAL OUTPUT GENERAL OUTPUT
YYYY_STCTY_TPSD_?psi_LEVZEVmmddyy_ou YYYY_STCTY_TPSD_?psi_LEVZEVmmddyy_ou
Units- Grams/Joules/Miles Units- Grams/Joules/Miles
Activity- Distance Traveled/Population Activity- Distance Traveled/Population
*OUTPUT EMISSIONS DETAIL- Defaults *OUTPUT EMISSIONS DETAIL
Always- Time 24-Hour Day Always- Time 24-Hour Day
Location County Location County
Pollutant Pollutant
On Road/Off Road On Road/Off Road On Road/Off Road On Road/Off Road
On and Off Road Road Type/Source Use Type On and Off Road Road Type/Source Use Type
Vehicle/Equipment Categories Emissions Process Vehicle/Equipment Categories Emissions Process
*These are the only boxes checked off in the OUTPUT profiles for either of these two inventory runs.
NOTE: The same run spec, input and output database are used for both runs. The LEV portion is conducted
first. The ZEV portion opens the same file, adjusts the run spec information, deletes Manage Input Data
Sets, and input the AVFT table allowing the outputs to append to the same output database.APPENDIX B
Gasoline Fuel Formulation RVP by County
2016 2025 2035 2040
Formulation Formulation Formulation Formulation
County CountyID RegionID Sulfur 30 ppm Sulfur 10 ppm Sulfur 10 ppm Sulfur 10 ppm RVP
Androscoggin 23001 178010000 3201 (E-10) 3459 (E-10) 3459 (E-10) 3462 (E-10)APPENDIX C
PORTLAND REGION VEHICLE POPULATIONS
SOURCE TYPE 2016 2025 2035 2040
11 27,064 28,329 29,807 30,576
21 244,281 256,063 269,840 277,011
31 272,434 285,451 300,665 308,582
32 33,499 35,149 37,081 38,087
41 182 192 202 208
42 314 329 347 356
43 1,397 1,463 1,540 1,580
51 529 554 584 599
52 16,296 17,078 17,993 18,469
53 1,695 1,779 1,876 1,927
54 1,647 1,723 1,812 1,859
61 1,105 1,158 1,221 1,254
62 1,268 1,330 1,404 1,442
Total 601,712 630,600 664,373 681,950
MIDCOAST REGION VEHICLE POPULATIONS
SOURCE TYPE 2016 2025 2035 2040
11 7,072 7,448 7,891 8,122
21 60,387 63,596 67,369 69,341
31 89,280 94,029 99,611 102,530
32 9,144 9,633 10,208 10,509
41 34 36 38 39
42 109 115 122 126
43 499 526 558 574
51 173 182 193 199
52 6,120 6,448 6,833 7,035
53 88 93 98 101
54 593 624 660 679
61 793 837 888 915
62 276 291 308 317
Total 174,567 183,857 194,778 200,486APPENDIX D
PORTLAND REGION VMT
HPMS TYPE 2016 2025 2035 2040
10 67,655,706 70,871,936 74,633,763 76,591,076
25 6,284,542,909 6,585,375,796 6,937,335,928 7,120,508,202
40 49,066,125 51,407,971 54,147,431 55,572,980
50 266,264,936 278,881,723 293,637,478 301,314,284
60 349,114,982 365,470,655 384,593,446 394,538,914
Total 7,016,644,657 7,352,008,081 7,744,348,047 7,948,525,455
MIDCOAST REGION VMT
HPMS TYPE 2016 2025 2035 2040
10 24,673,464 26,005,951 27,573,609 28,393,560
25 1,723,858,201 1,816,987,201 1,926,553,176 1,983,860,980
40 18,152,226 19,132,790 20,286,428 20,889,835
50 92,848,502 97,865,416 103,767,942 106,855,280
60 70,436,383 74,239,265 78,713,288 81,053,378
Total 1,929,968,776 2,034,230,622 2,156,894,443 2,221,053,032APPENDIX E
MOVES MODELING INPUTS FOR TRANSPORTATION CONFORMITY ANALYSIS
Grow Build Requires adjustments for each
out for inventory year
County Data 2011 2014 each MOVES
Manager Tabs MOVES2014 INPUT TABLES MDOT MET NEI year Defaults 2016 2025 2035 2040
Age
Distribution sourcetypeagedistribution x Y Y Y Y
Average
Speed
Distribution avgspeeddistribution x N N N N
fuelsupply x Y Y Y Y
fuelformulation x Y Y Y Y
Fuel
fuelusagefraction x Y Y Y Y
AVFT SEE LEV and ZEV footnotes below - - - - - - - - -
Meteorology
Data zonemonthhour x N N N N
Ramp
Fraction roadType x N N N N
Road Type
Distribution roadtypedistribution x N N N N
Source Type
Population sourcetypeyear x Y Y Y Y
startsperday x - - - -
startshourfraction x - - - -
startssourcetypefraction x - - - -
Starts
startsmonthadjust x - - - -
importstartsopmodedistribution x - - - -
starts x - - - -
Hpmsvtypeyear x Y Y Y Y
Vehicle Type monthvmtfraction x N N N N
VMT dayvmtfraction x N N N N
hourvmtfraction x N N N N
hotellingactivitydistribution x - - - -
Hotelling
hotellinghours x - - - -
I/M Programs imcoverage x N N N N
Retrofit Data onroadretrofit x - - - -
Run #1 Apply
LEV in MIDS MOVES2014earlyNLEV/moves2014_mylevs x N N N N
Run #2 Apply
ZEV AVFT in
CDM M14_MEDEP_AVFT.xlsx x N N N N
Two runs are required to capture LEV and ZEV emissions reductions benefits.
1. LEV -select VOC, NOX pollutants for all processes except evaporative permeation emissions.
Clear out the default AVFT table in the County Data Manager
fuel tab,
Import the MOVES2014_early_NLEV and moves2014_mylevs databases using Manage Input Data sets in the GUI.
2. ZEV- select VOC pollutants for evaporative permeation
emissions only.
Input M14_MEDEP_AVFT.xlsx for the AVFT inputs in the County Data Manager fuel
tab.
Delete the MOVES2014_early_NLEV and moves2014_mylevs databases from the Manage Input Data sets in the GUI.You can also read