Create Shareholder Value - Moving forward - Air Products
←
→
Page content transcription
If your browser does not render page correctly, please read the page content below
Moving forward

Create Shareholder Value
Moving forward

Forward-looking statements
This presentation contains “forward-looking statements” within the safe harbor provisions of the Private
Securities Litigation Reform Act of 1995, including statements about earnings guidance, business outlook
and investment opportunities. These forward-looking statements are based on management’s
expectations and assumptions as of the date of this presentation and are not guarantees of future
performance. While forward-looking statements are made in good faith and based on assumptions,
expectations and projections that management believes are reasonable based on currently available
information, actual performance and financial results may differ materially from projections and
estimates expressed in the forward-looking statements because of many factors, including, those
disclosed in our earnings release for the first quarter of fiscal 2021 as well as in our filings with the
Securities and Exchange Commission. Except as required by law, the Company disclaims any obligation
or undertaking to update or revise any forward-looking statements contained herein to reflect any
change in the assumptions, beliefs, or expectations or any change in events, conditions, or circumstances
upon which any such forward-looking statements are based.

Non-GAAP Financial Measures
This presentation and the discussion on the accompanying conference call contain certain financial
measures that are not prepared in accordance with U.S. generally accepted accounting principles
(“GAAP”). We have posted to our website, in the relevant Earnings Release section, reconciliations of
these non-GAAP financial measures to the most directly comparable financial measures prepared in
accordance with GAAP. The non-GAAP financial measures supplement our GAAP disclosures and are not
meant to be considered in isolation or as a substitute for the most directly comparable measures
prepared in accordance with GAAP. These measures may not be comparable to similarly titled measures
used by other companies.

2
Air Products At A Glance
Moving forward

 Air Products Today

      $8.9               19,000+               50
billion in FY20 sales      employees         countries

     ~$60B                    80            170,000+
    market cap          years in business    customers

      1800                  750+              30+
miles of industrial        production        industries
   gas pipeline             facilities         served

4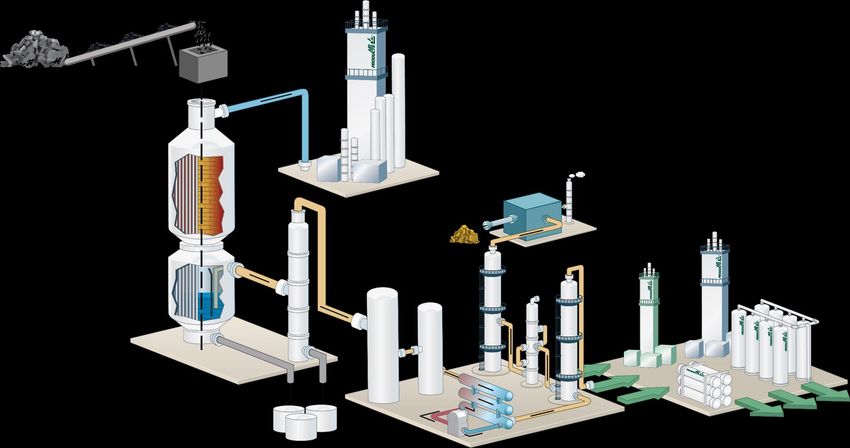
Moving forward

Air Products is…
    …a leader in the global industrial gas industry with:
    • Established leading positions in diverse end markets, including energy,
      chemicals, metals, manufacturing and electronics
    • Growth opportunities driven by Energy, Environmental and Emerging
      markets
    • Complementary equipment businesses
    • A multi-billion project backlog with
      long-term contracts that generate
      consistent and predictable cash flows
    • Leading positions in key growth regions
      including profitable joint ventures
    • A prudent capital structure with a strong
      balance sheet supporting long-term
      profitable growth
    • Traded on the NYSE (APD)

5
Moving forward

    APD Segments

    FY20 Sales: $8.9B
                                                                                                         IG- Corp &
    IG-Americas                                 IG-EMEA                     IG-Asia                     Global Other

%    41                                           22                        31                             42

    FY20 Adjusted EBITDA*: $3.6B
    IG-Americas                                         IG-EMEA                 IG-Asia

%    46                                                21                      37

                                                                                                IG- Corp:     -1%
                                                                                                Corp & Other: -3%

                        * Non-GAAP measure—see website for reconciliation to non-GAAP measure
    6
Moving forward

   APD Global Presence
   FY20 Sales = $8.9 billion

U.S./Canada
               41%
                                   Europe, ME
                                      & Africa
                                                        24%             19%      China

                                                                        12%      Asia
                                                                              Ex China

              Latin America   4%

   7                               Europe, ME & Africa includes India
Moving forward

APD supply modes
FY20 Sales = $8.9 billion

        49%                                        On-site/Pipeline
                                                   •15-20+ year contracts
             HyCO 22%             ASU 27%          •Limited volume risk
                                                   •No energy/raw materials risks

        33%                      Liquid Bulk
                                 •3-5 year contracts
                                 •Local supply chain

        12%        Packaged Gas
                   •Short-term contracts
                   •Local supply chain

        6%    Equipment & Services
              •Sale of equipment
              •Purchase order based

8
Moving forward

    End Markets We Serve
    FY20 Sales = $8.9 billion

                                                                                     Medical  Other
                                                                                           Food
    Energy/Chemicals                               Electronics   Metals   Manufacturing
%
    46Energy                                       17            14       12              5 42
                22                Chemicals   24

               19%
               SOE &
        3%     Other
        OFS

                       78%
                       Refinery

    9
Moving forward

Supply Mode by Region
FY20 Sales
               Packaged
                                                                                 On-Site
                  7%                                                                                 On-Site
                                      On-Site                                     HyCO
                                                                                                      33%
                                       56%                                        11%
                                                                Packaged
                            On-Site                               31%                      On-Site
                             HyCO                                                           ASU
      Liquid                 43%
               Americas                                                      EMEA           22%
       Bulk
       37%       $3.6B                                                       $1.9B

                  On-site                                                  Liquid Bulk
                   ASU                                                        36%
                   13%

                                                Packaged
                                                  6%

                                      Liquid
                                       Bulk
                                                  Asia
                                       33%       $2.7B

                                                      On-Site
                                                     HyCO/ASU
                                                       61%

10
APD Equity Affiliate Joint Ventures
Moving forward
FY20 $2.8B Sales (100% basis)
Mexico Italy
30%
23%
8%
India
39%
Others
$2.8B of Sales and $0.7B of Operating Income (100% basis)
Please refer to financial statements for equity affiliate accounting
11Moving forward
Adjusted EBITDA margin*
Up over 1400 basis points
44%
42.7%
41.9%
42%
40.1% 40.3% 40.4%
40%
40.3%
37.7% 39.2%
38%
36.3%
35.9% 35.7%
36% 35.2%
34.8% 34.9%
34.1% 34.3% 35.8%
33.9%
34% 33.2% 34.8%
32.9% 33.2%
32% 31.1%
29.6%
30%
28.7%
28% 28.8%
26.5%
26%
25.1%
24%
Q214
Q314
Q414
Q115
Q215
Q315
Q415
Q116
Q216
Q316
Q416
Q117
Q217
Q317
Q417
Q118
Q218
Q318
Q418
Q119
Q219
Q319
Q419
Q120
Q220
Q320
Q420
Q121
12
* Non-GAAP financial measure. See website for reconciliation.Moving forward
Air Products Adjusted EPS*
$9.00
$8.50
$8.00
$7.50
$7.00
$6.50 +2%
+10%
$6.00
+18%
$5.50
+12%
$5.00
+16%
$4.50 +10%
$4.00
FY14 FY15 FY16 FY17 FY18 FY19 FY20
13
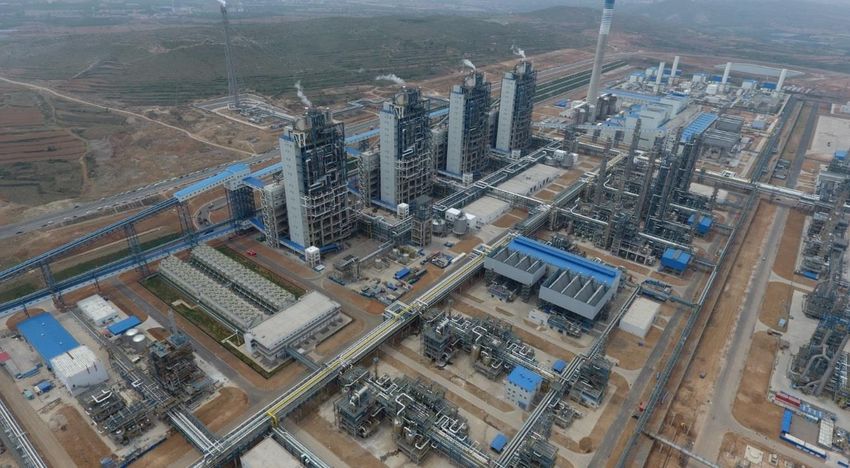
* Non-GAAP financial measure. See website for reconciliation.Dividend history
Moving forward
$6.00
$5.50
$5.00
Dividend/Share*
$4.50
$4.00
$3.50
$3.00
$2.50
$2.00
2014 2015 2016 2017 2018 2019 2020 2021
• $1.50 per quarter or 12% dividend increase announced Jan 2021
• >$1.3B/year of dividends to shareholders expected in 2021
• 39 consecutive years of dividend increases
14
* Based on annualized quarterly dividend declared in 1st quarterMoving forward
Innovation in LNG
Reshape markets and serve emerging needs
• Full range of process options: from peak-shavers to mega-trains
• Technology of choice for emerging floating LNG market
World’s leading provider of patented LNG technology and equipment
15Management Philosophy and Strategy
Moving forward

Our Goal

     Air Products will be the safest,
     most diverse and most profitable
     industrial gas company in the world,
     providing excellent service to our
     customers

17
Moving forward
Our Higher Purpose
Bringing people together to collaborate
and innovate solutions to the world’s
most significant energy and environmental
sustainability challenges
18Moving forward Diversity, Inclusion and Belonging By 2025, Air Products aims to achieve at least 28 percent female representation in the professional and managerial population globally, and at least 20 percent minority representation in that same population in the United States. 19
Moving forward

Creating shareholder value
Management philosophy

Shareholder Cash is king; cash flow drives long-term value.
Value
            What counts in the long term is the increase in
            per share value of our stock, not size or growth.

CEO           Capital allocation is the most important job of
Focus         the CEO.

Operating     Decentralized organization releases
Model         entrepreneurial energy and keeps both costs
              and politics (“bureaucracy”) down.

20
Moving forward
Five Point Plan: Moving Forward
Sustain Deploy Evolve Change Belong
the lead capital portfolio culture and Matter
Safest, most Strategically invest Grow onsite 4S Inclusion
diverse, and most significant available portion
profitable capacity
Best-in-class Win profitable Energy, Committed and Enjoyable work
performance growth projects environment and motivated environment
globally emerging markets
Productivity Positive attitudes and Proud to innovate
open minds and solve
challenges
21Moving forward
Our Competitive Advantage
The only sustainable element
of long-term competitive
advantage is the degree of
commitment and motivation
of the people in the enterprise
22Sustainability 23
Moving forward

Creating Long-term Value
Through sustainability
                 Our products enable customers to avoid           As we look forward, we see
                                                                  significant opportunities for
                          69 M MT CO2e
                                                                  gasification, carbon capture
      equivalent to emissions from 15 M cars, and 2.5 times our   technologies and hydrogen
                   direct and indirect CO2 emissions
                                                                  for mobility and energy
                                                                  transition. These are
Our products improve the environment, make our customers'
                                                                  opportunities to solve
processes better and fulfill societal needs
                                                                  today’s and tomorrow’s
       Gasification           Carbon Capture         Hydrogen
                                                                  energy and environmental
                                                                  challenges, and we are
                                                                  driven by an important
                                                                  ambition – to innovate
We are focused on improving our operations to manage              alongside our customers to
environmental, social and governance risks                        help make these
                                                                  opportunities a reality.

 24
Moving forward
Sustainability Accomplishments
69 million 53% 100% compliance
metric tons of CO2e avoided of revenue from with annual Code of Conduct
due to our products sustainable offerings certification
> $100 million > 1 million 2.5 times
in cumulative energy and metric tons of CO2e avoided the ratio of CO2e avoided by our
water costs avoided through efficiency improvements customers to our emissions
27 million 21% $7.6 million
worker hours without an LTI female share of in donations to
during Jazan ASU project workforce communities
Our business strategy and track record of execution are driving
us to set increasingly ambitious sustainability goals
25Moving forward
Sustainability Drives Our Business Today
Largest supplier
LNG Equipment Oxy-fuel Burners
of Hydrogen
Business Drivers
Energy Environment Emerging Markets
26Moving forward
Accelerating Growth Opportunities
Gasification Carbon Capture Hydrogen for Mobility
Business Drivers
Energy Environment Emerging Markets
27Moving forward
Air Products and Sustainability
Sustainability is a core value
Business strategy further
enabled by the world’s increasing
sustainability needs
Our commitments will only
continue to grow
Fundamental driver of our
higher purpose and broader
ESG initiatives
28Moving forward
The Opportunity
Continued application Partnership and Executing
of our ambition innovating alongside technology-driven
and ingenuity our customers megaprojects
29Moving forward
“Third by ’30” Carbon Intensity Goal
2015 114
(kg CO2e/MM BTU)
76
(kg CO2e/MM BTU)
2030
Goal
-33%
Deeply integrated in – and outcome More effective communication of
of – our business strategy strategy and ambitions with stakeholders
30Moving forward
Making “Third by ‘30” a Reality
Increased
Carbon
Carbon-free Low Carbon Operational Utilization of
Capture
Hydrogen Projects Excellence Renewable
Projects
Energy
Meeting customers on their journey,
maximizing resources and sustainability
31Moving forward
Carbon Capture
High-impact way to tackle
climate change, evolving
regulatory landscape
Significant opportunities from
gasifiers and hydrogen plants
CCS in action: Port Arthur
Since 2014, we have captured
over 6 million metric tons of CO2
32Moving forward Hydrogen for Mobility and Energy Decades of hydrogen production and distribution experience Developing global infrastructure to support key trucking and bus transit applications Providing safer, more reliable, and cost-effective solutions 33
Moving forward

NEOM
First commercial scale carbon-free Hydrogen project

Producing 650,000 kg/day of
carbon-free Hydrogen

Eliminates over three million tons of
CO2 emissions annually and smog-forming
emissions and other pollutants from the
equivalent of over 700,000 cars

Demonstrates Best Available
Technology for providing
carbon-free Hydrogen to the world

34
Moving forward

Other Initiatives Supporting
Air Products’ Higher Purpose

       Safety                  Talent & Diversity

     Communities                 Eco-efficiency

        Environment, Social and Governance

35
Moving forward
Moving Forward
“Third by ’30”
Sustainability in Our Base Business
Track Record of Setting & Meeting Ambitious Goals
Business Opportunities to Enhance the Sustainability of Our Customers
Game-changing Investments to Scale Clean Technologies
Joining the Global Climate Conversation
Ambition | Ingenuity | Partnership
36Gasification Strategy 37
Moving forward

   Gasification Process
   A way to make syngas
                                                                   Substitute
  Partial oxidation process to convert coal, high sulfur liquids   Natural Gas
  or natural gas into syngas to be used in the production of
  chemicals, diesel fuel, high-end olefins or power                   Power

Coal / High Sulfur                                                    Steam
Refinery Bottoms /
 Pet Coke / NG /
      Other                                                        Trans. Fuel
                                                  Syngas
                           Gasification
                                                 (CO + H2)
                                                                    Fertilizer
       Oxygen
                                                                    Chemicals
                           By-products
                                                                    Consumer
                                                                    Products

                                                                   Hydrogen for
                                                                     Refining

  38
Moving forward
Gasification
Traditional Supply = Oxygen
Coal Feedstock Air
Separation
O2 Unit
Gas Separation
Sulphur
Raw Syngas
Gasifier
Clean
Syngas
Slag / Black / New Supply = Syngas
Grey Water Syngas Clean-Up
39Moving forward
Benefits of Gasification
A versatile and mature technology
• Gasification technology has been in use since the 1800s
- Widely used to produce transportation fuel due to petroleum shortage in WWII
• Adaptable to various hydrocarbon feedstocks
- Coal, petcoke, oil residue, natural gas, and others
- Utilizes natural resources available
• Diverse applications and end products
- Syngas for power generation and chemicals
- H2 for refineries
- CO for chemicals
• Sustainability
- No smog-causing particulates
- Concentrated, capture-ready CO2 stream
- Sulfur removal allows the use of high sulfur coal
• Low incremental operating cost
- Economical in low oil price environment
40Moving forward
Drivers for Gasification
• Countries with massive resources of coal that want to
reduce dependence on imported oil for the production of
liquid fuel (CTL) or high-end chemicals (CTO)
- South Africa, China, India
• Countries with significant natural gas reserves that want to
create additional value by converting natural gas to liquid
fuel (CTL) or high-end chemicals (CTO)
- United States, Russia, Uzbekistan, Algeria
• Refineries all over the world that need to find a use for high
sulfur bottom-of-the-barrel liquids which can no longer
be used as fuel for ships (IMO 2020)
41Moving forward
Air Products Syngas Production
Air Products has the core competencies
required to be a supplier of syngas
Raw
Syngas
Natural Gas Steam Methane Reformer H2 for refinery
CO for chemicals
Gasifier – N.Gas Raw Syngas
Syngas
Cleanup
Syngas to:
Oil Resid Gasifier - Liquids
➢ Turbine for Power
➢ GTL for fuel
Coal/Petcoke Gasifier - Solids ➢ Chemicals
O2
Previous Core Competency
Air Separation Unit
Recent Core Competency
• We recently acquired gasification technologies to enhance our core
competency in gasification
42Moving forward
Shell & GE Gasification Technologies
Two leading technologies in the industry
• GE Gasification (formerly Texaco)
- Nearly 300 gasifiers operating and under construction
- Adaptable to wide range of feedstocks
- Coal = Slurry feed
• Shell Gasification
- Solid (Coal/Petcoke) - Air Products owns 100%
• Coal = Dry Feed
- Liquid (Oil Resid) - Air Products 50/50 with Shell
- Built 170+ liquid and 30+ coal gasifiers since 1950s
- Currently 120 gasifiers in operation (96 liquid, 24 coal)
43Moving forward
Executing our gasification strategy
Energy, environmental, emerging markets
Indonesia
100% APD
$2B
Debang 2024
JV
$0.25B
Jiutai 2023
100% APD
$0.65B
Jazan IG/ 2022
Gasif/Power JV
$11.5B
Lu’An 2021
JV
$1.5B
Large ASUs 2018
for China coal
gasification
44 Project capital represents 100%, not APD share
Project dates represent actual or expected onstreamMoving forward
Air Products & Lu’An Clean Energy Company
$1.5 billion coal-to-syngas production joint venture
• JV: Air Products Lu’An (Changzhi) Co., Ltd – Shanxi, China
- Ownership = 60% APD / 40% Lu’An
- Lu’An supplies coal, steam & power and receives syngas
- JV receives fixed monthly fee
- APD fully consolidates JV financials
- Onstream late FY18, >$0.25 EPS in FY19
JV Scope
Lu’An Scope Gasifiers ASU’s
Rectisol
Compressors CTL Unit
Acid
shift
reactors
Purification
45Moving forward
Jazan project
To Saudi
Refined products power grid
to market
Power
Hydrogen
Crude oil Utilities
400,000 BBL/day
refinery
3,800 MW
Vacuum resid Gasifier Syngas Power of power
(Air Products/Shell) Block
Oxygen
Nitrogen
75,000 TPD
ASU To Be Acquired
Built by Air Products by JV for
~$11.5B
46
Only major product flows shownMoving forward
Jazan project overview
Shareholders
(51% Air Products)
25% 46% 9% 20%
Refinery Vacuum
IGCC JV
Residual
Gasification
Power Generation
H2 / Power
Utilities
Water / Steam Air Separation
End Markets Lenders
(Diesel, Gasoline, Power)
47Moving forward
Jazan joint venture
• ASU, Gasification, Power, Utilities Assets = ~$11.5 billion
• Ownership (Air Products total ownership = 50.6%)
- Air Products 46%
- ACWA Power 25%
- Saudi Aramco 20%
- Air Products Qudra 9%
• 51% Air Products / 49% Qudra Energy
• Funding = 40% equity / 60% non-recourse project financing
- Air Products’ equity share ~$2.3B
• JV will own and operate the facility for 25 years and receive a fixed
monthly fee from Saudi Aramco
• Accounting - Air Products does not expect to consolidate JV results
48Moving forward
Juitai New Materials
• Customer: Juitai New Materials coal-to-MEG project
• Location: Hohhot, Inner Mongolia, China
• Scope: ASU, gasification and syngas cleanup
• Cost: $650M, 100% owned by Air Products
• Contract: 20 years
- Air Products supplies syngas to Juitai and receives coal and
utilities from Juitai
- Air Products responsible for capital and operating costs /
efficiency and reliability (consistent with our typical on-site
projects)
- Air Products to receive fixed monthly fee
• On-stream: 2022. Full Year EPS >$0.20
49Moving forward
Debang Group JV
• Customer/Partner: Debang Group coal-to-chemicals plant
- Relocation of existing Debang coal-to-chemicals
• Location: Xuwei National Petrochemical Park, Lianyungang City,
Jiangsu Province (East Coast of China)
• JV: 80% Air Products / 20% Debang
- JV owns/operates ASU, gasification and purification assets
• Merchant business: 100% Air Products
• Cost (100%): ~$250 million
• On-stream: 2023
• Contract: 20 years
- JV supplies syngas to Debang, receives coal & utilities from Debang
- JV (Air Products operating responsibility) responsible for capital and
operating costs, efficiency and reliability (consistent with our typical
on-site projects)
- JV receives fixed monthly processing fee
• Financial return: Consistent with previous capital deployment
commitments
50Moving forward
Indonesia Project – Bengalon
• Customers: PT Bakrie Capital Indonesia
(Bakrie Group) and PT Ithaca Resources
(AP Investment) – large Indonesia companies
• Location: Bengalon, East Kalimantan, Indonesia
• Scope:
- ASU, gasification, syngas clean-up, utilities,
methanol
- Produce ~2 million TPY of methanol from ~6 million TPY of coal
• Ownership: Expect 100% Air Products
• Capital: ~$2 billion, no project financing expected
• On-stream: 2024
• Contract: 20-year on-site tolling agreement
- APD receives coal from customers and supplies methanol to customers
- APD responsible for capital and operating costs, efficiency and reliability
consistent with our typical on-site projects
- APD receives fixed monthly processing fee in USD
- Customers responsible for future potential CO2 costs
• Financial return: Consistent with previous capital deployment commitments
51Large Projects 52
Moving forward

PBF hydrogen asset acquisition
• Consistent with strategy
  - Asset acquisition, capital
    deployment, onsite business,
    hydrogen, refining market,
    expanding strong customer
    relationship
• Agreement
  - APD to acquire 5 hydrogen plants (~300MMSCFD) for $580 million
  - APD to supply hydrogen under long-term onsite agreements to
    three, high quality PBF refineries in California and Delaware
• Financial returns better than capital deployment commitments
• Timing
  - Deal announced: March 30, 2020
  - FTC approval: April 10, 2020
  - Transaction closed: April 17, 2020

53
Moving forward
Gulf Coast Ammonia (GCA) Project
Texas City, Texas
SMR
Natural Gas Hydrogen
Ammonia
Power Nitrogen • ~1.3 million TPY
• Secure offtake
Ammonia Loop agreements
ASU
Air Products GCA
• Build, Own, Operate • Partners
- Starwood
• ~$0.5 billion invest - Mabanaft
• ~$0.6 billion invest
54 Only major product flows shownMoving forward
Carbon-free hydrogen
Produced and delivered with proven, world-class technology
Hydrogen Production at NEOM Hydrogen Refueling Station
Electrolyzer
Hydrogen
Dissociation H2
Compression
Power H2
Nitrogen
Ammonia
Wind/Solar Global
Distribution
Ammonia Carbon-
Ship/Truck
Production free H2
ASU
• Capital: ~$5 billion • Capital: ~$2 billion
• Ownership: 1/3 equal Air • Ownership: 100% Air
Products/NEOM/ACWA Power Products
~$3.7 billion Air Products total investment
Financial return: Consistent with previous capex commitments
55Q1FY21 Quarterly Earnings Slides
Moving forward

Dreams of the Future
 • To be the safest, most diverse, and most profitable
     industrial gas company in the world

 • To be the largest American chemical company as
     measured by market capitalization

 • To be the leader in providing solutions to the world’s
     energy and environmental challenges
      –   Gasification
      –   Carbon Capture
      –   Hydrogen for mobility

 • To serve out our Higher Purpose, bringing people
     together to deliver sustainable solutions for our
     customers and our world

57
Moving forward
Making Dreams a Reality
• Improved safety record
• Maintained highest margin in the industry
• Announced new sustainability goals, including carbon
intensity reduction and diversity goals
• Double-digit average annual adjusted EPS* increase since
2014. Adjusted EPS* up in 2020 despite COVID-19.
• Executing growth strategy
– World-scale LNG heat exchanger wins
– Gulf Coast Ammonia project and PBF hydrogen acquisition
– Indonesia coal-to-methanol project
– NEOM carbon-free hydrogen
58
* Non-GAAP financial measure. See website for reconciliation.Moving forward
Safety results
Q1FY21
FY14 Q1FY21
vs FY14
Employee Lost Time Injury Rate 0.24 0.04 83% better
Employee Recordable Injury Rate 0.58 0.30 48% better
59 FY14 includes MTQ1 Results
Moving forward
Fav/(Unfav) vs.
($ million) Q1FY21 Q1FY20 Q4FY20
Sales $2,375 5% 2%
- Volume (1%) (3%)
- Price 2% 1%
- Energy cost pass-through 1% 2%
- Currency 3% 2%
Adjusted EBITDA* $932 3% (1%)
- Adjusted EBITDA Margin* 39.2% (110bp) (120bp)
Adjusted Operating Income* $539 (4%) (4%)
- Adjusted Operating Margin* 22.7% (220bp) (140bp)
Adjusted Net Income* $472 (1%) (3%)
Adjusted EPS* ($/share) $2.12 (1%) (3%)
ROCE* 10.9% (250bp) (80bp)
• COVID-19 negatively impacted Sales ~4% and Adjusted EPS* ~$0.10 - $0.15
• Price positive in all three regions versus prior year and up sequentially
• Volume:
• Down vs prior year as COVID-19 and Lu’An more than offset new plants and acquisitions
• Down vs prior quarter due to seasonality, Lu’An and lower sale of equipment activities
• Adjusted EBITDA* up primarily on pricing
60
* Non-GAAP financial measure. See website for reconciliation.Moving forward
Q1 Adjusted EPS*
Q1FY20 Q1FY21 Change
GAAP cont ops EPS $2.14 $2.12
non-GAAP items 0.00 0.00
Adjusted EPS* $2.14 $2.12 ($0.02)
Volume (0.25)
Price (net of variable costs) 0.17
Other Cost (0.06)
($0.14)
Currency/FX $0.06
Equity Affiliate Income 0.04
Non-controlling Interest 0.04
Interest Expense (0.07)
Other (Non-Op. Inc/Exp, Tax rate) 0.05
$0.06
• Strong price more than offset by reduced volume
• COVID-19 impact on Adjusted EPS*~$0.10 - $0.15
* Non-GAAP financial measure. See website for reconciliation.
61 EPS is calculated independently for each component and may
not sum to total EPS due to rounding.Moving forward
Cash Flow Focus
($ million) Q1FY21 LTM
Adjusted EBITDA* $3,644
Interest, net* (87)
Cash Tax (387)
Maintenance Capex* (616)
Distributable Cash Flow* $2,554
$11.48/Share*
Dividends (1,144)
Investable Cash Flow* $1,410
• ~$11.50/share of Distributable Cash Flow*
• Paid over 40% of Distributable Cash Flow* as dividends
• ~$1.4B of Investable Cash Flow*
* Non-GAAP financial measure. See website for reconciliation.
62Capital Deployment Scorecard Moving forward
Substantial investment capacity remaining
Available Now (12/31/20) ($Billion)
Total Debt Capacity $ 10.9 Assuming 3xLTM Adj EBITDA*
Less: Net Debt* $ 1.8 Debt ($8.0B) minus cash# ($6.2B)
Additional Available Now $ 9.1
Estimated Available In Future
$ 2.5 LTM ICF* x 1.75 years
– Investable Cash Flow (ICF)*
Already Spent – FY18 through Q1FY21 $ 5.9 Growth CapEx* (including M&A)
Estimated FY18 - FY22 Capacity $ 17.5
Additional Commitments $ 10.8 Remaining to be spent
Spent + Commitments $ 16.6
% Spent 34%
% Spent + Commitments 95%
• Committed to manage debt balance to maintain current targeted A/A2 rating
• Total Commitment Value ~$12.7B; Remaining to be spent ~$10.8B
• Based on FY18 – FY22, figures as of 12/31/20
63 * Non-GAAP financial measure. See website for reconciliation.
# Cash includes cash and short-term investmentsMajor projects
* Multiple Phases
Plant Customer/Location Capacity Timing Market
ONSTREAM (last five quarters)
H2/CO Geismar, Louisiana 50MMH2+6.5MMCO Q2 FY20 Chem/Pipeline
Hydrogen PBF - California & Delaware 300MMSCFD Q3 FY20 Refinery
Syngas BPCL Ph 2, India Not disclosed Q1 FY21 Chemicals
PROJECT COMMITMENTS
ASU/H2 Samsung Giheung, Korea World Scale Q2 FY21 Electronics
ASU/Liquid Big River Steel, Arkansas >250 TPD + liquid Q2 FY21 Steel/Merchant
Liquid H2 LaPorte, TX ~30 tons per day Q4 FY21 Merchant
ASU/Liquid Eastman, Kingsport, Tennessee Not disclosed Q4 FY21 Gasifier/Merchant
ASU/Gasifier/ AP / ACWA / SA / APQ – Jazan, $11.5B total JV 2021* Gasif to Refinery
Power Saudi Arabia
ASU/Gasifier AP 100% - Jiutai – Hohhot, $0.65B investment 2022* Gasif to Chemicals
China
ASU/Gasifier AP (80%) / Debang – Lianyung ~$250 million total JV 2023 Gasif to Chemicals /
City, China Merchant
SMR/ASU/PL GCA – Texas City ~$500 million 2023 Ammonia
ASU/Gasifier/ Indonesia ~$2 billion 2024 Gasif to Methanol
MeOH
Carbon-free NEOM Saudi Arabia, Global ~$7 billion total JV 2025 Transportation
hydrogen market
64Industrial Gases - Asia
Moving forward
Fav/(Unfav) vs.
Q1FY21 Q1FY20 Q4FY20
Sales $718 4% 1%
- Volume (4%) (3%)
- Price 1% -%
- Energy cost pass-through 1% -%
- Currency 6% 4%
Adjusted EBITDA* $343 (1%) 4%
- Adjusted EBITDA Margin* 47.7% (240bp) 140bp
Operating Income $215 (6%) 2%
- Operating Margin 29.9% (310bp) 40bp
• 15th consecutive quarter of year-on-year price improvement
• Versus Prior Year;
• Volume lower due to reduced Lu’An contribution offsetting new assets, while merchant stable
• Adjusted EBITDA margin* lower primarily due to Lu’An
• Versus Prior Quarter;
• Volume lower primarily due to Lu’An
• Adjusted EBITDA* higher due to lower cost and favorable currency offsetting Lu’An
65
* Non-GAAP financial measure. See website for reconciliation.Industrial Gases - Americas
Moving forward
Fav/(Unfav) vs.
Q1FY21 Q1FY20 Q4FY20
Sales $933 -% 2%
- Volume (5%) (4%)
- Price 3% 1%
- Energy cost pass-through 2% 5%
- Currency -% -%
Adjusted EBITDA* $400 (2%) (3%)
- Adjusted EBITDA Margin* 42.9% (90bp) (210bp)
Operating Income $226 (12%) (5%)
- Operating Margin 24.2% (330bp) (200bp)
• Pricing strength continued - 10th consecutive quarter of price improvement
• Volume down primarily on COVID-19 impact
• Adjusted EBITDA* lower as strong price and PBF acquisition partially offset lower
volume and higher maintenance costs
• Sequentially, volume lower in part due to seasonality. Energy pass-through
negatively impacted Adjusted EBITDA margin* by 200 bp.
66
* Non-GAAP financial measure. See website for reconciliation.Industrial Gases - EMEA
Moving forward
Fav/(Unfav) vs.
Q1FY21 Q1FY20 Q4FY20
Sales $563 13% 11%
- Volume 5% 6%
- Price 3% 1%
- Energy cost pass-through (1%) 2%
- Currency 6% 2%
Adjusted EBITDA* $222 18% 11%
- Adjusted EBITDA Margin* 39.4% 170bp (20bp)
Operating Income $142 17% 15%
- Operating Margin 25.1% 90bp 70bp
• Sales and profits improved double digit vs. prior year and prior quarter
• 12th consecutive quarter of year over year price improvement
• Acquisitions and higher on-site volume overcame negative COVID-19 volume
impact - mostly in packaged gas
• Adjusted EBITDA* up driven primarily by price, currency and volume
• Sequential volume higher due to modest COVID recovery, acquisitions and
higher on-site volume
67
* Non-GAAP financial measure. See website for reconciliation.Moving forward
Industrial Gases - Global
Fav/(Unfav)
vs.
Q1FY21 Q1FY20
Sales $105 $12
Adjusted EBITDA* $0 ($7)
Operating Income ($5) ($8)
• Sales up on SOE project activity
• Profit down on business mix and higher product development spending
• Favorable contract settlement this year offset other project benefits
last year
68
* Non-GAAP financial measure. See website for reconciliation.Moving forward
Corporate
Fav/(Unfav)
vs.
Q1FY21 Q1FY20
Sales $57 $23
Adjusted EBITDA* ($32) $11
Operating Income ($38) $10
• LNG project activity drives business improvement
• Golden Pass and Mozambique on-going and Qatargas contributed
69
* Non-GAAP financial measure. See website for reconciliation.Moving forward Thank you tell me more
Air Products Adjusted EPS*                                                           Moving forward

           FY14    FY15     FY16       FY17                FY18         FY19        FY20      FY21
                                                     Q1     $1.79       $1.86        $2.14    $2.12

                                                     Q2     $1.71       $1.92        $2.04

                                                     Q3     $1.95       $2.17        $2.01

                                                     Q4     $2.00       $2.27        $2.19

           $4.42   $4.88    $5.64      $6.31               $7.45        $8.21       $8.38

$9.00
$8.00
$7.00
                                                                                     +2%
$6.00
                                                                       +10%
$5.00
                                                          +18%
$4.00
                                             +12%
$3.00                          +16%
                    +10%
$2.00
$1.00
 $-
            FY14     FY15       FY16          FY17         FY18          FY19         FY20

      71
                            *Non-GAAP financial measure. See website for reconciliation.
Capital Expenditure*
Moving forward
FY $MM
2020 $2,717
2019 $2,129
2018 $1,914
2017 $1,056
2016 $908
2015 $1,201
FY21 Quarter $MM
Q1 $684
Q2
Q3
Q4
* Non-GAAP financial measure. See website for reconciliation.
72 Capital expenditure is calculated independently for each quarter
and may not sum to full year amount due to rounding.You can also read