Capital One Energy Conference - December 7, 2020 - cloudfront.net

Page created by Pedro Daniels
 
CONTINUE READING
Capital One Energy Conference - December 7, 2020 - cloudfront.net
Capital One Energy Conference
December 7, 2020
Capital One Energy Conference - December 7, 2020 - cloudfront.net
IMPORTANT DISCLOSURES – EARNINGS DECK
FORWARD LOOKING STATEMENTS
This presentation contains forward-looking statements within the meaning of Section 27A of the Securities Act of 1933 and Section 21E of the Securities Exchange Act of 1934.
Forward-looking statements include all statements regarding Callon Petroleum Company’s (“Callon” or the “Company”) wells anticipated to be drilled and placed on production; future
levels of drilling activity and associated production and cash flow expectations; the Company’s production guidance and capital expenditure forecast; estimated reserve quantities and
the present value thereof; anticipated returns and financial position; and the implementation of the Company’s business plans and strategy, as well as statements including the words
“believe,” “expect,” “may,” “will,” “forecast,” “outlook,” “plans” and words of similar meaning. These statements reflect the Company’s current views with respect to future events and
financial performance based on management’s experience and perception of historical trends, current conditions, anticipated future developments and other factors believed to be
appropriate. No assurances can be given, however, as of this date, that these events will occur or that these projections will be achieved, and actual results could differ materially from
those projected as a result of certain factors. Any forward-looking statement speaks only as of the date of which such statement is made and the Company undertakes no obligation to
correct or update any forward-looking statement, whether as a result of new information, future events or otherwise, except as required by applicable law. Some of the factors which
could affect our future results and could cause results to differ materially from those expressed in our forward-looking statements include the volatility of oil, natural gas and natural gas
liquids (“NGLs”) prices or a prolonged period of low oil, natural gas or NGLs prices and the effects of actions by, or disputes among or between significant oil and natural gas producing
countries, general economic conditions, including the availability of credit and access to existing lines of credit, the effects of excess supply of oil and natural gas resulting from reduced
demand caused by the COVID-19 pandemic and the actions of certain oil and natural gas producing countries, our ability to drill and complete wells, operational, regulatory and
environment risks, cost and availability of equipment and labor, our ability to finance our activities, the ultimate timing, outcome and results of integrating the operations of Carrizo Oil
and Gas, Inc. (“Carrizo”) and Callon and the ability of the combined company to realize anticipated synergies and other benefits in the timeframe expected or at all, and other risks more
fully discussed in our filings with the Securities and Exchange Commission (the “SEC”), including our most recent Annual Report on Form 10-K and subsequent Quarterly Reports on
Form 10-Q, available on our website or the SEC’s website at www.sec.gov.

SUPPLEMENTAL NON-GAAP FINANCIAL MEASURES

This presentation includes non-GAAP measures, such as Adjusted EBITDA, Free Cash Flow, Adjusted Diluted WASO, Adjusted EPS, Adjusted Discretionary Cash Flow, Adjusted
G&A, Adjusted Cash G&A, Full Cash G&A Costs, Adjusted Income, and other measures identified as non-GAAP. Reconciliations are available in the Appendix. Non-GAAP measures
are not alternatives for, and should be read in conjunction with, the information contained in our financial statements prepared in accordance with GAAP, which are included in our SEC
filings.

Adjusted EBITDA is a supplemental non-GAAP financial measure that is used by management and external users of our financial statements, such as industry analysts,
investors, lenders and rating agencies. We define Adjusted EBITDA as net income (loss) before interest expense, income tax expense (benefit), depreciation, depletion and
amortization, (gains) losses on derivative instruments excluding net settled derivative instruments, non-cash stock-based compensation expense, merger and integration expense, loss
on extinguishment of debt, and other operating expenses. Management believes Adjusted EBITDA is useful because it allows it to more effectively evaluate our operating performance
and compare the results of our operations from period to period and against our peers without regard to our financing methods or capital structure. We exclude the items listed above
from net income (loss) in arriving at Adjusted EBITDA because these amounts can vary substantially from company to company within our industry depending upon accounting methods
and book values of assets, capital structures and the method by which the assets were acquired. Adjusted EBITDA should not be considered as an alternative to, or more meaningful
than, net income (loss) as determined in accordance with GAAP or as an indicator of our operating performance or liquidity. Certain items excluded from Adjusted EBITDA are
significant components in understanding and assessing a company’s financial performance, such as a company’s cost of capital and tax structure, as well as the historic costs of
depreciable assets, none of which are components of Adjusted EBITDA. Our presentation of Adjusted EBITDA should not be construed as an inference that our results will be
unaffected by unusual or non-recurring items.

Free Cash Flow (“FCF”) is a supplemental non-GAAP measure that is defined by the Company as Adjusted EBITDA less operational capital, capitalized interest, net interest expense
and capitalized G&A, excluding capitalized expense related to share-based awards. We believe free cash flow is a comparable metric against other companies in the industry and is
a widely accepted financial indicator of an oil and natural gas company’s ability to generate cash for the use of internally funding their capital development program and to service or
incur debt. Free cash flow is not a measure of a company’s financial performance under GAAP and should not be considered as an alternative to net cash provided by operating
activities, or as a measure of liquidity, or as an alternative to net income (loss).

                                                                                                                                                                                                  2
Capital One Energy Conference - December 7, 2020 - cloudfront.net
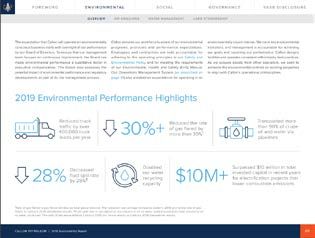
IMPORTANT DISCLOSURES – EARNINGS DECK (CONT)
SUPPLEMENTAL NON-GAAP FINANCIAL MEASURES (cont)

Adjusted Income available to common shareholders (“Adjusted Income”) and Adjusted Income per fully diluted common share are supplemental non-GAAP measures that
Callon believes are useful to investors because they provide readers with a meaningful measure of our profitability before recording certain items whose timing or amount cannot
be reasonably determined. These measures exclude the net of tax effects of such items and non-cash valuation adjustments, which are detailed in the reconciliation provided.

Adjusted diluted weighted average common shares outstanding (“Adjusted Diluted WASO”) is a non-GAAP financial measure which includes the effect of potentially dilutive
instruments that, under certain circumstances described below, are excluded from diluted weighted average common shares outstanding (“Diluted WASO”), the most directly
comparable GAAP financial measure. When a loss available to common shareholders exists, all potentially dilutive instruments are anti-dilutive to the loss available to common
shareholders per common share and therefore excluded from the computation of Diluted WASO. The effect of potentially dilutive instruments are included in the computation of
Adjusted Diluted WASO for purposes of computing Adjusted Income per fully diluted common share.

Adjusted Discretionary Cash Flow is a supplemental non-GAAP measure that Callon believes is a comparable metric against other companies in the industry and is a widely accepted
financial indicator of an oil and natural gas company’s ability to generate cash for the use of internally funding their capital development program and to service or incur debt. Adjusted
Discretionary Cash Flow is defined by Callon as net cash provided by operating activities before changes in working capital, merger and integration expenses, and payments to settle
asset retirement obligations and vested liability share-based awards. Callon has included this information because changes in operating assets and liabilities relate to the timing of cash
receipts and disbursements, which the Company may not control and the cash flow effect may not be reflected the period in which the operating activities occurred. Adjusted
Discretionary Cash Flow is not a measure of a company’s financial performance under GAAP and should not be considered as an alternative to net cash provided by operating activities
(as defined under GAAP), or as a measure of liquidity, or as an alternative to net income.

Adjusted general and administrative expense (“Adjusted G&A”) is a supplemental non-GAAP financial measure that excludes non-cash valuation adjustments
related to incentive compensation plans. Callon believes that the non-GAAP measure of Adjusted G&A is useful to investors because it provides readers with a meaningful measure of
our G&A expense and provides for greater comparability period-over-period. The table contained within this release details all adjustments to G&A on a GAAP basis to arrive
at Adjusted G&A.

Full Cash G&A Costs is a supplemental non-GAAP financial measure that Callon defines as Adjusted G&A – cash component plus capitalized G&A excluding capitalized
expense related to share-based awards. Callon believes that the non-GAAP measure of Full Cash G&A Costs is useful because it provides users with a meaningful measure of our total
cash G&A costs, whether expensed or capitalized, and provides for greater comparability on a period-over-period basis. See the reconciliation provided above for further details.

Callon has not reconciled its expectations as to Adjusted G&A, Full Cash G&A, Capitalized G&A, Adjusted EBITDA or Free Cash Flow to their most directly comparable GAAP
measures. Such a reconciliation is not available without unreasonable effort due to the unavailability of reliable estimates for certain components of the respective reconciliations and
the inherent difficulty in making accurate forecasts and projections. As these items may vary greatly between periods, Callon is unable to address the probable significance of the
unavailable information, which could significantly affect its future financial results.

                                                                                                                                                                                              3
Capital One Energy Conference - December 7, 2020 - cloudfront.net
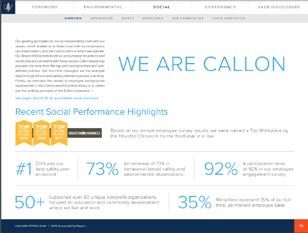
IMPROVED LIQUIDITY & ROCK-SOLID PERFORMANCE

  Free Cash Flow                         Improving Margins                                     Scaled                                Continued Strong                                  Solid Liquidity
    Generation                                                                               Development                             Well Performance                                     Position

  Recent ORRI sale and second lien notes                                                                          3rd Quarter Financial Snapshot (1)(2)
   placement solidify liquidity position

  Free cash flow generation of ~$100 MM                                                                            102.0 Mboe/d                                                   64.3 MBbl/d
   in 2Q/3Q20 timeframe                                                                                              Total Production                                                 Oil Production

  Continued strong performance from 1H20
   wells utilizing new subsurface learnings
                                                                                                                    $4.89/Boe                                                      $0.87/Boe
                                                                                                                     LOE                                                              Adjusted Cash G&A
   related to “life of field” development

  Incremental field operating cost improvement                                                                     $170.9 MM                                                      $0.64/Share
  Senior notes exchange further reduces net                                                                         Adjusted EBITDA                                                  Adjusted EPS
   debt outstanding by $172 MM and lowers
   annual cash interest by $6 MM                                                                                     $151.2 MM                                                       ~$80 MM
                                                                                                                       Adj. Discretionary                                             Free Cash Flow
                                                                                                                       Cash Flow
     1. Adjusted EBITDA, Adjusted EPS, Adjusted Discretionary Cash Flow, Full Cash G&A Costs, and Adjusted Cash G&A are non-GAAP measures. Please see the appendix for reconciliations to the nearest GAAP measures.
     2. Callon defines Free Cash Flow as adjusted EBITDA minus operational capital minus capitalized interest and capitalized G&A minus interest expense.
                                                                                                                                                                                                                       4
CLOSING OUT THE YEAR WITH CLEAR GOALS FOR 2021
A LONG LIST OF ACCOMPLISHMENTS ALREADY IN 2020

– Completed the integration of two organizations after closing in late December 2019
– Began prosecuting scaled, multi-zone development model across all three operating asset areas
– Moved quickly to reduce capital costs and conserve cash as commodity markets reacted to OPEC price war & COVID-19
– Reduced G&A costs through workforce rationalization and leadership (and Board) voluntary pay reductions
– Surpassed all synergy targets for cost reductions ahead of schedule (2Q20)
– Leveraged combined operational and technical knowledge base to enhance well productivity and lower development costs
– Pivoted to a socially distanced remote workforce
– Merged multiple IT systems, execute an accounting system conversion and consolidate reporting methodologies
– Completed and issued our peer leading, inaugural Sustainability report
– Executed a series of significant liquidity-enhancing transactions
– Generated nearly $100 million of FCF between 2Q and 3Q 2020 despite oil realizations averaging ~$35 per barrel
– Exchanged $389 million of unsecured Senior Notes

THE PATH FORWARD TO RESTORE SHAREHOLDER VALUE

– Advance monetization opportunities and strategic initiatives to further reduce absolute debt and improve credit metrics

– Further enhance our multi-zone, scale development program while leveraging a robust DUC backlog to drive capital efficiency

– Execute a more moderated capital program through reduced re-investment rates and balanced capital deployment for more consistent
  cash flow generation

– Proactively manage to lower flaring and GHG emissions through best practices and prudent investments

– Apply all organic FCF generation towards reduction of current debt balances

                                                                                                                                     5
FOCUS ON ESG DRIVES POSITIVE CHANGE
ENVIRONMENT (1)                                                                  SOCIAL (1)                                                                             GOVERNANCE (1)

Reduced truck traffic by                                                        TRIR Performance (2)                                                                                                    Board members are
over 400,000 truck loads                                                                                                                                                                                independent
                                                                                    1.11
per year
                                                                                                         0.6
                                                                                                                              Best safety year
                                                                                                                                on record                               Stringent insider trading,
                                   Reduction in rate
                                   of gas flared                                   2018                2019                                                             anti-hedging, and anti-
                                                                                                                                                                        pledging policies

   Doubled water                                                                                                                                                                                         Votes casted in favor of
   recycling capacity                                                                                                                                                                                    executive compensation
                                                                                                                          Top Workplace
                                                                                                                                                                                                         for the past five years
                                                                                                                          3 years in a row

                                                                                                                                                                      ESG policies, performance,
                                Decrease in fluid                                                          Nonprofit organizations                                    and disclosure is overseen by
                                spill rate                                                                 supported in local communities                             Nominating and Corporate
                                                                                                                                                                      Governance Committee

 Peer-leading
ESG Disclosure

        1. All metrics referenced are sourced from Callon’s 2019 Sustainability report, which is available on the company’s website, and details definitions and references for all figures provided.
        2. TRIR – Total Recordable Incident Rate is defined as the number of work-related injuries and illnesses per 200,000 workhours.
                                                                                                                                                                                                                              6
COST SAVINGS WELL BEYOND INITIAL EXPECTATIONS
CAPITAL EFFICIENCY IMPROVING                                  OPERATIONAL CAPITAL EVOLUTION

 Significant structural capital reductions                                    $1,200
     Initial FY20 full year operational capital of $975 MM                                              Nearly 50%
                                                                               $1,000
      now expected to be $500 - $510 MM                                                                   reduction
     Average well costs have dropped 23%, 38%, and                              $800                                          Additional 20%

                                                               $ in millions
      14% for the Delaware, Midland, and Eagle Ford,                                                                          reduction to FY21
      respectively                                                               $600                                         maintenance plan

 Development efficiency via scaled operations                                   $400
  primary driver of savings
                                                                                 $200
     Recent completions averaging 8 - 9 stages per day
      upon return from 3-month holiday
                                                                                   $0
     Recent wells at or below target DC&E costs                                         Initial FY20   Current FY20                  FY21 Outlook

WELL COST IMPROVEMENTS – 2019 (PRE-MERGER) VS 2H20 (POST-MERGER SCALED MODEL)

                                   Delaware                                    Midland                                   Eagle Ford
                          $1,200                     $900                                                  $575

                                                     $750                                                  $550
                          $1,000
    DC&E per lateral ft

                                                     $600                                                  $525
                           $800
                                                     $450                                                  $500
                           $600
                                                     $300                                                  $475

                           $400
                                                     $150                                                  $450

                           $200                       $-                                                   $425
                                   2019       2H20            2019                         2H20                        2019             2H20

                                                                                                                                                     7
OPTIMIZING ORGANIZATION FOR THE FUTURE
        REALIZED FULL CASH G&A SYNERGIES (1)                                                                                                                     HIGHLIGHTS

                                                                                                                                                                   Post-merger rationalization, combining strengths of each
                                                                                                                                                                    company
                                                                                                                     $3.50
                                                                               Estimated
                                                                                                                                                                   Reduced compensation for executives and Board of
                      $140                                                  ~$75MM in cash                                                                          Directors
                                                                                savings
                                                                                                                     $3.00                                         Consolidation of systems and processes
                      $120
                                                                                                                                                                   Benefits of scale for purchasing and elimination of
                                                                                                                                                                    redundant 3rd party contracts
                                                                                                                     $2.50
                      $100

                                                                                                                              Full Cash G&A per unit ($ / Boe)
                                                                                                                                                                 PEER-LEADING G&A EXPENSE PER BOE (2)
Full Cash G&A ($MM)

                                                                                                                     $2.00                                               $4.50
                      $80                                                                                                                                                $4.00
                                                                                                                                                                                                                                          Peer Average:
                                                                                                                                                                         $3.50                                                               $3.24
                                                                                                                     $1.50
                      $60                                                                                                                                                $3.00
                                                                                                                                                                                           Peer Average:
                                                                                                                                                                         $2.50

                                                                                                                                                                 $/Boe
                                                                                                                                                                                              $2.24

                                                                                                                                                                         $2.00
                                                                                                                     $1.00
                      $40
                                                                                                                                                                         $1.50

                                                                                                                                                                         $1.00

                      $20                                                                                            $0.50
                                                                                                                                                                         $0.50

                                                                                                                                                                         $0.00
                                                                                                                                                                                 Peer 15
                                                                                                                                                                                 Peer 10
                                                                                                                                                                                 Peer 22
                                                                                                                                                                                 Peer 12
                                                                                                                                                                                 Peer 20

                                                                                                                                                                                                           Peer 19

                                                                                                                                                                                                           Peer 14

                                                                                                                                                                                                           Peer 11
                                                                                                                                                                                                           Peer 21

                                                                                                                                                                                                           Peer 17
                                                                                                                                                                                  Peer 7
                                                                                                                                                                                   CPE
                                                                                                                                                                                  Peer 6

                                                                                                                                                                                                            Peer 2
                                                                                                                                                                                                            Peer 8
                                                                                                                                                                                                            Peer 1

                                                                                                                                                                                                            Peer 9

                                                                                                                                                                                                            Peer 5

                                                                                                                                                                                                            Peer 3
                                                                                                                                                                                                            Peer 4
                        $-                                                                                           $-
                                  2019 CPE +        2020 Synergy Additional YTD Revised 2020E
                                    CRZO              Guidance    Reductions      Cash G&A
                                                                                                                                                                                 Full Cost Accounting      Successful Efforts Accounting
                             1.     Figures depicted include capitalized cash G&A, but exclude all non-cash G&A.
                             2.     Second quarter 2020 reported data from company filings. BOE calculated as economic equivalent using 100% of oil production, 40% of NGL production, and a 1 boe : 15 mcf for gas on 3-stream conversion or 100%
                                    of oil production and a 1 boe : 10 mcf for gas on 2-stream conversion. Peers include APA, CDEV, CLR, CXO, EOG, FANG, LPI, MGY, MRO, MTDR, MUR, NOG, PDCE, PE, PXD, SM, SWN, WPX, and XEC.                             8
FIELD OPTIMIZATION IMPROVING LOE
IMPACT OF LEADING PRACTICES                                                          SUSTAINABLE REDUCTIONS DRIVE IMPROVED FCF (1)

 Eagle Ford                                                                                        $60

     43% reduction in workovers due to improved
      sand management during production

     Electrification of 20 operating facilities, reducing                                                                                 Equates to
      diesel generator reliance                                                                     $56                               ~$40 million in annual
                                                                                                                                         run rate savings
 Midland Basin
     Improved ESP run times
                                                                                                    $52
     Lower rate of beam pump failures and lower
      remediation costs

                                                                                     $ in mllions
 Delaware Basin
     Improved water management                                                                     $48

     Gas treatment optimization

     Compressor management program
                                                                                                    $44
 Continued enhancement of overall chemicals
  management program
     RFP and in-house management improving
      results and lowering overall costs
                                                                                                    $40
     Better chemicals management in turn reduces                                                                   Lease Operating Expense
      well failures and maintenance issues
                                                                                                          2019 PF        1Q20       2Q20       3Q20
 Actively managing field flaring performance to
  reduce emissions while capturing additional
  revenue

      1. 2019 column represents combined quarterly average for Callon and Carrizo.

                                                                                                                                                               9
MIDLAND WELLS SHOWING STRONG PERFORMANCE
KEY LEARNINGS AND TAKEAWAYS                                             COMPARABLE WOLFCAMP WELLS – 2019 VERSUS 2020 VINTAGE

 Reduced water loadings allow for                                                       200
  better flowback and lower impact
  on offset wells                                                                        180

 Tailored project spacing and
                                                                                         160
  proper frac geometry, based upon
  improved subsurface analysis,
                                                                                         140
  maximizing early life well

                                                                         Oil Cum (MBo)
  performance
                                                                                         120
 Continued strong performance
  from WC B co-development                                                               100
  expands economic resource
  opportunity                                                                             80

 Combined co-development of                                                              60
  Lower Spraberry, Wolfcamp A,
  and Wolfcamp B creating strong                                                          40
  blended returns, and allowing
  slower ramp and lower decline                                                           20
  profile of LSBY wells to support
  WC wells after peak                                                                      0
                                                                                               1             51          101          151           201             251
 Promising longer-term
                                                                                                                               Days on Production
  performance from Middle
  Spraberry with adequate geologic                                                                 DUNKIN UNIT A1 08AH                          DUNKIN UNIT A2 21H (WC B)
  separation to return and “harvest”                                                               HORTON UNIT 01AH                             WRIGHT UNIT 29 20 03AH
  in later field development                                                                       WRIGHT UNIT 29 20 A1 04AH                    2019 Offset Average (4 WC A wells)

      Note: 2019 vintage are a 4-well average of Sidewinder WCA 10,000’ wells that were put on production in 2019.

                                                                                                                                                                                     10
DELAWARE CONTINUES TO IMPRESS
AMPHITHEATER PROJECT (6 WELLS)                                                          CONSISTENT STRONG SOUTHERN DELAWARE PERFORMANCE
                                                                                                                  160
 Drilled and completed using updated
  “custom stacking and spacing”
  methodology                                                                                                     140

    330’ vertical separation with offsets
     between zones and ~900’ horizontal                                                                           120
     spacing                                                                                                                 Amphitheater six-well pad (3 Upper WC A, 3
                                                                                                                            Lower WC A) is on same trajectory as Rag Run
    Employing “slow back” pressure                                                                                           and Wally World WC A co-developments
                                                                                                                  100
     management philosophy; average choke

                                                                                          Cumulative Oil in MBo
     after three weeks of production only 27/64

 Average well cost just under $825 per                                                                            80
  lateral foot
 Project completion efficiency averaged                                                                           60
  ~1,800 lateral feet per day
 Cumulative oil production of ~20,000
                                                                                                                   40
  barrels (per well average) in 23 days

 Entire six-well pad was completed using                                                                          20
  more than 95% recycled produced water
  (~2.5 million barrels of water)
                                                                                                                    0
                                                                                                                        1     11      21   31     41     51     61    71    81   91     101     111

                                                                                                                                   AMPHITHEATER               WALLY WORLD             RAG RUN

      Note: 2019 vintage are a 4-well average of Sidewinder WCA 10,000’ wells that were put on production in 2019.

                                                                                                                                                                                                      11
METHODICAL EXECUTION OF FINANCIAL INITIATIVES (1)
                                                                         NON-OPERATED WORKING INTEREST SALE: $30 MM

             Asset Sales                                                 – September production of ~1,700 Boe/d (49% oil)
              $170 MM                                                    – Closed on November 2, 2020

               Credit                                                    2% ORRI SALE: $140 MM
               Facility
                                                                         – Equates to ~1,800 Boe/d of current production (63% oil)
             Refinancing
              $300 MM                                                    – Post-production costs (ad valorem, production taxes, GP&T, etc.) burdened to ORRI holder

                                                                         – Callon retains net revenue interest of ~74% across assets post transaction

                                                                         SECOND LIEN SECURED NOTES ISSUANCE: $300 MM
                Senior
                Notes                                                    – Notes mature in 2025 (callable in 2022)
              Exchanges                                                  – Total basket available of up to $700 million for debt exchanges or new-money issuance
                Up to
              ~$550 MM                                                   – Immediately reduced credit facility borrowings

                                                                          UNSECURED SENIOR NOTES EXCHANGES: $389 MM UP TO ~$550 MM (2)
                                                                          – Private exchange of $389 MM principal of Senior Notes
 Absolute Debt Reduction
                                                                          – Reduces net debt by $172 MM and lowers annual cash interest cost by $6 MM
    of up to ~$400 MM
                                                                          – Issuance of 1.76 MM warrants ($5.60 strike price) depending on participation
    Liquidity Position
                                                                          – Existing option for Kimmeridge to exchange Senior Notes for up to $100M of 2L Notes
  Increased to $616 MM
                                                                          – Additional 2L notes capacity provides future flexibility

   1. All proceed amounts provided are estimated gross figures.
   2. Top end of range based on $389 MM of participation in announced private exchange and assumes Kimmeridge exchange for $100 MM of 2025 Notes at an exchange ratio of 60, assuming 50% of 2023s and 50% of
      2024s.                                                                                                                                                                                                    12
FOUNDATION FOR FURTHER IMPROVEMENT
BOLSTERED LIQUIDITY AND CAPITALIZATION

                                                                                                                 2Q20                             3Q20 (1)                        PF 3Q20 (2)(3)                    Improvement

Cash                                                                                                               $8                                $11                                $11

Credit Facility                                                                                               1,450                                 1,025                              995                            $455 MM
Second Lien Notes                                                                                                   -                                300                                617

Senior Notes                                                                                                  1,900                                 1,900                            1,344                            $556 MM
                    Total Net Debt                                                                              $3,342                             $3,214                             $2,945

Total Liquidity (2)                                                                                            $258                                 $586                             $616                             $358 MM
Net Debt to LTM EBITDA                                                                                           3.4x                              3.8x                               3.5x                                  0.3x

LONG-DATED DEBT STRUCTURE

                                                                                                                                                        $600+ MM Revolver
                 $2.0
                                                                                                                                                            Availability

                 $1.5
 $ in Billions

                 $1.0                      No Maturities Before 2023

                 $0.5

                 $0.0
                                 2020                         2021                          2022                         2023                          2024                         2025                          2026

                   1. Callon’s credit facility was reaffirmed at $1.7 billion, and subsequently reduced to $1.6 billion as a result of the ORRI sale and Second Lien Notes issuance.
                   2. Pro forma 3Q20 assumes: (a) November 2, 2020 closing of non-operated sale, (b) $389 MM in announced private exchange, and (c) Kimmeridge exchange of $100 MM of Second Lien Notes at an exchange ratio of 60,
                      assuming 50% of 2023s and 50% of 2024s.                                                                                                                                                                         13
                   3. LTM EBITDA reflected in PF 3Q20 Net Debt to LTM EBITDA calculation includes EBITDA related to the ORRI transaction.
IMPROVED CASH FLOW PROTECTION FOR 2021
MEANINGFUL 2021 HEDGES ADDED TO ENHANCE CASH FLOW CERTAINTY
 More than 60% of estimated oil production is hedged using collars
                                                                                                                                                 4Q20 Oil Hedges
  and swaps
       ~70% collars with price participation up to ~$50 per Bbl
       ~30% swaps with wt. avg. floor price of ~$40 per Bbl
 Looking separately at WTI, Brent and MEH for pricing point diversity                                              0%            20%            40%          60%          80%           100%
  with market movements                                                                                                                 WTI NYMEX Collars    WTI NYMEX Swaps
 Just under 60% of anticipated natural gas production is hedged with
  50/50 collars and swaps for 2021                                                                                                               2021 Oil Hedges
       Collars allow for price participation
       Added Waha basis hedges at multi-year highs at a price of ($0.25)
        per MMBtu
                                                                                                                    0%            20%           40%           60%          80%           100%
 Continued staged approach for 2021 hedging program
                                                                                                                         WTI NYMEX Collars   WTI NYMEX Swaps    ICE Brent Swaps    MEH Swaps

SUMMARY HEDGE COVERAGE                                                                                                                          4Q20 Gas Hedges

                  Oil ($/Bbl)                                            Natural Gas ($/MMBtu)
$50                                               100%         $2.80                                        100%

                                                                                                                    0%            20%            40%           60%           80%            100%
$40                                               80%                                                       80%
                                                               $2.60                                                                      NYMEX Collars     NYMEX HH Swaps
$30                                               60%                                                       60%
                                                                                                                                                2021 Gas Hedges
$20                                               40%                                                       40%
                                                               $2.40
$10                                               20%                                                       20%

 $0                                               0%           $2.20                                        0%
           4Q20                  2021                                           4Q20              2021              0%            20%            40%           60%           80%            100%
      Oil Hedged            Avg oil floor price                      Gas Hedged               Avg gas floor price                        NYMEX Collars      NYMEX HH Swaps

         Note: Hedge contracts as of October 29, 2020. See appendix for additional details.

                                                                                                                                                                                       14
UPDATED CAPITAL PLANS AND OUTLOOK
                                                             Prior                                                         Updated FY20         2021 Outlook:
                                                         FY20 Guidance                                                       Guidance          “Maintenance Plan”

                                                                                                     Driven by D&C
  Operational Capital                                    $500 - $525 MM                        efficiencies & synergies   $500 - $510 MM        $375 - $400 MM

       Production                                        99 - 101 Mboe/d                        Improved productivity     100 - 101 Mboe/d      90 - 92 Mboe/d
         (% oil)                                                                                  offsets asset sales
                                                                    (64%)                                                       (63%)                (63%)

Lease Operating Expense                                                                         Driven by optimization
   (including workovers)
                                                         $205 - $215 MM                          and best practices       $200 - $205 MM

Gathering, Processing &                                                                        Enhanced flow assurance
    Transportation
                                                            $60 - $65 MM                         and pricing diversity
                                                                                                                           $73 - $78 MM

  Adjusted G&A, Cash                                        $30 - $35 MM                                                   $30 - $35 MM

Adjusted G&A, Non-Cash                                             $5 - $7                                                     $3 - $5

    Capitalized G&A
  (cash and non-cash)
                                                            $25 - $30 MM                                                   $30 - $33 MM

   Gross Drill Wells /
     Completions
                                                          87 - 89 / 80 - 82                                                87 - 89 / 80 - 82

      Note: Operational capital by asset area includes drilling, completions, and equipment.

                                                                                                                                                                 15
FCF YIELD IS WELL AHEAD OF PEERS
EQUITY VALUE DOES NOT REFLECT CALLON’S ABILITY TO GENERATE FREE CASH FLOW AND REDUCE LEVERAGE

                                                             2021 FCF Yield per Consensus Estimates
60%

40%

20%

 0%

-20%

                             Callon

-40%

-60%

-80%

       1. All estimates are from Bloomberg as of October 27, 2020
       2. Peers included in 2021 FCF Yield analysis: CDEV, CXO, EOG, ESTE, FANG, LPI, MGY, MTDR, OAS, PDCE, PE, PXD, QEP, SM, TALO, WPX, WTI, XEC
                                                                                                                                                    16
APPENDIX
OIL HEDGES (1)
                                                                                4Q20                  1Q21                  2Q21                   3Q21                  4Q21                 FY 2021
              NYMEX WTI (Bbls, $/Bbl)
              Swaps
                Total Volumes                                                    2,496,880                     -                273,000               552,000               552,000             1,377,000
                Total Daily Volumes                                                 27,140                     -                  3,000                 6,000                 6,000                 3,773
                  Avg. Swap                                                         $42.10                     -                 $41.62                $42.10                $42.10                $42.00
              Collars
                  Total Volumes                                                  1,501,440             2,453,975             2,366,525              2,312,325             2,290,450             9,423,275
                  Total Daily Volumes                                               16,320                27,266                26,006                 25,134                24,896                25,817
                  Avg. Short Call Price                                             $45.00                $46.58                $46.65                 $46.95                $46.97                $46.78
                  Avg. Long Put Price                                               $35.00                $38.99                $39.18                 $39.33                $39.37                $39.21
              Total WTI Volume Hedged (Bbls)                                     3,998,320             2,453,975             2,639,525              2,864,325             2,842,450            10,800,275
                Average WTI Ceiling Price ($/Bbl)                                   $43.19                $46.58                $46.13                 $46.01                $46.02                $46.17
                Average WTI Floor Price ($/Bbl)                                     $39.43                $38.99                $39.43                 $39.86                $39.90                $39.57

              ICE BRENT (Bbls, $/Bbl)
              Swaps
                Total Volumes                                                            -               283,700                221,300               177,900               165,400                848,300
                Total Daily Volumes                                                      -                 3,152                  2,432                 1,934                 1,798                  2,324
                  Avg. Swap                                                              -                $37.33                 $37.35                $37.38                $37.39                 $37.36
              Collars
                  Total Volumes                                                          -               180,000                182,000               184,000               184,000               730,000
                  Total Daily Volumes                                                    -                 2,000                  2,000                 2,000                 2,000                 2,000
                  Avg. Short Call Price                                                  -                $50.00                 $50.00                $50.00                $50.00                $50.00
                  Avg. Long Put Price                                                    -                $45.00                 $45.00                $45.00                $45.00                $45.00
              Total Brent Volume Hedged (Bbls)                                           -               463,700                403,300               361,900               349,400             1,578,300
                Average Brent Ceiling Price ($/Bbl)                                      -                $42.25                 $43.06                $43.80                $44.03                $43.21
                Average Brent Floor Price ($/Bbl)                                        -                $40.31                 $40.80                $41.25                $41.40                $40.90

              MAGELLAN EAST HOUSTON FIXED PRICE (Bbls, $/Bbl)
              Swaps
               Total Volumes                                                             -               354,625                276,625               222,375               206,750             1,060,375
               Total Daily Volumes                                                       -                 3,940                  3,040                 2,417                 2,247                 2,905
                 Avg. Swap Price                                                         -                $38.94                 $38.94                $38.94                $38.94                $38.94

              MAGELLAN EAST HOUSTON DIFFERENTIAL VS WTI-CUSHING (Bbls, $/Bbl)
              Swaps
               Total Volumes                          1,435,202             -                                                         -                     -                     -                      -
               Total Daily Volumes                       15,600             -                                                         -                     -                     -                      -
                 Avg. Swap Price                          $0.03             -                                                         -                     -                     -                      -

              MIDLAND-CUSHING DIFFERENTIAL (Bbls, $/Bbl)
              Swaps
               Total Volumes                                                     1,380,000               851,000                667,500               612,000               892,400             3,022,900
               Total Daily Volumes                                                  15,000                 9,456                  7,335                 6,652                 9,700                 8,282
                 Avg. Swap Price                                                    ($1.89)                $0.31                  $0.21                 $0.13                 $0.33                 $0.26

   1.   Callon hedge portfolio as of 10/29/2020. In addition to the above hedges, Callon holds short the following positions: 6,000 bpd 4Q20 $42.50-strike WTI puts, 5,000 bpd 4Q20 WTI $55/$67.50 call spreads, 13,220 bpd
        Cal21 WTI calls (avg. strike $63.62).
                                                                                                                                                                                                                              18
GAS AND NGL HEDGES (1)
                                                                                 4Q20                  1Q21                   2Q21                   3Q21                  4Q21                 FY 2021
              NYMEX HENRY HUB (MMBtu, $/MMBtu)
              Swaps
                Total Volumes                                                     1,633,000                      -             3,822,000              3,864,000             3,437,000             11,123,000
                Total Daily Volumes                                                  17,750                      -                42,000                 42,000                37,359                 30,474
                  Avg. Swap Price                                                     $2.05                      -                 $2.59                  $2.59                 $2.62                  $2.60
              Three-way Collars
                Total Volumes                                                     1,525,000              1,350,000                      -                     -                      -             1,350,000
                Total Daily Volumes                                                  16,576                 15,000                      -                     -                      -                 3,699
                  Avg. Short Call Price                                               $2.72                  $2.70                      -                     -                      -                 $2.70
                  Avg. Long Put Price                                                 $2.45                  $2.42                      -                     -                      -                 $2.42
                  Avg. Short Put Price                                                $2.00                  $2.00                      -                     -                      -                 $2.00
              Collars
                  Total Volumes                                                   1,525,000              4,050,000             1,820,000              1,840,000             1,840,000              9,550,000
                  Total Daily Volumes                                                16,576                 45,000                20,000                 20,000                20,000                 26,164
                  Avg. Short Call Price                                               $3.25                  $3.36                 $2.80                  $2.80                 $2.80                  $3.04
                  Avg. Long Put Price                                                 $2.67                  $2.71                 $2.50                  $2.50                 $2.50                  $2.59
              Total NYMEX Volume Hedged (MMBtu)                                   4,683,000              5,400,000             5,642,000              5,704,000             5,277,000             22,023,000
                Average NYMEX Ceiling Price ($/MMBtu)                                 $2.66                  $3.20                 $2.66                  $2.66                 $2.69                  $2.80
                Average NYMEX Floor Price ($/MMBtu)                                   $2.38                  $2.63                 $2.56                  $2.56                 $2.58                  $2.59

              WAHA DIFFERENTIAL (MMBtu, $/MMBtu)
              Swaps
               Total Volumes                                                      4,421,000              4,050,000             4,095,000              4,140,000             4,140,000             16,425,000
               Total Daily Volumes                                                   48,054                 45,000                45,000                 45,000                45,000                 45,000
                 Avg. Swap Price                                                     ($0.91)                ($0.42)               ($0.42)                ($0.42)               ($0.42)                ($0.42)

              MT. BELVIEU PURITY ETHANE (Bbls/$/Bbl)
              Swaps
               Total Volumes                                                              -                450,000                455,000               460,000                460,000             1,825,000
               Total Daily Volumes                                                        -                  5,000                  5,000                 5,000                  5,000                 5,000
                 Avg. Swap Price                                                          -                  $7.62                  $7.62                 $7.62                  $7.62                 $7.62

   1.   Callon hedge portfolio as of 10/29/2020. In addition to the above hedge positions, Callon holds short the following positions: 33,000 mmbtu/d Nov20-Dec20 $3.50-strike calls, 20,000 mmbtu/d Cal21 calls (avg. strike
        $3.09).
                                                                                                                                                                                                                                19
NON-GAAP ADJUSTED EBITDA RECONCILIATION (1)
($000s)                                                                                                                             3Q 2020
Net loss                                                                                                                          ($680,384)
 Loss on derivatives contracts                                                                                                       27,038
 Loss on commodity derivative settlements, net                                                                                       (5,540)
 Non-cash stock-based compensation benefit                                                                                              (94)
 Impairment of evaluated oil and gas properties                                                                                     684,956
 Merger and integration expense                                                                                                       2,465
  Other expense                                                                                                                       3,567
 Income tax expense                                                                                                                       --
 Interest expense                                                                                                                    24,683
 Depreciation, depletion, and amortization                                                                                          114,201

Adjusted EBITDA                                                                                                                    $170,892

           1. See “Important Disclosures” slide for additional information related to Supplemental Non-GAAP Financial Measures.

                                                                                                                                        20
NON-GAAP ADJUSTED INCOME PER SHARE (1)
($000s)                                                                                                                            3Q 2020
Loss available to common shareholders                                                                                            ($680,384)
  Loss on derivatives contracts                                                                                                     27,038
  Loss on commodity derivative settlements, net                                                                                     (5,540)
  Non-cash stock-based compensation benefit                                                                                            (94)
  Impairment of evaluated oil and gas properties                                                                                   684,956
  Merger and integration expense                                                                                                     2,465
  Other expense                                                                                                                      3,567
  Tax effect on adjustments above                                                                                                 (149,602)
  Change in valuation allowance                                                                                                    143,152

Adjusted Income                                                                                                                    $25,558

Loss available to common shareholders per share                                                                                    ($17.12)

Adjusted Income per share                                                                                                            $0.64

Basic Weighted Average Shares Outstanding                                                                                           39,746
Diluted Weighted Average Shares Outstanding                                                                                         39,746
Effective of potentially dilutive instruments                                                                                           35
Adjusted Diluted Weighted Average Shares Outstanding                                                                                39,781

          1. See “Important Disclosures” slide for additional information related to Supplemental Non-GAAP Financial Measures.

                                                                                                                                       21
NON-GAAP FREE CASH FLOW (1)
($000s)                                                                                                                          2Q 2020    3Q 2020
Net cash provided by operating activities                                                                                         $97,801   $135,701
 Changes in working capital and other                                                                                              40,078     14,473
 Change in accrued hedge settlement                                                                                              (14,480)    (5,993)
 Cash interest expense, net                                                                                                        21,944     24,246
 Merger and integration expense                                                                                                     8,067      2,465

Adjusted EBITDA                                                                                                                  $153,410   $170,892

Less: Operational capex                                                                                                           $85,087    $38,408
Less: Capitalized interest                                                                                                         20,924     20,675
Less: Interest expense, net                                                                                                        22,682     24,683
Less: Capitalized cash G&A                                                                                                          6,740      6,831
Free Cash Flow                                                                                                                    $17,977    $80,295

          1. See “Important Disclosures” slide for additional information related to Supplemental Non-GAAP Financial Measures.

                                                                                                                                                 22
NON-GAAP ADJUSTED DISCRETIONARY CASH FLOW (1)
($000s)                                                                                                                             3Q 2020
Net loss                                                                                                                          ($680,384)
Adjustments to reconcile net loss to cash provided by operating activities:
 Depreciation, depletion, and amortization                                                                                          114,201
 Impairment of evaluated oil and gas properties                                                                                     684,956
 Amortization of non-cash debt related items                                                                                            437
 Loss on derivatives contracts                                                                                                       27,038
 Cash received for commodity derivative settlements, net                                                                                453
 Non-cash stock-based compensation benefit                                                                                              (94)
 Merger and integration expense                                                                                                       2,465
  Other, net                                                                                                                          2,099

Adjusted discretionary cash flow                                                                                                   $151,171

 Changes in working capital                                                                                                         (12,990)
 Merger and integration expense                                                                                                      (2,465)
 Payments to settle vested liability share-based awards                                                                                 (15)
Net cash provided by operating activities                                                                                          $135,701

           1. See “Important Disclosures” slide for additional information related to Supplemental Non-GAAP Financial Measures.

                                                                                                                                        23
NON-GAAP FULL CASH G&A COSTS (1)
($000s)                                                                                                                            2Q20    3Q 2020
Total G&A expense                                                                                                                $10,024    $8,224
 Change in the fair value of liability share-based awards (non-cash)                                                             (1,720)     1,582
 Restricted stock share-based compensation (non-cash) and other non-recurring expenses                                           (1,509)    (1,674)
Adjusted G&A — cash component                                                                                                     $6,795    $8,132
 Capitalized cash G&A                                                                                                              6,740     6,831
Full Cash G&A Costs                                                                                                              $13,535   $14,963

Total Production (Mboe)                                                                                                            9,888     9,387
G&A Expense per Boe                                                                                                                $1.01     $0.88
Full Cash G&A per Boe                                                                                                              $1.37     $1.59
Adjusted Cash G&A per Boe                                                                                                          $0.69     $0.87

          1. See “Important Disclosures” slide for additional information related to Supplemental Non-GAAP Financial Measures.

                                                                                                                                                24
NON-GAAP NET DEBT RECONCILIATION (1)
                                                                                                                                  As of September 30, 2020
                                                                                                                                                (in millions)

Long-term debt                                                                                                                                     $3,225

Less: Cash and cash equivalents                                                                                                                         11

Net Debt                                                                                                                                           $3,214

           1. See “Important Disclosures” slide for additional information related to Supplemental Non-GAAP Financial Measures.

                                                                                                                                                        25
You can also read