Presentation Materials - 3rd FP (ended December 2018) Canadian Solar Infrastructure Fund, Inc.
←
→
Page content transcription
If your browser does not render page correctly, please read the page content below
3 rd FP (ended December 2018)
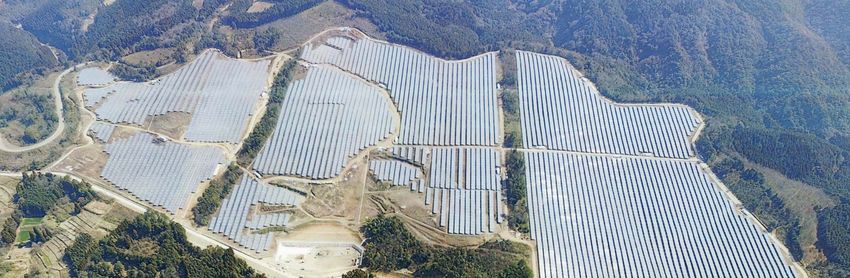
Presentation Materials S-13 CS Mashiki-machi Power Plant
Security code
Canadian Solar Infrastructure Fund, Inc.
S-17 CS Daisen-cho Power Plant (A)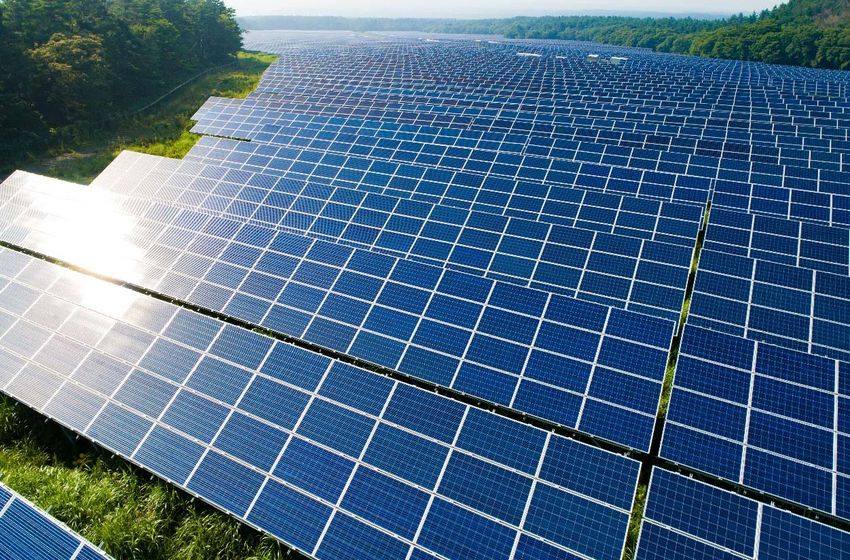
Table of contents

1. Financial Highlights ・・・・・・P.                    2    4. Management Policy・・・・・・・・P.                      19
  Financial Highlights of 3 rd FP ・・・・・・・・P.        3     4 th 5 th & 6 th FP Business Forecast ・・・・・・・P.    20
  Portfolio Performance ・・・・・・・・・・・・P.              4     External Growth Strategy(Sponsor Pipeline) ・・P.    21
                                                          METI Policy on “Unoperated” Solar Projects ・・・P.   22
2. Major Topics for 3 rd FP ・・・・・P.                  6    Characteristics of PV Plant Revenue ・・・・・・・P.      23
  Overview of Follow-on Offering ・・・・・・・P.           7
  Portfolio ・・・・・・・・・・・・・・・・・・P.                     8
                                                         5. Appendix ・・・・・・・・・・・・・P.                         24
  Asset List ・・・・・・・・・・・・・・・・・・P.                    9    Unit Price Performance ・・・・・・・・・・・・・P.             25
  Curtailment Rule ・・・・・・・・・・・・・・P.                 10    TSE Listed Infrastructure Fund Market ・・・・・P.      26
  Impact of Curtailment on 3 rd FP Performance P.   11    Japanese Renewable Energy Market ・・・・・・P.          27
                                                          Company History ・・・・・・・・・・・・・・・P.                  28
3. CSIFʼs Unique Features ・・・・P.                    12    Balance Sheet for 3 rd FP ・・・・・・・・・・・・P.           29
                                                          Statement of Income for 3 rd FP ・・・・・・・・P.         30
  Overview of Sponsor ・・・・・・・・・・・・P.                13
                                                          Status of Unitholders ・・・・・・・・・・・・・・P.             31
  Vertically-integrated Business Model ・・・・・P.      14
                                                          Overall Structure ・・・・・・・・・・・・・・・・P.               32
  Strong Financial Base・・・・・・・・・・・・ P.              15
                                                          Disclaimer ・・・・・・・・・・・・・・・・・・・P.                   33
  Leasing Structure ・・・・・・・・・・・・・・P.                16
  Distribution Policy (Payout Ratio) ・・・・・・P.       17
  Green Bond ・・・・・・・・・・・・・・・・P.                     18

                                                                                                                  1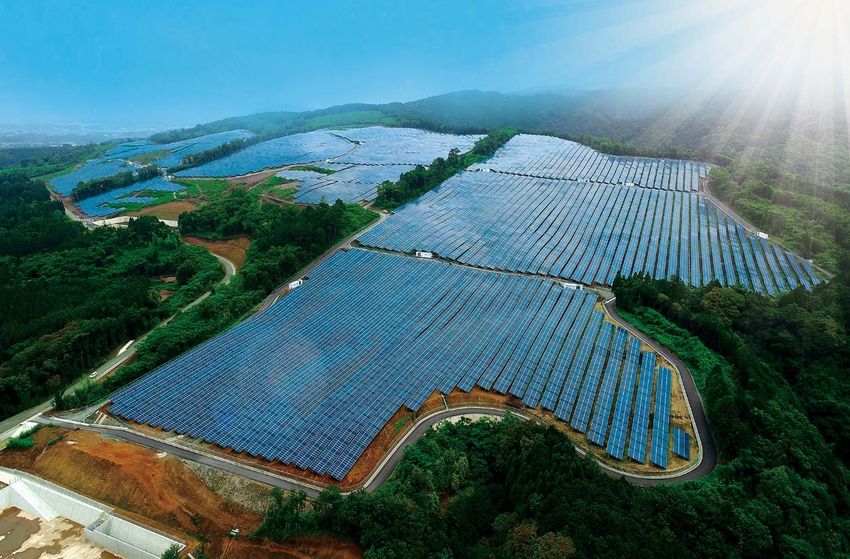
Financial Highlights
Financial Highlights of 3 rd FP

                                                         3rd FP (ended December 2018)                             Major difference factor

                                                  Augʼ18                                Increase /
                                                                         Actual
                                               forecast (note)                          decrease          Operating   Performance-based
                                                                                                                                            -101
                                                                                                           revenue    rent decrease
Statement of Income Data
(million yen)                                                                                                         Decreased O&M cost
                                                                                                          Operating                          -20
                                                                                                                      and depreciation
                                                                                                          expenses                           -10
                                                                                                                      expense
Operating revenues                                      1,886                1,785            ▲101
                                                                                                            Non-
                                                                                                          operating   Insurance proceeds    +19
Operating income                                          698                     644           ▲54        income
                                                                                                            Non-      Investment unit
                                                                                                          operating   issuance expenses      -29
Income before income taxes                                416                     413            ▲3       expenses    decrease

Net income                                                415                     412            ▲3

Distribution per unit                                                                                                     3rd FP
(including distributions in excess                      3,600                3,600                    -           distribution per unit
of earnings) (yen)                                                                                                     3,600 yen
Distributions per unit
(excluding distributions in excess                      1,798                1,783              ▲15
of earnings) (yen)

Distributions in excess of earnings
per unit (yen)
                                                        1,802                1,817                   15

(Note) Revised forecast as at 14-Aug-2018 as new assets were acquired.

                                                                                                                                                   3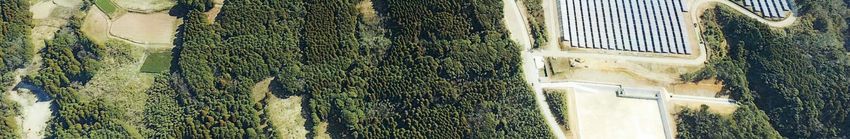
Portfolio Performance
Total energy output
(MWh)
3 rd FP actual energy output ÷ 3 rd FP projected energy output = 94.2%
15,000 Projected Actual
10,234 10,415 10,347 9,652
8,469 9,105 9,053
10,000 7,807 8,084 7,981
6,900
5,378
5,000
0
Jul.
7⽉18 Aug.
8⽉18 Sep.
9⽉18 Oct.
10⽉ 18 Nov.
11⽉18 Dec.
12⽉18
Energy output by project
S-01 CS Shibushi-shi (MWh) S-02 CS Isa-shi (MWh)
Power Plant 300 Power Plant 300
200 200
100 100
0 0
Jul.
7⽉ Aug.
8⽉ Sep.
9⽉ Oct.
10⽉ Nov.
11⽉ Dec.
12⽉ Jul.
7⽉ Aug.
8⽉ Sep.
9⽉ Oct.
10⽉ Nov.
11⽉ Dec.
12⽉
18 18 18 18 18 18 18 18 18 18 18 18
S-03 CS Kasama-shi (MWh) S-04 CS Isa-shi Dai-ni (MWh)
Power Plant 300 Power Plant 300
200 200
100 100
0 0
Jul.
7⽉ Aug.
8⽉ Sep.
9⽉ Oct.
10⽉ Nov.
11⽉ Dec.
12⽉ Jul.
7⽉ Aug.
8⽉ Sep.
9⽉ Oct.
10⽉ Nov.
11⽉ Dec.
12⽉
18 18 18 18 18 18 18 18 18 18 18 18
S-05 CS Yusui-cho (MWh) S-06 CS Isa-shi Dai-san (MWh)
Power Plant 300 Power Plant 400
300
200
200
100
100
0 0
Jul.
7⽉ Aug.
8⽉ Sep.
9⽉ Oct.
10⽉ Nov.
11⽉ Dec.
12⽉ Jul.
7⽉ Aug.
8⽉ Sep.
9⽉ Oct.
10⽉ Nov.
11⽉ Dec.
12⽉
18 18 18 18 18 18 18 18 18 18 18 18
S-07 CS Kasama-shi Dai-ni (MWh) S-08 CS Hiji-machi (MWh)
Power Plant 300 Power Plant 400
300
200
200
100
100
0 0
Jul.
7⽉ Aug.
8⽉ Sep.
9⽉ Oct.
10⽉ Nov.
11⽉ Dec.
12⽉ Jul.
7⽉ Aug.
8⽉ Sep.
9⽉ Oct.
10⽉ Nov.
11⽉ Dec.
12⽉
18 18 18 18 18 18 18 18 18 18 18 18
4
Portfolio Performance
S-09 CS Ashikita-machi (MWh) S-10 CS Minami Shimabara-shi (MWh)
Power Plant 400 Power Plant (East & West)
600
300
400
200
100 200
0 0
Jul.
7⽉ Aug.
8⽉ Sep.
9⽉ Oct.
10⽉ Nov.
11⽉ Dec.
12⽉ Jul.
7⽉ Aug.
8⽉ Sep.
9⽉ Oct.
10⽉ Nov.
11⽉ Dec.
12⽉
18 18 18 18 18 18 18 18 18 18 18 18
S-11 CS Minano-machi (MWh) S-12 CS Kannami-cho (MWh)
Power Plant 400 Power Plant 300
300
200
200
100
100
0 0
Jul.
7⽉ Aug.
8⽉ Sep.
9⽉ Oct.
10⽉ Nov.
11⽉ Dec.
12⽉ Jul.
7⽉ Aug.
8⽉ Sep.
9⽉ Oct.
10⽉ Nov.
11⽉ Dec.
12⽉
18 18 18 18 18 18 18 18 18 18 18 18
S-13 CS Mashiki-machi (MWh) S-14 CS Koriyama-shi (MWh)
Power Plant Power Plant 100
6,000
75
4,000
50
2,000 25
0 0
Jul.
7⽉ Aug.
8⽉ Sep.
9⽉ Oct.
10⽉ Nov.
11⽉ Dec.
12⽉ Jul.
7⽉ Aug.
8⽉ Sep.
9⽉ Oct.
10⽉ Nov.
11⽉ Dec.
12⽉
18 18 18 18 18 18 18 18 18 18 18 18
S-15 CS Tsuyama-shi (MWh) S-16 CS Ena-shi (MWh)
Power Plant 300 Power Plant 300
200 200
100 100
0 0
Jul.
7⽉ Aug.
8⽉ Sep.
9⽉ Oct.
10⽉ Nov.
11⽉ Dec.
12⽉ Jul.
7⽉ Aug.
8⽉ Sep.
9⽉ Oct.
10⽉ Nov.
11⽉ Dec.
12⽉
18 18 18 18 18 18 18 18 18 18 18 18
S-17 CS Daisen-cho (MWh) S-18 CS Takayama-shi (MWh)
Power Plant (A)(B) Power Plant 300
2,000
200
1,000
100
0 0
Jul.
7⽉ Aug.
8⽉ Sep.
9⽉ Oct.
10⽉ Nov.
11⽉ Dec.
12⽉ Jul.
7⽉ Aug.
8⽉ Sep.
9⽉ Oct.
10⽉ Nov.
11⽉ Dec.
12⽉
18 18 18 18 18 18 18 18 18 18 18 18
5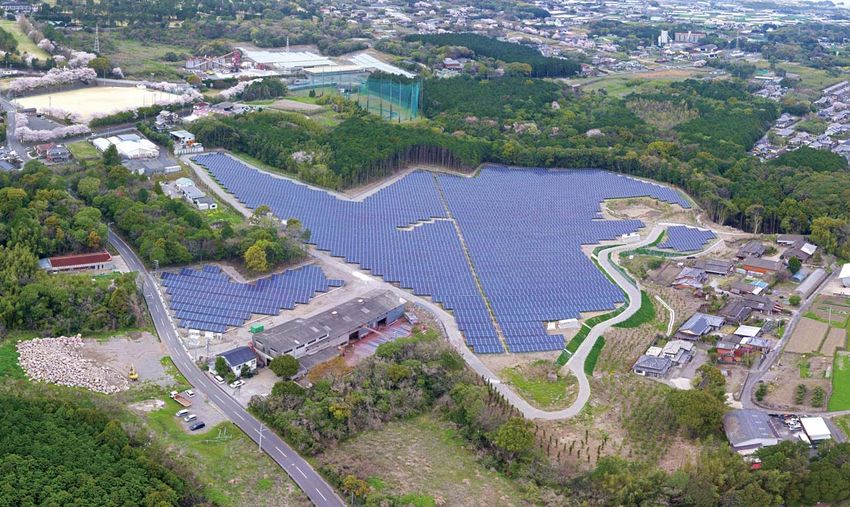
2. Major Topics for 3 rd FP
Overview of Follow-on Offering
Consistent growth of the largest listed infrastructure fund in Japan sponsored by the Canadian
Solar Group developing business globally
Overview of Follow-on Offering (Aug. 2018)
Offering format Reg-S Global Offering
Units offered 46,667
First listed infrastructure fund in Japan Total issue amount ¥4,509,198,875
Issue price ¥102,180
with a portfolio exceeding 100MW (panel output) Announcement date
Pricing date
14-Aug-2018
29-Aug-2018
Global coordinator Mizuho Securities Co., Ltd.
Historical panel output Overview of Portfolio (As at period-ended Decʼ2018)
105.6MW
(MW)
120 # of projects Total price(note) Panel output
100
80
2.5
30.3 30.3
2.5 18 ¥47.09Bn 105.6MW
60
40
72.7 72.7 (Note) “Price” refers to the median project valuation report amount, which is the
estimated values provided to us by PricewaterhouseCoopers Sustainability LLC in
20 its project valuation reports as of December 31, 2018.
0
Oct. 2017(IPO) Feb.2018 Sep.2018 Total
7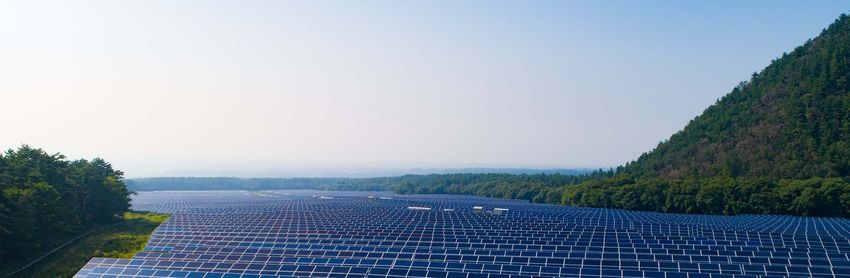
Portfolio
As at period-ended Decʼ2018
S-01 CS Shibushi-shi S-02 CS Isa-shi Power Plant S-03 CS Kasama-shi S-04 CS Isa-shi Dai-ni S-05 CS Yusui-cho
Power Plant 1.2MW 0.9MW Power Plant 2.1MW Power Plant 2.0MW Power Plant 1.7MW
S-06 CS Isa-shi Dai-san S-07 CS Kasama-shi Dai-ni S-08 CS Hiji-machi S-09 CS Ashikita-machi S-10 CS Minami Shimabara-shi
Power Plant 2.2MW Power Plant 2.3MW Power Plant (East & West) 3.9MW
Power Plant 2.1MW Power Plant 2.6MW
S-12 CS Kannami-cho S-13 CS Mashiki-machi S-14 CS Koriyama-shi S-15 CS Tsuyama-shi
S-11 CS Minano-machi
Power Plant 1.3MW Power Plant 47.7MW Power Plant 0.6MW Power Plant 2.0MW
Power Plant 2.4MW
S-16 CS Ena-shi S-17 CS Daisen-cho S-18 CS Takayama-shi
Power Plant 2.1MW Power Plant (A)(B)27.3MW Power Plant 1.0MW
8
Asset List

                                                                                                    Acquisition price      Price (yen        Investment         Panel output
  No.                          Project name                                  Location
                                                                                                     (yen millions)       millions) (note)    ratio (%)            (kW)

 S-01       CS Shibushi-shi Power Plant                           Shibushi-shi, Kagoshima                    540                  597            1.27              1,224.00

 S-02       CS Isa-shi Power Plant                                Isa-shi, Kagoshima                         372                  395            0.84                931.77

  S-03      CS Kasama-shi Power Plant                             Kasama-shi, Ibaraki                        907                1,078            2.29              2,127.84

  S-04      CS Isa-shi Dai-ni Power Plant                         Isa-shi, Kagoshima                         778                  820            1.74              2,013.99

  S-05      CS Yusui-cho Power Plant                              Aira-gun, Kagoshima                        670                  707            1.50              1,749.30

  S-06      CS Isa-shi Dai-san Power Plant                        Isa-shi, Kagoshima                         949                1,006            2.14              2,225.08

  S-07      CS Kasama-shi Dai-ni Power Plant                      Kasama-shi, Ibaraki                        850                  892            1.89              2,103.75

  S-08      CS Hiji-machi Power Plant                             Hayami-gun, Oita                         1,029                1,082            2.30              2,574.99

  S-09      CS Ashikita-machi Power Plant                         Ashikita-gun, Kumamoto                     989                1,055            2.24              2,347.80

  S-10      CS Minamishimabara-shi Power Plant (East & West)      Shimabara-shi, Nagasaki                  1,733                1,915            4.07              3,928.86

  S-11      CS Minano-machi Power Plant                           Chichibu-gun, Saitama                    1,018                1,161            2.46              2,448.60

  S-12      CS Kannami-cho Power Plant                            Tagata-gun, Shizuoka                       514                  575            1.22              1,336.32

  S-13      CS Mashiki-machi Power Plant                          Kamimashiki-gun, Kumamoto               20,084              23,035            48.91             47,692.62

  S-14      CS Koriyama-shi Power Plant                           Koriyama-shi, Fukushima                    246                  261            0.55                636.00

  S-15      CS Tsuyama-shi Power Plant                            Tsuyama-shi, Okayama                       746                  791            1.68              1,963.00

  S-16      CS Ena-shi Power Plant                                Ena-shi, Gifu                              757                  813            1.73              2,124.20

  S-17      CS Daisen-cho Power Plant (A) (B)                     Saihaku-gun, Tottori                    10,447              10,581            22.47             27,302.40

  S-18      CS Takayama-shi Power Plant                           Takayama-shi, Gifu                         326                  330            0.70                962.28

                                                Total                                                     42,961              47,099           100.00            105,692.80

(Note)   “Price” refers to the median project valuation report amount, which is the estimated values provided to us by PricewaterhouseCoopers Sustainability LLC in its project
         valuation reports as of December 31, 2018.

                                                                                                                                                                                  9
Curtailment Rule
Impact of “Output Curtailment” is limited
① Thermal power generation is the first to be subject of output controls as it comprises roughly 85% of the current
energy mix. Priority of output controls on solar and wind power is on the lower end of the scale below pumped-
storage hydroelectric power plants, power supply beyond the respective grid using transmission line, and biomass
② All CSIF assets as at the end of the 3 rd FP is subject to “30-day output control”
→ Solar power output of CSIF-owned assets is subject to a maximum of 30-day output curtailment within
the respective year
00 Regulation of Power Sources Ⅰ (generators and those of pumped storage
Order of the sources regulated outputs
secured by general distribution utilities for adjustment) and pumping operation
Regulation of Power Sources Ⅱ (generators and those of pumped storage which
can be controlled by general distribution utilities) and pumping operation
01 Regulation of Power Sources Ⅲ (generators such like thermal power including
woody biomass and those of pumped storage which canʼt be controlled by general
distribution utilities) and pumping operation
02 Supplying beyond the Kyushu region using transmission line
03 Regulation of biomass
04 Regulation of biomass using regional resources ※1
05 Regulation of power sources fluctuated by natural factors (Solar and wind)
06 Measures based on Organization for Cross-regional Coordination of
Transmission Operators※2
7 Regulation of long-term fixed power sources (Nuclear, Hydro and geothermal)
*1 They will be exempted from restraining output when controlling output is difficult due to technical matters and so on
*2 Interchange according to instructions given by Organization for Cross-regional Coordination of Transmission Operators
Source︓KYUSHU ELECTRIC POWER CO., INC.
10Impact of Curtailment on 3 rd FP Performance
Status of CSIF solar plant operations
9 out of 18 assets in the portfolio are located in Kyushu
Kyushu Electric Power conducted an output curtailment spanning over a total of 8 days during 3 rd FP-
ending Dec 2018 (184 day period).
Certain plants owned by CSIF were subject to the curtailment for a maximum of 2 days.
Date of curtailment Affected solar plant
14-Oct S-08 Hiji-machi PP
20-Oct S-13 Mashiki-machi PP
21-Oct S-02 Isa-shi PP S-04 Isa-shi Dai-ni PP S-05 Yusui-cho PP
Round-1
Minami Shimabara-shi PP
S-06 Isa-shi Dai-san PP S-09 Ashikita-machi PP S-10
(East & West)
3 - N o v S-01 Shibushi-shi PP
4 - N o v S-01 Shibushi-shi PP S-08 Hiji-machi PP S-13 Mashiki-machi PP
Round-2
11-Nov S-04 Isa-shi Dai-ni PP S-05 Yusui-cho PP S-06 Isa-shi Dai-san PP
Impacts
Total rent income decrease for Ratio of impacted rent against
3 rd FP-ending Dec2018 total portfolio rent revenue for Overall, the impact
FP-ending Dec2018 of the output
curtailment was
¥3.83 MM 0.21 % minor
113. CSIFʼs Unique Features
Overview of Sponsor
Canadian Solar Groupʼs history Canadian Solar Groupʼs Global Operations
Founded in Ontario, Canada, 2001
Listed on NASDAQ (CSIQ) in 2006
Canada
Over 12,000 employees globally 1
2 U.S.
3 Mexico
4 Brazil
Presence in 20 countries/territories 5 Germany
6 Spain
7 Turkey
8 South Africa
Delivered solar panels amounting to over 9 UAE 1 Canada
10 India Brazil
30 GW total capacity
2 As of March 31, 2018
11 Singapore 3 China ●Base of Sales
12 Japan 4 Thailand ◆Base of Manufacturing
13 Korea 5 Vietnam
4.6 GWp solar power plants build and 14 Australia 6 Indonesia
connected globally (incl. Recurrent Energy) Source: Compiled by the Asset Manager based on
“Investor Presentation as of November15,2018”
by Canadian Solar Inc.
Ranked 3rd globally in terms of sales
Canada (2009) U.S. (2010)
Entered the Japan market in 2009 and (*) There is no assurance that we can acquire the solar energy projects showed in the
above pictures in the future as of this writing.
established proven track record for shipping
PV modules
13Vertically-integrated Business Model
PV plant
Growth Acquire PV
plants
Project owner CS Mashiki-machi
Power Plant
Own and lease solar
Provide
energy projects O&M
services
Canadian Solar Infrastructure Fund, PV plant
Lease PV management
Inc.
facilities
PV plant
development
Canadian Solar Group (incl. sponsor)
Module
Cell
Developer
Canadian Solar Projects K.K.
Wafer
Ingot
O&M provider
Canadian Solar O&M Japan K.K.
Silicon
14Strong Financial Base
Financial soundness attributed to fixed interest rate conversion and LTV controls
Initial
Loan
drawdown Interest
Type Outstanding Interest rate Drawdown date Maturity
amount rate type
(yen millions)
(yen millions)
Base rate plus 0.45%
Long- 10 years from drawdown date
15,700 14,796 (fixed at 0.845% upon executing Fixed 31-Oct-2017
term JCR Green Bond Evaluation
interest rate swap)
Long-
900 844 Base rate plus 0.45% Variable 1-Feb-2018 3 years from drawdown date
term
Base rate plus 0.45%
Long-
8,000 7,806 (fixed at 1.042% upon executing Fixed 6-Sep-2018 10 years from drawdown date
term
interest rate swap)
Earlier of (i) June 30, 2020 or (ii) first
Long-
850 850 Base rate plus 0.20% Variable 6-Sep-2018 interest payment date after the
term
consumption tax refund date
Total 25,450 24,297
Ratio of fixed-to-variable rate loans and LTV
Fixed-to-variable LTV
interest rate ratio (as at end of December 2018)
(as at end of December 2018)
93.03% 49.78% 51.59%
(excl. consumption tax bridge loan) (incl. consumption tax bridge loan)
(Note) “Fixed-to-variable interest rate ratio” refers to the ratio of fixed interest rate liabilities to total interest-bearing liabilities (incl. consumption tax bridge loan – the same
shall apply herein) as of this writing. Variable interest rate liabilities that were converted to fixed interest rate liabilities through interest rate swap agreements were
deemed as fixed interest rate liabilities.
15Leasing Structure
Calculation method of basic rent and variable rent in anticipated projects to be acquired
Basic rent Monthly projected energy output (P50) ×(100-Y)% × 70% × FIT purchase price
Variable rent (Monthly actual energy output × (100-Y)% × FIT purchase price) - Basic rent
Even if actual energy output is lower than projected energy output (P50), the operator will be able to receive basic rent from lessee
If actual energy output exceeds 70% of projected energy output (P50), possible to obtain variable rent
Diagram of rent structure
Projected revenue from sales of electricity
(before deducting lessee’s operating costs and
operator compensation)
Projected energy output (P50) ×Y%
×FIT purchase price Rental income of Canadian Solar
Infrastructure Fund, Inc.
Projected energy output (P50)
×FIT purchase price×(100-Y)%
Variable rent
Projected energy output (P50)
×FIT purchase price × X%
×Y%
Projected energy output (P50)
×FIT purchase price × X%
×(100-Y)%
Basic rent
*1: Projected energy output (P50) is monthly predicted solar energy output in
lease term as described in technical report
*2: Y is percentage based on lessee’s operation cost and operator compensation
*3: Negative variable rent is regarded as zero
Projected energy output Projected energy Actual energy output
(P50)×X% output (P50)
16Distribution Policy (Payout Ratio)
Distribution policy focusing on payout ratio
Cash distributions to our unitholders for each fiscal period are calculated by multiplying the residual free cash flow
(“NCF”), which refers to free cash flow (“FCF”) minus debt interest payments, by a payout ratio, which is determined
by us for each fiscal period.
Distribution in excess of earnings
Expenses of
Expenses of leasing business
leasing business
Debt interest
Capital expenditure
FCF made by
Debt interest Use for
renewable energy facilities
reinvestment
Total rental
Up to 60%
revenues Debt repayment
of depreciation Depreciation
Retained earnings
Residual FCF Residual FCF Distribution in
× excess of earnings
(NCF) Cash distribution
Payout ratio Distribution
Net income
from profit
Revenue Expenses Distribution Breakdown P/L
(Note-1) Residual FCF is calculated as free cash flow minus interest payments related to interest-bearing debt and repayments of interest-bearing debt for the relevant fiscal period plus
total amount of net cash flow remaining after deduction of distributions from the preceding fiscal periods.
(Note-2) Our calculation method of payout ratio differs from that of other enterprises (i.e. cash distribution divided by current income).
(Note-3) Under the standards set forth by the Investment Trusts Association, Japan, closed-end infrastructure funds, such as us, may return capital up to 60% of the amount obtained
by deducting the amount of their accumulated depreciation recorded as of the end of the preceding fiscal period from the amount of their accumulated depreciation calculated
as of the end of the relevant fiscal period.
(Note-4) The chart above is presented solely to facilitate a general understanding of the mechanism for cash distributions, and does not represent the share of our rental revenues or
cash distributions in excess of retained earnings. We may decide not to make any amount of cash distributions in excess of retained earnings for a particular fiscal period,
based on a consideration of factors such as economic or renewable energy market conditions or our financial condition, among other factors, after taking into account our
financial situation and alternative uses of cash, such as the execution of repair plans and capital expenditures, the repayment of borrowings and property acquisition
opportunities. We may, in place of making cash distributions in excess of retained earnings, decide to acquire our own units.
17Green Bond
Acquisition of JCRʼs Green Bond Evaluation
Borrowings executed on October 31, 2017 were assigned the highest-grade evaluation of “Green 1” in
Japan Credit Rating Agency (JCR) ʼs Green Bond Evaluation on November 22, 2017. JCR reviewed
Green Bond Evaluation on January 23, 2019 and continued the same "Green1" evaluation.
Acquisition price Borrowings
of 13 projects JPY 15.7 Bn Bank
acquired in IPO
JPY 30.4 Bn
JCR assigned
Unitholdersʼ the highest-grade evaluation
CS Mashiki-machi
Power Plant
equity Green1
issued on IPO in JCRʼs Green Bond Evaluation
184. Management Policy
4th 5th & 6th FP Business Forecast
業績予想
4th Fiscal Period 5th Fiscal Period 6th Fiscal Period
(ending June 2019) (ending December 2019) (ending June 2020)
Statement of Income (million yen)
Operating revenue 2,072 2,154 2,062
Operating profit 703 784 723
Ordinary profit 573 659 602
Current net profit 572 658 602
DPU (incl. distributions in excess of earnings) 3,600 3,600 3,600
DPU (excl. distributions in excess of earnings) 2,478 2,849 2,605
Per unit distributions in excess of earnings 1,122 751 995
Congruent with CSIFʼs policy to maintain stable levels of distributions,
projected DPU for the 4 th FP (ending Jun. 2019), 5 th FP (ending Dec. 2019) and
6 th FP (ending Jun. 2020) is ¥3,600
(Note-1) Figures are rounded down to the nearest million yen.
(Note-2) Above forecasts are based on earnings summary dated 15-Feb-2019 and is subject to change due to factors including without limitation, acquisition or sale of renewable
energy projects, changes in infrastructure markets, fluctuation in interest rates and other changes in circumstances surrounding CSIF. Forecasts do not guarantee any
dividend amounts.
20External Growth Strategy(Sponsor Pipeline)
Achieve ¥100Bn in asset size over the medium term drawing on acquisitions from sponsor pipeline
Sponsor portfolio snapshot Operational and under
Under development
Total sponsor portfolio(1)
construction
FIT purchase price range: ¥32~¥40/kWh(1) 26projects, 386.8MW
10projects, 174.2MW 16projects, 212.6MW
By size (per asset) By FIT price (panel output)
5.7%
3
9.9% 21.7% ENR projects (2)
9 228.0MW
8
50MW以上
50 MW~
40円/kWh
¥40/kWh
10MW以上50MW未満
10MW~50MW
5MW以上10MW未満
5MW~10MW
36円/kWh
¥36/kWh Map of owned assets and sponsor assets
32円/kWh
¥32/kWh
2MW以上5MW未満
2MW~5MW 62.6% Operational
32円/kWh未満
~¥32/kWh CS Gunma Aramaki ●(内、2018年9⽉
稼働済資産
(Assets acquired as at
5 2MW未満
~2MW
CS Hiji-machi
CS⽇出町発電所 Power Plant CS群⾺新牧発電所 公募増資時取得物件は
1 (2.5MW)
(2.5MW)
Power Plant
(19.0MW)
( 内 、取6得are
Sept. 予 定highlighted
資産は
(19.0MW) in太枠
boldにて記載)
(as at 31-Jul-2018) (as at 31-Jul-2018) frame)
CSJ Oita Power Plant
CSJ⼤分発電所 CS Yamaguchi Shinmine ● Under
建設中資産 Construction
CSJ⼭⼝新美祢発電所 ● Under
開発中資産
(53.4MW)
(53.4MW) Power Plant
(56.3MW) Development
(56.3MW) ● Acquired
保有資産 by CSIF
Operational start year and status of
CS Mashiki-machi
CS益城町発電所
Power Plant
(47.6MW) CS⼤⼭町発電所
CS Daisen-cho(A) 、 CS Marumori-machi
CS丸森町発電所
(47.6MW) Power Plant
同発電所
Plants (B)
sponsor portfolio assets(1)
Power (A) & (B) (2.2MW)
(2.2MW)
(27.3MW)
(27.3MW)
CS南島原市発電所 (東)
CS Minamishimabara-shi 、
CS Koriyama-shi
Power同発電所 (⻄)
Plant (East・West) CS Takayama-shi Power CS郡⼭市発電所
Power Plant
(MW) MW(稼働済)
Operational
Under
MW(建設中)
Under
MW(開発中) MW(ENR対象物件)
ENR projects (as at 31-Jul-2018) (3.9MW)
(3.9MW) CS⾼⼭市発電所
Plant (0.6MW)
(0.6MW)
construction development
(0.9MW)
(0.9MW)
450 CSAshikita-machi
CS 北町発電所 CS美⾥町発電所
CS Misato-machi
400 386.8 MW Power Plant
(2.3MW) Power Plant
(1.0MW)
(2.3MW) (1.0MW)
35.8
350 CS皆野町発電所
CS Minano-machi
CS CS伊佐市発電所
Isa-shi Power Plant Power Plant
300 (2.4MW)
134.4 212.6 (0.9MW)
(0.9MW) (2.4MW)
250 CS Isa-shi Dai-ni
CS伊佐市第⼆発電所 CS笠間市発電所
CS Kasama-shi Power Plant
34.7 Power Plant (2.1MW)
200 (2.0MW)
(2.0MW) (2.1MW)
150 7.6 53.4 CS Shizuoka Shuzenji CS笠間市第⼆発電所
64.2 CS伊佐市第三発電所
CS Isa-shi Dai-san CS静岡修善寺発電所 CS Kasama-shi
228.0 Power Plant
(2.2MW) Power Plant
(10.8MW) (2.1MW)
Dai-ni Power Plant
100 (10.8MW)
10.8 (2.2MW) (2.1MW)
50 110.0 110.0 CS Tsuyama-shi CS Kannami-cho
CS湧⽔町発電所
CS Yusui-cho Power Plant CS津⼭市発電所
Power Plant CS函南町発電所
Power Plant
0 (1.9MW) (1.3MW)
稼働済 2018年 2019年 2020年 2021年以降 累計 ENR対象物件 (1.7MW)
(1.7MW) (1.9MW) (1.3MW)
Operational Aug.2018~ 2019 2020 2021~ Total ENR projects(2)
(8⽉以降) (注9)(注10)
(注2)
CS Shibushi-shi CS Ena-shi CS Shizuoka Numazu
CS志布志市発電所
Power Plant
CS恵那市発電所
Power Plant
CS静岡沼津発電所
Power Plant
Source: Compiled by the Asset Manager based on disclosures by Canadian Solar Projects K.K. (1.2MW) (2.1MW)
(2.1MW)
(1.0MW)
(1.0MW)
(1.2MW)
Note: (1) Includes the acquired assets from the follow-on offering in September 2018.
(2) Total panel output of ENR projects are based on development plans as of July 31, 2018. Forecasted output and actual output may differ. Licenses and permits for ENR project development may not be completed and there is no assurance
that these projects will reach completion nor be ready for commercial operation. With respect to these ENR projects, CSIF has been granted Exclusive Negotiation Rights from project developers. As at July 31, 2018, the sponsor does not
retain ownership of these projects and there is a likelihood that the sponsor will not acquire the project among other reasons. As at July 31, 2018, CSIF does not intend to acquire these projects and there is no assurance that CSIF will acquire
these projects.
(3) The panel output capacity for the solar energy projects under construction and projects under development is based on development plans as of July 31, 2018. Forecasted output and actual output may differ.
21METI Policy on “Unoperated” Solar Projects
Policy to reduce FIT price on a portion of unoperated solar projects certified between FY2012-2014
Overview Projects affected by policy
Many projects after becoming FIT-certified are not operational.
Hence, METI announced a deadline(1) for the start of operation as Unoperated projects(2)
means to reduce the number of projects that havenʼt started Year of FIT FIT price Operational Not operational Total
operations. certification (yen) (10,000kW) (10,000kW) (10,000kW)
2012 40 1,147 335 1,482
2013 36 1,355 1,284 2,639
METI imposed deadline to submit an application for grid connection
work and announced that price guarantees under FIT price will be 2014 32 516 733 1,249
reduced for any project that misses the deadline. 2015 27 174 177 351
For projects that have missed the deadline, the FIT purchase price
2016 24 142 654 796
will correspond to prices 2 years prior to the deadline expiry.
2017 21 16 247 263
Deadline for
Deadline for start
Project output application for grid Total 3,351 3,430 6,780
of operations
connection work
Less than 2MW 2019/3/31 2020/3/31 【Affected projects】
Commercial projects certified between FY2012〜2014
More than 2MW 2019/9/30 2020/9/30 Projects where the operational start date is not set
Projects with over 2MW capacity that have not started
Under environmental construction(3)
2020/3/31 2020/12/31
assessment
Source: METI
Note: (1) Deadline for starting operations will be established on projects that have concluded a Grid
Connection Agreement. If the deadline is missed, the duration of grid connection will be
shortened on a monthly basis.
This policy is expected to spur the development of unoperated (2) Translated excerpts from METIʼs report (“既認定案件による国⺠負担の抑制に向けた対応”)
released 5-Dec-2018.
solar projects and fill up unused grid capacity by reducing such (3) Refers to projects where no “Construction Plan” pursuant to the Electric Utility Industry
delayed projects as well as stimulate the solar energy market. Law has been submitted as at 5-Dec-2018
FIT price for operational projects are not affected by this policy,
and projects that have submitted an application for grid
connection work are not immediately affected.
Impact on sponsor pipeline is minimal
22Characteristics of PV Plant Revenue
Forecastability of earning stability on a long-term basis
FIT price and FIT period of our PV plants are binding in accordance with the Feed-in-Tariff system. Moreover, given
that our assets-under-management are set up so that we can capture basic rent from the lessee, we assume that any
decline in rent income wonʼt exceed a certain limit.
Given that expenses on depreciable assets are largely fixed, earnings forecasts can be realistically projected for the
long-term.
Dynamics of PV plant revenue during FIT period
○ Assuming that we purchase PV projects and do not purchase
additional assets nor sell them, fluctuations in operating revenue,
Amount
operating expenses and non-operating expenses during the FIT
period will follow the general tendencies listed below. Hence, our
Operating understanding is that CSIFʼs current income will gradually increase
over the medium to long term during the FIT period.
revenues
Operating ○ Operating revenues generally decrease gradually over the medium to
expenses long term due to expected deterioration of PV modules.
○ Operating expenses generally decrease (mainly composed of taxes
on depreciable assets that are calculated using the straight-line
method) gradually over the medium to long term, under the
Net income
presumption that expenses other than taxes on depreciable assets
are largely fixed (including assumed regular maintenance costs).
Non-operating ○ Amortization payments of loan principal and interest rates that are
partially fixed generally cause non-operating expenses to decrease
expenses
gradually over the medium to long term given typical amortization
schedules, as these payments are the primary component of non-
Time operating expenses.
23Appendix
Unit Price Performance

 (JPY)
 (円)                                                                                                                              (units)
                                                                                                                                    (⼝)
                                            Unit price(left axis)            Volume(right axis)
115,000                                                                                                                            6,000

110,000

105,000

                                                                                                                                   4,000

100,000

 95,000

                                                                                                                                   2,000

 90,000

 85,000

 80,000                                                                                                                            0
     2018/7/2
     Jul.2 2018     2018/8/2
                  Aug.2 2018   2018/9/2
                               Sep.2 2018                       2018/10/2
                                                                Oct.2 2018                         2018/11/2
                                                                                                  Nov.2 2018    2018/12/2
                                                                                                               Dec.2 2018   Dec.28 2018

                                                                                                                                      25
TSE Listed Infrastructure Fund Market
History of TSE Infrastructure Fund Market
April 2015 Inception of TSE Infrastructure Fund Market
- Under the Act on Special Measures Concerning Taxation, the period of conduit status for infrastructure funds
investing mainly in renewable energy generators was extended from 10 years to 20 years.
- Exceptional rule for renewable energy power generators
- Conditional that renewable energy facilities are acquired and ready for lease by March 2017
April 2016 Infrastructure fund
Conduit status of infrastructure funds Debt
extended from 10 years to 20 years Renewable energy
power plant Equity
June 2016 IPO of Takara Leben Infrastructure Fund (17.9MW, ¥4.52Bn initial market cap(Note))
December 2016 IPO of Ichigo Green Infrastructure Investment Corporation (25.8MW, ¥5.02Bn initial market cap(Note))
March 2017 IPO of Renewable Japan Energy Infrastructure Fund, Inc. (21.8 MW, ¥3.78Bn initial market cap(Note))
Requisite acquisition period for infrastructure funds to invest in renewable energy generators and be approved
April 2017
conduit tax treatment (for 20 years) was extended three years from March 31, 2017 to March 31, 2020
IPO of Canadian Solar Infrastructure Fund, Inc.
October 2017
(72.7MW, ¥17.93Bn market cap(Note) as at IPO)
September 2018 Follow-on Offering of Canadian Solar Infrastructure Fund, Inc.
September 2018 IPO of Tokyo Infrastructure Energy Investment Corporation (20.0MW, ¥4.54Bn initial market cap(Note))
February 2018 IPO of ENEX Infrastructure Investment Corporation (37.6MW, ¥8.78Bn initial market cap(Note))
Source: Bloomberg
Note: Market cap calculated by multiplying the total issued units on the listing date and the IPO subscription price. 26Renewable Energy Market in Japan
Renewable energy mix and comparable energy self-sufficiency by country
At the Paris Climate Change Agreement, Japan pledged to reduce CO emissions by 26% (vs. 2013 levels) by 2030
Comparable renewable energy mix (2014) Comparable primary energy self-sufficiency
amongst OECD (2012 estimates)
100%
1 Norway 677.4%
90% 2 Australia 235.4%
80% 3 Canada 166.2%
・・・
70%
60% 8 U.S. 85.0%
・・
50%
40% 14 U.K. 60.7%
15 France 52.9%
30%
・・・
20%
2 2014: 3.2% 20 Germany 40.1%
・・・
10%
0%
→2016: 7.8%
27 Spain 25.8%
・・・
2 2014: 23.3% Germany Spain England France America Japan 2016:8.4%
30 Korea 18.0%
→2016: 27.7%
・・・
Renewable energy (excl. hydropower) Hydropower Coal Oil LNG Nuclear 33 Japan 6.0%
34 Luxembourg 2.9%
0% 200% 400% 600% 800%
Source: Compiled by the Asset Manager based on the “FY2015 Annual Report on Energy (Energy White Paper
2016)” by METI. Source: Compiled by the Asset Manager based on Graph 111-1-1 of the FY2013 Annual Report on Energy
Note: Data on Japan based on the “Summary of Electric Power Development” by METI (FY2014 actuals). Data on (Energy White Paper 2014) by METI
other countries based on 2014 estimates and IEA Energy Balance of OECD Countries (2015 edition) Source: Complied by the Asset Manager based on “Energy Balance of OECD Countries 2013” by the IEA.
Changes in the energy market
METI projections of future energy mix and medium-long term changes to FIT purchase price
Trends in FIT purchase price and average system
Installed solar capacity… METI predicts that solar
costs of solar energy projects (2012-2018)
energy will comprise 7% of the total 2030 energy mix 50 42.1 50
(GW) 37.3
40 34.1 32.3 40
80 31.4 29.9
64.0 40 28.6
70
30 36 30
60 32
50 40.4 29
20 24 20
40 21
10 18 10
30
20
10 0 0
0 2012 2013 2014 2015 2016 2017 2018
June 2018
2018年6月 2030 Forecast
2030年度見込値 FIT Purchase Price Average system cost
買取価格(左軸) 10kW以上の太陽光発電設備のシステム費用の平均値(右軸)
(Left axis) (Right axis)
Source: Compiled by the Asset Manager based on the following: data from METI website, “Long-term Outlook of
Source: Compiled by the Asset Manager based on “Report on Procurement Prices after FY2019 (January 9, 2019)” by
Energy Supply and Demand (July 2015) by METI, “FY2015 Annual Report on Energy (Energy White Paper
METI.
2016)” by METI and data from the Federation of Electric Power Companies.
Note: (1) FIT purchase price for each year based on a period from April to March of the following year and excludes
Note: Projection for FY2030 is based on the percentages and installed capacity disclosed in the reports prepared
national and local consumption taxes.
by METI and are not based upon our calculations. There is no guarantee that the projected percentages or
(2) Average system costs are based on the calendar year.
capacity will be realized.
27Company History
Timeline
Date Event
Notification on incorporation of the Investment Corporation by the organizer (Canadian Solar
April 21, 2017
Asset Management K.K.) in accordance with Article 69, Paragraph 1 of the Investment Trust Law
Registration of incorporation of the Investment Corporation in accordance with Article 166 of the
May 18, 2017
Investment Trust Law, Company Incorporation
Application for registration of the Investment Corporation in accordance with Article 188 of the
May 25, 2017
Investment Trust Law
Prime Minister's approval of registration of the Investment Corporation in accordance with Article
June 9, 2017 187 of the Investment Trust Law (Kanto Regional Finance Bureau Director-General Registration
No. 127)
July 11, 2017 Amendment of Articles of Incorporation
October 30, 2017 Listing on Tokyo Stock Exchange (Securities Code:9284)
September 6, 2018 Follow-on Offering
28Balance Sheet for 3 rd FP
3 rd Fiscal Period (ended December 2018)
Assets (in thousands of yen) Liabilities and Net Assets (in thousands of yen)
Current assets Current liabilities
Cash and bank deposit 3,222,807 Accounts payable (other) 25,290
Operating accounts receivable 208,913 Long-term borrowings to be repaid within 1 year 1,239,176
Prepaid expenses 107,714 Accounts payable 56,317
Consumption taxes receivable 793,148 Accrued expenses 73,449
Other current assets 685 Income taxes payable 857
Total current assets 4,333,268 Deposits received 5,246
Fixed assets Total current liabilities 1,400,337
Property and equipment Fixed liabilities
Structures 797,621 Long-term borrowings 23,057,919
Accumulated depreciation △28,399 Total fixed liabilities 23,057,919
Total structures (net) 769,221 Total liabilities 24,458,257
Machinery and equipment 37,427,871 Unitholders’ equity
Accumulated depreciation △1,405,797 Unitholders’ capital 22,050,175
Total machinery and equipment (net) 36,022,074 Amount deducted from Unitholdersʼ capital △147,209
Tools, equipment and supplies 505,287 Unitholdersʼ capital (net) 21,902,965
Accumulated depreciation △22,181 Surplus
Total tools, equipment and supplies (net) 483,106 Unappropriated retained earnings 412,298
Land 4,309,021 (accumulated deficit)
6,244 Total surplus 412,298
Construction in progress
41,589,667 Total unitholders’ equity 22,315,263
Total property and equipment
Total net assets 22,315,263
Intangible assets
494,487 Total liabilities and net assets 46,773,521
Leasehold rights
Software 2,763
Total intangible assets 497,250
Investments and other assets
Long-term prepaid expenses 324,500
Deferred tax asset 12
Long-term deposits 7,800
Guarantee deposits 21,021
Total investments and other assets 353,333
Total fixed assets 42,440,252
Total assets 46,773,521 29Statement of Income for 3 rd FP
3 rd Fiscal Period (ended December 2018)
(in thousands of yen)
Operating revenues
Rental revenues 1,785,374
Total operating revenue 1,785,374
Operating expenses
Rental expenses of renewable energy projects 1,035,958
Asset management fee 43,934
Administrative service fees 17,066
Director’s compensation 2,400
Tax and dues 1,346
Other operating expenses 39,928
Total operating expenses 1,140,634
Operating profit/loss(△) 644,739
Non-operating income
Interest income 17
Insurance proceeds 18,815
Tax refunds 1,942
Total non-operating income 20,775
Non-operating expenses
Interest expenses 97,912
Borrowing-related expenses 103,408
Organization expenses -
Investment unit issuance expenses 51,132
Total non-operating expenses 252,452
Ordinary income 413,062
Income before income taxes 413,062
Income taxes 860
Income tax adjustments 14
Total income taxes 874
Net income 412,187
Profits (losses) brought forward 110
Unappropriated retained earnings
412,298
(accumulated deficit)
30Status of Unitholders
Unitholding (as at period-ended December 2018)
By unitholding amount By unitholders
■ Individuals / others 116,013 units (50.18%) ■ Individuals, others 9,564 (97.44%)
# of ■ Financial institutions 14,715 units (6.36%) ■ Financial institutions 31 (0.32%)
# of
investment
(incl. financial instruments firms) unitholders (incl. financial instruments firms)
units:
9,815
231,190 ■ Domestic corporates 43,740 units (18.92%) ■ Domestic corporates 154 (1.56%)
■ Foreign entities & individuals 56,722 units (24.53%) ■ Foreign entities & individuals 66 (0.67%)
Number of
Name Unitholding ratio to total
investment units
issued units (%)
held (units)
1 Canadian Solar Projects K.K. 33,895 14.66
2 GOLDMAN SACHS INTERNATIONAL 20,685 8.94
3 SSBTC CLIENT OMNIBUS ACCOUNT 12,831 5.54
4 UBS AG LONDON A/C IPB SEGREGATED CLIENT ACCOUNT 3,452 1.49
5 The Bank of Fukuoka, Ltd. 3,430 1.48
6 CITIBANK INTERNATIONAL PLC AS TRUSTEE FOR STANDARD LIFE WEALTH PHOENIX FUND 2,978 1.28
7 Individual investor 2,760 1.19
8 Individual investor 2,312 1.00
9 GOVERNMENT OF NORWAY 2,234 0.96
10 BNY FOR GCM CLIENT ACCOUNTS(E)ISG 1,538 0.66
Total 86,115 37.24
(Note): Unitholding ratio is rounded down to the nearest hundredth.
31Overall Structure
Identical structure as a typical J-REIT
Our revenue is derived from rent income of solar energy projects
Canadian Solar Asset Management K.K. Asset
Management Distributions
Agreement
Engaged in asset management in Canadian Solar
Asset Investors
Infrastructure Fund, Inc. Investment
Manager
Established in June 2016 Sponsor Corporation Equity
Support (Fund)
Agreement
Equity
Interest
Canadian Solar Projects K.K. (Sponsor) Loan
Agreements
(Sponsor / Operator)
Sponsor / Lenders
Engaged in construction and operation of solar Operator
energy facilities Solar Energy
Established in May 2014 O&M Service Projects
Agreement
Lease /
Purchase
Agreements
Canadian Solar O&M Japan K.K. Landowners
O&M
Provides O&M services to solar energy facilities
including our currently-owned projects
Established in June 2016 Lease / Operation
Agreement
Canadian Solar Japan K.K. Lessee-
Operator Utilities
Sales of PV modules for use in residential and Asset Management SPC, etc.
Service Agreements PPAs /
industrial solar power systems Interconnection
Agreements
Established in June 2009
32Disclaimer
• This document has been prepared to provide information, and is not for soliciting and inviting investments in or
recommending transaction of certain products. We request investors to make investments with their own
responsibility and judgment.
• This document does not constitute a disclosure document or a management report based on the Financial
Instruments and Exchange Act, the Act on Investment Trusts and Investment Corporations or the listing regulations
of the Tokyo Stock Exchange.
• In addition to information on Canadian Solar Infrastructure Fund, Inc. (the "Investment Corporation"), this document
includes figures, tables and data prepared by Canadian Solar Asset Management K.K. (the "Asset Manager") based on
data/index and other information released by third parties. Analysis, judgment and other views of the Asset Manager
on such information at the time of preparation are also included in this document.
• The information contained in this document is not audited and there is no assurance of the accuracy and certainty of
such information. Analysis, judgment and other non-factual views of the Asset Manager represent views of the Asset
Manager at this point in time. Different views may exist or the Asset Manager may change its views in the future.
• Figures under the same items of other disclosed materials may differ from figures presented in this document due to
difference in the rounding of fractions, etc.
• While the Investment Corporation takes reasonable care in the preparation of this document, there may be errors.
Readers are also cautioned that the contents of this document may be corrected or changed without prior notice.
• The Investment Corporation and the Asset Manager assume no responsibility for the accuracy of data, indexes and
other information released by third parties.
• This document includes statements regarding future policies, etc. of the Investment Corporation. However, these
statements do not guarantee said future policies, etc.
• For the convenience of preparing graphs, the dates indicated herein may differ from actual business dates.
33You can also read