SUMMARY VERSION - COMPLETED BY DKM ECONOMIC CONSULTANTS AND RPS CONSULTING ENGINEERS - IRBEA
←
→
Page content transcription
If your browser does not render page correctly, please read the page content below

The Economic Benefits
                           from the Development of
                               BioEnergy in Ireland
                              to meet 2020 Targets

                                   Summary Version

Completed by DKM Economic Consultants
and RPS Consulting Engineers
Foreword by Tom Bruton, President, Irish Bioenergy Association I am pleased to introduce this, the first study of its kind, with a mandate to assess the socioeconomic benefits of developing the Bioenergy sector in Ireland over the coming years to 2020. For some time there has been a need for a credible independent analysis of the investment required to develop the Bioenergy sector, the potential for job creation and the many positive socioeconomic benefits that accrue from switching from fossil fuels to indigenous sources of Bioenergy. A key tenet of this work has been to use conservative, cautious and credible estimates. The Government 2020 projections were used as the baseline for the size of the various renewable energy sub-sectors, not-withstanding the fact there is potential to exceed these projections. Although agriculture will play a key role in delivering energy crops and farm residues for Bioenergy production, no net new employment is assumed in agriculture. The importation of a sizable part of the transport biofuels amount is built into the estimates. Also co-firing at a significant scale is only projected to happen at one of the three power plants presently fired with peat by 2020. The study has confirmed the substantial economic benefits that can accrue by meeting the 2020 bioenergy targets, including: Over 3,600 new permanent jobs in the Bioenergy sector 1.5 billion direct investment in the sector 8,300 work years during construction and installation Sustain family farm incomes in Irish agriculture Reduce Ireland’s energy import bill by 7.5% Provide a secure and competitive energy source for Irish homes and business A static policy environment has not been assumed. It is clear that there are still regulatory and policy barriers to overcome before the 2020 targets can be met, or
indeed exceeded. There are also further opportunities which should not be missed,
such as:
To source more of our Bioenergy resources within Ireland and accrue the
associated economic benefits.
To develop export-led markets for Bioenergy resources and conversion
technologies
To create additional value-added products and industries based around
biomass resources
I look forward to working with fellow members of IrBEA and other stakeholders in
creating an environment where these projected jobs become real ones and where
the Bioenergy sector supports a robust and sustainable economic growth in Ireland
over the coming decades.
I would like to thank the independent consultants DKM and RPS Group for a
professional service and completing the challenging project in the absence of good
baseline economic data. The development of additional statistical reporting at
national and regional level would be welcome to better understand the impact of
policy initiatives to support Bioenergy.
I would especially like to thank my fellow steering group members (Joe O’Carroll,
Noel Gavigan and Pearse Buckley) as well as the many members of IrBEA who
contributed to this report. I gratefully acknowledge the funding received by
Sustainable Energy Authority of Ireland to complete the project.
About the Irish Bioenergy Association
IrBEA (www.irbea.org) was founded in 1999. Its role is to promote the bioenergy industry
and to develop this important sector on the Island of Ireland. The overall aim of IrBEA is to
promote biomass as an environmentally, economically and socially sustainable indigenous
energy resource, and also to promote its non-energy related benefits. The organisation is a
self-governing association of voluntary members and is affiliated to Aebiom, the European
Biomass Association. The geographical coverage of IrBEA is Northern Ireland and the
Republic of Ireland.
IrBEA (www.irbea.org) was founded in 1999. Its role is to promote the bioenergy industry
and to develop this important sector on the Island of Ireland.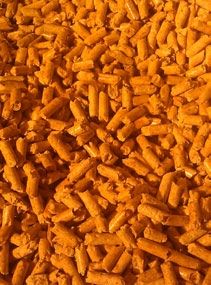
DKM Economic Consultants      RPS Consulting Engineers
6 Grand Canal Wharf           West Pier Business Campus
South Dock Road               Dun Laoghaire
Ringsend, Dublin 4.           County Dublin.
Telephone: 01 6670372         Telephone: 353 1 2884900
Fax:       01 6144499         E-mail: ireland@rpsgroup.com
E-mail:    info@dkm.ie        Website:www.rpsgroup.com/Ireland
Website: www.dkm.ie

                           The Economic Benefits of
                                the Development of
                                Bioenergy in Ireland

                                              January 2012
The Economic Benefits of the Development of Bioenergy in
                                                 Ireland
The Economic Benefits of the Development of Bioenergy in
                                                                         Ireland

Extract Contents

Executive Summary

Technical Model

Section 4: Economic Impacts

     Full Report available on www.irbea.org
The Economic Benefits of the Development of
                        Bioenergy in Ireland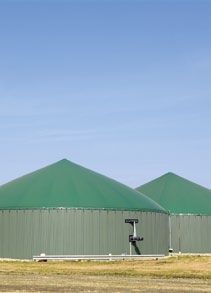
The Economic Benefits of the Development of
                        Bioenergy in Ireland
Executive Summary
This report, commissioned by the Irish BioEnergy Association (IrBEA) and the Sustainable Energy
Authority of Ireland (SEAI), focuses on the potential economic benefits of developing the
bioenergy sector in terms of employment creation, investment, trade and competitiveness.
A two-stage approach has been adopted in undertaking this study. The first involved the
development of a “technical” model of the sector to establish a baseline scenario of how the
various targets under the EU’s Renewable Energy Directive might be achieved and what this
might mean in terms of the number and type of bioenergy facilities operating in Ireland by 2020.
The technical model does exceed the various targets set; more detail can be found in Chapter 2.
The industry has achieved a level of maturity through various policy supports. The technical model
is based on the Government continuing to support the industry.
The second stage involved the quantification of potential economic impacts. This was based on a
combination of desk-top research of previous studies into the sector, information on facilities and
projects that are already in place or planned nationally, and also from consultation with, and
feedback from, market participants and industry experts. This approach was necessary because of
the lack of comprehensive published information and statistics on the bioenergy sector.
Key Economic Indicators
This study has confirmed that there are significant economic benefits that could be delivered as a
result of the development of the bioenergy sector in Ireland.
In total, it is estimated that almost €1.5 billion in direct investment in biomass processing
infrastructure and equipment will be required over the period from 2011 to 2020 to deliver the
output needed to meet the targets under RES-E, RES-H and RES-T.
Of this, approximately 55% would be spent in the Irish economy (the balance being imported plant
and equipment).
In addition, once fully operational, almost €430 million (2011 money) would be spent annually on
operating these facilities.
In terms of employment, almost 8,300 work years would be generated throughout the domestic
economy during the construction and installation of the various facilities required to deliver on the
targets.
Permanent ongoing employment generated by the sector would grow to over 3,600 FTEs by 2020.
This includes employment in the facilities themselves, in supply industries and in the wider
economy.
These figures record the net or incremental employment impacts across the different sectors only.
In some instances, for example, the net impacts may be relatively modest as they are to a large
degree securing the employment associated with existing activities.
Impact on the Rural Economy
A very significant proportion of the employment generated in the both the construction and
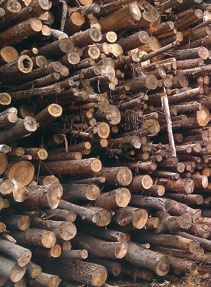
operation of the bioenergy facilities and infrastructure will be in rural Ireland. Most of the facilities
themselves will be based in rural areas, and most of the feedstock will be grown or produced
there.
The Economic Benefits of the Development of
Bioenergy in Ireland
The bioenergy sector can, therefore, offer farmers and other rural-based businesses new business
opportunities and provide alternatives to traditional farming activities. Revenue generated from the
production of bioenergy feedstocks or from the sale of energy produced from bioenergy can help
to sustain farm incomes and, because the majority of this income will be spent locally, will help to
maintain income and employment within the wider rural community.
This will, in turn, contribute to sustaining rural communities and help deliver more balanced
regional economic development.
Impact on Fuel Imports and Balance of Payments
Security of energy supply is a critically important economic issue for an island nation such as
Ireland.
The production of bioenergy offers the opportunity to address energy import dependency (which
currently stands at 90%) and also to protect against volatile oil and gas prices.
In addition, by substituting for fossil fuel imports it will help to improve the country’s balance of
payment position.
Ireland currently spends some €6.5 billion a year on imported gas, oil and coal. On the basis of
the scenario outlined in this report, the bioenergy sector will contribute the equivalent of 850 ktoe
per year by 2020. If this is domestically produced and is fully utilised, at today’s prices, this would
lead to a reduction in Ireland’s import bill of €488 million a year. That is, Ireland’s energy import bill
would be reduced by approximately 7.5%.
Competitiveness
The bioenergy sector also has the potential to contribute to Ireland’s competiveness. This will
depend in large part on the relative cost of producing bioenergy from the various sources,
compared to the alternative of continuing to import conventional fossil fuels.
While it would appear that, at least in the short-run, the cost of generating electricity from
bioenergy sources will need to be supported through Feed In Tariffs (e.g. Renewable Energy Feed
in Tariff – REFIT), usage of bioenergy for heating can reduce costs substantially for many Irish
businesses (and Irish households).
For example, the estimated saving from the use of biomass compared with gas oil in the 650
commercial and industrial boilers which are projected to be installed by 2020 is €208 million per
year (in 2011 prices).
Moreover, while the future path of fossil fuel prices is unknown, it is unlikely that they will return to
the relatively low prices of a few years ago, and there is a strong possibility that they will continue
to increase over the medium term as demand grows.
The presence of a strong bioenergy sector in Ireland provides a valuable hedge against future
energy price instability, as well as important security of supply benefits. Both of these will benefit
Ireland’s competitiveness.
In addition, Ireland is legally obliged to meet the targets under the Renewable Energy Directive,
and without the development of the sector and an appropriate supply base, Ireland will be forced
to rely on imported bioenergy to meet the 2020 targets.
Teagasc has warned that the price of imported bioenergy products is likely to increase
substantially as 2020 approaches and Member States compete for resources to meet their targets.
The development of an indigenous bioenergy sector and supply base will help to address these
concerns and provide greater security of supply of energy to the Irish economy.
While the overall economic benefit of this is difficult to measure, there would be a real economic
cost if Ireland fails to meet the terms of the Renewable Energy Directive, as the European Court ofThe Economic Benefits of the Development of
Bioenergy in Ireland
Justice can impose a range of fines on Ireland. These could be as high as €40 million per annum
plus a lump sum fine (minimum €1.5 million).
Environmental Impacts
The achievement of the biomass energy targets will also have a major impact on the environment
by reducing Greenhouse Gas (GHG) emissions.
It is estimated that the achievement of the targets will result in a saving of 3.14 million tonnes of
CO2 per annum by 2020. This is equivalent to roughly 5% of total GHG emissions in 2009, and
would represent a significant contribution to the required reduction in GHG emissions to be
achieved by 2020, under Ireland’s international commitments.
The value of the emissions reduction could be €94 million per annum by 2020, based on the level
of carbon tax envisaged in the Government’s National Recovery Plan 2011-2014.
Other Impacts
While the development of the bioenergy sector in Ireland has the potential to support significant
spending and employment creation in the domestic economy, a significant proportion is also
expected to “leak” out of the economy in the form of imported equipment and professional
services.
There is, therefore, the potential for Ireland to secure an even greater share of the economic
benefits through the development of a local supply base.
This also offers an opportunity for the development and testing of new technologies, processes
and skills, which could, in turn, be used to develop an export-focussed industry, as has happened
in other countries.
This will be dependent however on the growth of a critical mass of local activity in the bioenergy
sector, as is envisaged under the baseline scenario presented here.
The expectation under the baseline scenario is also that significant amounts of bioenergy will need
to be imported to reach the required targets. Clearly, if this could be substituted by domestic
production, further economic opportunities and benefits would accrue to Ireland.The Economic Benefits of the Development of Bioenergy in Ireland
Table 2.7 Technical Model Non-Imports Scenario
Bioenergy Bioenergy Bioenergy
Representative No. of Facility Electricity Facility Heat Biomass
Facility Technology / Size Feedstock Hours of Operation Contribution to Contribution to Contribution to TOTAL
sizes facilities Output Output Contribution
Electricity Heat Transport
UNITS Tonnes MWe MWth % hrs ktoe ktoe ktoe ktoe
Biomass Heat Only Domestic Boilers 100% Wood Pellet 5 14,000 0 0.015 100 1500 0.00 27.09 27.09
Commercial Boiler 65% Wood Chip / 35% Pellet 379 450 0 0.4 100 3500 0.00 54.18 54.18
Industrial Boiler 80%Wood Chip / 20% Pellet 4,245 200 0 2 100 7500 0.00 258.00 258.00
Biomass CHP Small 100% Wood Chip 7,916 15 1 1.9 100 7500 9.68 18.38 28.06
Biomass CHP Large 100% Wood Chip 63,325 5 8 15.2 100 7500 25.80 49.02 74.82
Biomass to Power Large 100% Wood Chip 400,000 1 or more 55 0 100 7500 35.48 0.00 35.48
Poolbeg, Dublin Incineration CHP Municipal solid waste (MSW) 600,000 1 60 55 65 7500 25.16 23.06 48.21
Carranstown, Meath Incineration Power Only Municipal solid waste (MSW) 200,000 1 22 0 65 7500 9.22 0.00 9.22
100 kt willow, 10kt miscanthus, 100kt sawmill
Edenderry Power only residue, 100kt forestry residue, 190kt dry 500,000 1 117.5 0 50 7400 37.39 0.00 37.39
materials (wood pellet, almond shell etc.)
AD on-farm small AD-CHP 1/2 grass silage, 1/2 slurry 13,825 30 0.25 0.25 100 7500 4.84 4.84 9.68
AD on-farm medium AD-CHP 1/2 grass silage, 1/2 slurry 27,650 30 0.5 0.5 100 7500 9.68 9.68 19.35
AD on-farm Large AD-CHP 1/3 grass, 1/3 slurry, 1/3 OFMSW/food waste 39,512 10 1 1 100 7500 6.45 6.45 12.90
Centralised AD AD-CHP 1/2 Slaughter Waste, 1/2 OFMSW/food waste 24,518 4 1 1 100 7500 2.58 2.58 5.16
Municipal Sewage AD AD-WWTP Onsite Waste Water 215,000 4 1 1 100 7500 2.58 2.58 5.16
Landfill Gas Small Onsite Landfill 0 10 1.5 0 100 4000 5.16 0.00 5.16
Large Onsite Landfill 0 5 5 0 100 4000 8.60 0.00 8.60
Biomethane Bioenergy
Representative No. of Total Biomethane
Biomethane Technology Feedstock Production per Contribution to
sizes facilities Production (m3)
Facility (m3) Heat
AD on-farm Large Biomethane for Injection 29,000 t grass silage, 21,000 t slurry 50,000 5 1,986,893 9,934,463 8.97 8.97
Centralised AD Biomethane for Injection 1/2 Slaughter Waste, 1/2 OFMSW/food waste 50,000 5 4,167,725 20,838,625 18.81 18.81
Bioenergy
Representative No. of Energy per
Biofuels Technology Feedstock Output Biofuel Output Contribution to
sizes Facilities litre
Transport
UNITS Tonne/yr Million Litres MJ/L MWh ktoe
Bioethanol
Carbery Plant , Cork Fermentation Cheese Whey 30,000 1 10.5 21.2 61,838 5.32 5.32
Further Facilities Fermentation Wheat & Sugar Beet 700,000 1 120 21.2 706,723 60.78 60.78
Biodiesel
Green Biofuels, New Ross Esterification Rapeseed oil, Tallow and RVO 25,500 1 30 32.8 273,355 23.51 23.51
Further Facilities Esterification Rapeseed oil, Tallow and RVO 102,000 1 120 32.8 1,093,421 94.03 94.03
% of TFC Bioenergy Bioenergy Bioenergy
(ktoe) from
TARGETS for BIOENERGY TFC (ktoe) from Contribution to Contribution to Contribution to TOTAL
Bioenergy
Bioenergy Electricity Heat Transport
Electricity 2,613.2 2.0 52.3 Bioenergy Target 52.3 421.3 127.7 601.3
Bioenergy Target % of
Thermal 4,389.0 9.6 421.3 2.0 9.6 3.0 5.0
TFC
Transport for RES-T 4,257.0 3.0 127.7 Bioenergy Total 182.60 483.63 183.64 849.87
TOTAL 12,123.2 5.0 601.3 Bioenergy Achieved % 7.0 11.0 4.3 7.0
Biofuels Imports 199.49
Bioenergy Total plus
183.24 483.63 383.13 1050.00
imports
Bioenergy Achieved % 7.0 11.0 9.0 8.7The Economic Benefits of the Development of
Bioenergy in IrelandThe Economic Benefits of the Development of
Bioenergy in Ireland
Section 4 Economic Impacts
The development of the Irish bioenergy sector offers a significant opportunity to address Ireland’s
challenging targets on renewable energy, emissions reductions and waste management. Over and
above these, however, this study has confirmed that there are also significant economic benefits that
could be delivered as a result of the development of the sector.
It will, however, require a significant capital investment in a wide range of bioenergy infrastructure if
these targets are to be achieved. In total, it is estimated that almost €1.5 billion in direct investment in
1
biomass processing infrastructure and equipment will be required over the period to 2020 to deliver
the output needed to meet the targets under RES-E, RES-H and RES-T.
This investment will deliver the following energy outputs, by 2020:
Table 4.1: Domestic Contribution of Biomass to Ireland's Energy Demand, 2020 (kTOE)
Bioenergy Bioenergy Bioenergy Bioenergy
Contribution Contribution Contribution to Total Contribution
to RES-E to RES-H Res-T
Biomass Heat Only 339.3 339.3
Biomass CHP 71.0 67.4 138.4
Waste to Energy 34.4 23.1 57.4
Co-firing 37.4 0.0 37.4
Anaerobic Digestion 23.5 23.5 47.1
Municipal Sewage 2.6 2.6 5.2
Landfill Gas 13.8 0.0 13.8
Biomethane 27.8 27.8
Biofuel 183.64 183.64
Total 182.6 483.6 183.6 849.9
If this is delivered, it will also generate significant economic impacts across a range of sectors. These
are summarised in the following tables.
1 This does not take account of the investment that will be required in the production of energy crops etc.The Economic Benefits of the Development of
Bioenergy in Ireland
Table 4.2 : Summary of Investment in Bioenergy Infrastructure and Annual Spend in 2020
Investment (€ million) Investment (€ million) O&M
Expenditure
Total Cumulative Installed Capacity by 2012-2020 Total
2020
Total Domestic Imports Total Domestic Imports Annual €
million
Biomass (heat) 373 203.1 169.7 276.4 150.4 126.0 130.2
CHP 325 227.4 97.5 285.9 200.1 85.8 82.0
Co-Firing 5 5 0 5 5 0 15.5
WtE 515 206 309 375 150 225 17
AD/Biomethane 332 166 166 332 166 166 23.3
LFG 60 30 30 10 5 5 2.8
MSG 12 6 6 0 0 0 0.6
Biofuels 246 171.85 73.65 198.9 139.2 59.7 155.7
Total 1,867 1,015.35 851.85 1,483.2 815.7 627.2 427.1
As indicated in Table 4.2, total investment in bioenergy infrastructure could reach almost €1.5 billion
(2011 money) over the period from now to 2020, of which approximately 55% is expected to be spent
in the Irish economy (the balance being imported plant and equipment).
In addition, once fully operational, it is estimated that some almost €430 million (2011 money) would
need to be spent annually on operating these facilities.
In terms of employment, (Table 4.3) it is estimated that almost 8,300 work years would be generated
throughout the domestic economy during the construction and installation of the various facilities
required to deliver the targets. Again, the focus is on the potential impact on employment associated
with investment in the sector over the period from 2012 to 2020. It also only focuses on the impact of
capital investment in the domestic economy only.
Permanent ongoing employment generated by the sector would grow to over 3,600 FTEs by 2020.
This includes employment in the facilities themselves, in supply industries and in the wider economy.
These figures record the net or incremental employment impacts across the different sectors. In
some instances, for examples, the net impacts may be relatively modest as they are simply displacing
the employment associated with existing activities.The Economic Benefits of the Development of
Bioenergy in Ireland
Table 4. 3: Summary of Employment Impacts – Temporary and Permanent
Employment Employment
Construction and Installation – Operations – Permanent
Temporary Full Time Equivalents
Work Years 2012-2020
Direct Indirect Induced Total Direct Indirect Induced Total
Biomass (heat) 100 43 57 200 162 236 191 589
CHP 1,137 464 640 2,242 187 268 228 683
Co-Firing 29 11 16 56 0 185 93 278
WtE 855 345 480 1,680 110 165 431 706
AD/Biomethane 1,250 504 702 2,456 204 165 368 737
LFG 37.5 15.5 21 74 36 25 95 156
MSG 0 0 0 0 13 9 35 57
Biofuels 791 323 445 1,559 147 118 135 400
Total 4,200 1,705 2,361 8,267 859 1,171 1,576 3,606
Tables 4.4 and 4.5 outline what these economic impacts mean in terms of energy output (kTOE). The
figures for co-firing have not been shown as the net or incremental economic impacts were found to
be relatively minor as a result of substituting biomass for peat).
As can be seen, there are significant differences in both the investment and labour intensity between
the different fuel types. Again it is important to note that the figures presented in this report focus on
the “incremental” or additional impacts of the bioenergy sectors and therefore, where biomass is
replacing existing fuels, the impacts will be reduced. In contrast, in the case of Waste to Energy, the
full costs of constructing and operating the two WtE facilities, as well as the full employment impacts
have been taken into account, even though energy production from biomass is only part of the plants
overall function.
Table 4.4 : Investment and Annual Spending Multipliers
Total Cumulative O&M Spending
Investment in Installed
Capacity
€ 000 Per ktoe €000 Per ktoe
Output Output
Per annum Per Annum
Biomass (heat) 1,099 384
CHP 2,347 592
WtE 8,972 296
AD/Biomethane 4,433 311
LFG 4,348 203
MSG 2,308 115
Biofuels 1,337 848The Economic Benefits of the Development of
Bioenergy in Ireland
Table 4.5 : Employment Multipliers by Category
Construction Employment O&M Employment - Permanent
/Installation– Temporary Work Years
2012-2020
Per ktoe annual Per €mn invested Per ktoe annual Per €mn invested
Output (2012-2020) Output (Cumulative
Installed Capacity)
Biomass (heat) 0.6 0.7 1.7 1.6
CHP 16.2 7.8 4.9 2.1
WtE 29.3 4.5 12.3 1.4
AD/Biomethane 32.8 7.4 9.8 2.2
LFG 5.4 7.4 11.3 2.6
MSG 11.0 4.8
Biofuels 8.5 7.8 2.2 1.6
Impact on the Rural Economy
A very significant proportion of the employment generated in the both the construction and operations
of the bioenergy sector will be in rural Ireland. Most of the facilities themselves will be based in rural
areas, and most of the feedstock will be grown or produced there. Indeed, with the exception of the
WtE facilities and some of the LFG and sewage gas facilities, the vast majority of the employment
impacts will be in rural areas. This will in turn make a significant contribution to sustaining rural
communities.
As highlighted by the Irish Farmers Association (IFA) in their policy document on Ireland’s Land-
2
based Renewables Strategy the development of the bioenergy sector offers major opportunities for
Ireland’s agricultural community. Agricultural crops, as well as farm by-products such as animal
manures, have the potential to become a valuable and reliable source of energy. These in turn will
allow farmers to reduce their energy costs and generate income from the sale of biomass products or
from selling electricity or gas to the national grid. The renewable energy sector can offer farmers new
business opportunities and provide alternatives to traditional farming activities. Revenue generated
from renewable energy on the farm can help to sustain farm incomes and, because the majority of
this income will be spent locally, will help to maintain income and employment within the wider rural
community. As the bioenergy sector becomes more established, new opportunities will emerge in the
supply chain which will help to create employment opportunities in harvesting, processing,
transportation, and installation and maintenance.
Moreover, while an analysis of the spatial distribution impacts of the development of the bioenergy
sector is outside the scope of the current study, it is clear given the location of forestry resources and
the potential location of energy crop production that the development of the sector could also
contribute to delivering more balanced regional economic development.
Impact on Fuel Imports and Balance of Payments
2 IFA, Ireland’s Land Based Renewables Strategy, April 2011.The Economic Benefits of the Development of
Bioenergy in Ireland
Security of energy supply is a critically important economic issue for an island nation such as Ireland.
This has been noted consistently by the National Competitiveness Council (NCC) in its annual reports
on Ireland’s competitiveness. In the latest report the NCC again pointed to the fact that since the mid-
1990s energy import dependence has grown significantly in Ireland, due to an increase in energy use
and a decline in indigenous natural gas and peat production.
Ireland’s overall import dependency now stands at 90% - which compares unfavourably with the EU-
3
15 average of 56%. The report also points to the fact that Ireland’s share of energy derived from
4
renewable resources, while growing quickly, is still only half the OECD average.
While the global recession has slowed down the growth in world demand for oil, upward pressure on
5
prices is expected to continue. Indeed, the ESRI in its Review of Irish Energy Policy notes that
“there is little prospect of a return to low oil prices in the immediate future and further upward
pressure on prices can be expected in the face of a prolonged world recovery. Temporary
shocks, such as the current unrest in the Middle East, can also put prices under pressure”.
This exposes Ireland to a major risk of disruption which would significantly damage domestic
economic activity. While some progress has been achieved in relation to the development of
alternative renewable energy resources, to date this has focused heavily on the development of on-
shore wind, which is unpredictable relative to bioenergy. The production of bioenergy using a range of
technologies and exploiting Ireland’s extensive indigenous resources, therefore, offers the opportunity
to address import dependency and also to protect against volatile international oil and gas prices.
Moreover, Ireland is legally obliged to meet the targets under the Renewable Energy Directive.
Without the development of the sector, and an appropriate supply-base, Ireland will be forced to rely
on imported bioenergy to meet the 2020 targets. Teagasc has warned that the price of imported
bioenergy products is likely to increase substantially as 2020 approaches and many Member States
compete for material to meet their targets. In addition, they point to the fact that imports will largely
have to come from outside the EU, in which case sustainability, security of supply and fluctuating
prices are likely to be recurring issues.
The development of an indigenous bioenergy sector and supply base will help to address these
concerns and provide greater security of supply of energy to the Irish economy. The economic benefit
of this is difficult to measure, since it relates to the risk of something occurring or not occurring, the
probability of which is uncertain. However, there is an economic impact if Ireland fails to meet the
terms of the Renewable Energy Directive. The European Court of Justice can impose a range of fines
6
on Ireland that can be as high as €40 million per annum plus a lump sum fine (minimum €1.5 million) .
In addition, by substituting imports it will help to improve the country’s balance of payment position.
Ireland currently spends some €6.5 billion a year on imported gas, oil and coal. The scenario outlined
in this report indicates that the bioenergy sector has the potential to contribute the equivalent of 850
ktoe a year by 2020. On the basis that all of this is domestically produced and is fully utilised, at
3
National Competitiveness Council: Annual Competitiveness Report 2010.
http://www.competitiveness.ie/publications/featuredpublications/title,7075,en.php
4
In addition, Ireland is among the highest carbon emitters in the OECD on a per capita basis, driven by
significant increases in transport emissions over the last two decades.
5
http://www.esri.ie/UserFiles/publications/RS21.pdf
6
The annual figure of €40 million would apply for a serious breach of community law that had persisted for at
least 2 ½ years subsequent to a European Court of Justice judgement.
http://ec.europa.eu/eu_law/docs/docs_infringements/sec_2010_923_en.pdfThe Economic Benefits of the Development of
Bioenergy in Ireland
7
today’s prices, this would lead to a reduction in Ireland’s import bill of €488 million a year . That is,
Ireland’s energy import bill would be reduced by approximately 7.5%.
Competitiveness
The manifold competitiveness challenges facing the Irish economy are, as stated above, highlighted
in the annual report of the National Competitiveness Council.
Particular issues exist with respect to energy. The ESRI’s report on Irish Energy Policy notes that,
against the backdrop of prolonged sluggishness in world economic growth, intense pressure is being
put on the competitiveness of the Irish economy:
“Economic recovery requires a substantial reduction in the domestic price level relative to that
of competitors. This enhances the need for policy to minimise the cost of energy for the
8
economy.”
The degree to which the bioenergy sector can contribute directly to Ireland’s competiveness will
depend in large part on the relative cost of producing bioenergy from the various sources, compared
to the alternative of continuing to import conventional fossil fuels or of importing biofuels.
While it would appear that, at least in the short-run, the cost of generating electricity from bioenergy
sources will need to be supported under the REFIT regime, usage of bioenergy for heating could
9
reduce costs substantially for many Irish businesses (and Irish households). The following table, for
example, shows the relative cost of energy from different fuel types for commercial and industrial
10
users. These figures are taken from the SEAI’s regular publication “Fuel Cost Comparison” and
serve to illustrate the potential cost reduction that could be achieved for some commercial and
industrial users from a switch from conventional fuels to biomass.
7
On the basis that, at the margin, all replaced fuel is imported. One tonne of crude oil equals 7.3 barrels of oil.
th
Closing spot price for Brent Crude on 28 September 2011 is USD106.74 (Bloomberg), while the spot exchange
th
rate to Euros on 28 September 2011 is 1.3631 (European Central Bank
http://www.ecb.int/stats/exchange/eurofxref/html/index.en.html).
852 x 1,000 x 7.3 x 106.74 ÷ 1.3631 = €487.8 million.
8
ESRI: Op cit.
9
The REFIT scheme is funded through the Public Service Obligation (PSO) charged to all electricity consumers.
The Commission for Energy Regulation (‘CER’) calculates and certifies the costs associated with the PSO,
including each of the relevant PSO schemes, and sets the associated levy for the required period. See for
example, http://www.cer.ie/en/renewables-current-consultations.aspx?article=15340173-5b39-4c82-bb93-
a123dd3245fc
Information on the potential impact of the biofuels obligation scheme can also be found at
http://www.dcenr.gov.ie/NR/rdonlyres/771EE392-06E0-4B59-888D-
E160FF10CD4B/0/EnergyBiofuelObligationandMiscellaneousProvisionsBill2010RIA.pdf
10
http://www.seai.ie/Publications/Statistics_Publications/Fuel_Cost_Comparison/The Economic Benefits of the Development of
Bioenergy in Ireland
Table: 4.6: Comparison of Energy Costs: Commercial/Industrial Fuels (July 2011)
Fuel Form Delivered Energy Cost
Cent/kWh
Coal Industrial Fines 0.71
Oil (inc. Carbon tax) Gas Oil 9.16
Light Fuel Oil 8.31
Medium Fuel Oil 8.09
Heavy Fuel Oil 7.83
LPG (inc. Carbon tax) Commercial Cylinders 13.95
Bulk LPG (0-3 tonnes) 11.33
Bulk LPG (3.1-40 tonnes) 10.33
Natural Gas (inc. Carbon Band I1 =1000=10,000=100,000The Economic Benefits of the Development of
Bioenergy in Ireland
sets out the calculations. We estimate that the achievement of the targets will result in a saving of
3.14 million tonnes of CO2 per annum by 2020 and Table 4.7 below summarises the CO2 reduction by
category. This represents roughly 5% of total GHG emissions in 2009, and will represent a very
significant contribution to the required reduction in GHG emissions to be achieved by 2020, under
Ireland’s international commitments.
Table 4.7 : CO2 Avoided by Category (Per Annum)
CO2 Avoided Fuels replaced
‘000 Tonnes
Biomass (heat) 1,254.9 Heating Oil (gasoil)
CHP 511.7 Heating Oil (gasoil)/Natural Gas
Co-Firing 138.3 Peat
WtE 212.4 Natural Gas
AD/Biomethane 276.9 Heating Oil (gasoil)/Natural Gas
LFG 50.9 Natural Gas
MSG 19.1 Natural Gas
Biofuels 679.2 Petrol/Diesel
Total 3,143.4
One can place an economic value on this reduction in emissions by reference to the carbon tax
avoided. The carbon tax in Ireland as of Budget 2012 is €20/tonne. At this rate, the value of the
13
emission reduction would be €63 million per annum . The Government’s National Recovery Plan
14
2011-2014, published with Budget 2011 , envisages the carbon tax doubling to €30/tonne by 2014.
This would increase the value of the GHG emission avoided to would increase this value to €94
million per annum.
Other Economic Impacts
As demonstrated above, the development of the bioenergy sector in Ireland has the potential to
support significant spending and employment creation in the domestic economy. Nevertheless, a
significant proportion of this expenditure - mainly in terms of capital investment - is expected to be
incurred on imported equipment and professional services.
There is, therefore, the potential for Ireland to secure an even greater share of the economic benefits
through the development of a local supply base. The development of the sector could also offer an
opportunity for the development and testing of new technologies, processes and skills, which could, in
turn, be used to develop an export-focussed industry, as has happened in other countries. This will be
dependent however on the growth of a critical mass of local activity in the bioenergy sector, as is
envisaged under the baseline scenario presented here.
The expectation under the baseline scenario is also that significant amounts of bioenergy will need to
be imported to reach the required targets. Clearly, if this could be substituted by domestic production,
further economic opportunities and benefits would accrue to Ireland.
13 Note that the proportion of this saving that relates to heat only biomass is already included in the economic
saving calculated under the Competitiveness heading above.
14
http://www.budget.gov.ie/The%20National%20Recovery%20Plan%202011-2014.pdfThe Economic Benefits of the Development of Bioenergy in Ireland
Table 4.8: GHG Emissions Avoided 2020
Based on Final Energy Demand (note 2) Based on Primary Energy Demand (note 2)
RES-E RES-H Res-T Total %age Total Total GHG Total GHG
kTOE kTOE kTOE KTOE split GWh GWh Emissions Emissions
Tonnes per Avoided ‘000
GWh Tonnes
Total Biomass energy output 181 484 184 850 9,882 11,999
Fuel Replaced
Natural Gas 145 26 171 20.1% 1,987 3,368 206 692.5
Heating Oil (gasoil) 458 458 53.9% 5,325 5,325 264 1,405.4
Diesel 118 118 13.8% 1,367 1,367 264 360.7
Petrol 66 66 7.8% 769 769 252 193.6
Peat 37 37 4.4% 435 1,170 420 491.3
Total 181 484 184 850 100.0% 9,882 11,999 3,143.4
%age of total 21.5% 56.9% 21.6% 100.0%
Notes:
1. Heat from municipal sewage AD and Waste to Energy is assumed to replace natural gas. All other heat energy is assumed to replace heating oil. All
electricity with the exception of peat co-firing is assumed to replace natural gas, as the marginal fuel source in the powergen system.
2. Final energy demand is the total GWh of output or useful energy, while primary energy demand relates to the input energy. This relates specifically to
electricity, whereby energy is lost in the conversion of primary fuels to electricity, depending on the conversion efficiency. Displaced natural gas and peat
in electricity production are assumed to have conversion efficiencies of 55% and 37.2% respectively.
Sources:
http://cmt.epa.ie/Global/CMT/emission_factor_sources.pdf
http://erc.epa.ie/safer/downloadCheck.jsp?isoID=21&rID=10174&atID=2268
15The Economic Benefits from the Development of BioEnergy in Ireland to meet 2020 Targets Published by the Irish BioEnergy Association | February 2012 | www.irbea.ie Promoting anaerobic digestion, wood fuels, biofuel and biomass since 1999
You can also read