ENERGY RESOLUTION AND ENERGY-LIGHT RESPONSE OF CSI(TL) SCINTILLATORS FOR CHARGED PARTICLE DETECTION
←
→
Page content transcription
If your browser does not render page correctly, please read the page content below
Energy resolution and energy-light response of CsI(Tl) scintillators
                             for charged particle detection
    A. Wagnera1, W.P. Tan1, K. Chalut1, R.J. Charity3, B. Davin2, Y. Larochellec2, M.D.
       Lennek1, T.X. Liu1, X.D. Liu1, W.G. Lynch1, A.M. Ramos1, R. Shomin1, L.G.
               Sobotka3, R.T. de Souza2, M.B. Tsang1, G. Verde1, H.S. Xu1
1
  National Superconducting Cyclotron Laboratory and Department of Physics and Astronomy, Michigan
State University, East Lansing, MI 48824, USA.
2
  Department of Chemistry and IUCF, Indiana University, Bloomington, IN 47405, USA.
3
  Department of Chemistry, Washington University, St. Louis, MO 63130, USA.

Abstract:
          This article describes the crystal selection and quality control utilized to
develop and calibrate a high resolution array of CsI(Tl) scintillator crystals for
the detection of energetic charged particles. Alpha sources are used to test the
light output variation due to thallium doping gradients. Selection of crystals with
better than 1% non-uniformity in light output is accomplished using this method.
Tests with a 240 MeV alpha beam reveal that local light output variations within
each of the tested CsI(Tl) crystals limit the resolution to about 0.5%. Charge and
mass dependences in the energy - light output relationship are determined by
calibrating with energetic projectile fragmentation beams.

PACS: 29.40.Mc, 29.40.-n, 29.30.Ep

a
  Present address: Institut für Kern- und Hadronenphysik, Forschungszentrum Rossendorf, D-01314
Dresden, Germany
c
  Present address: Laboratoire de Physique Nucléaire, Université Laval, Canada, G1K-7P4.

                                                   1
Introduction:
CsI(Tl) scintillation detectors are a cost effective technology for detecting
charged particles with energies of E/A=30-200 MeV[1-11]. Less expensive than
solid state detectors, less hygroscopic than NaI(Tl) crystals, and easily machined
into different shapes, CsI(Tl) crystals have been incorporated in many large solid
angle detection arrays [1-11]. In such applications, greater stability is achieved by
avoiding problems related to the temperature dependence [12] of the CsI(Tl)
light output by holding the temperature constant, and by reading out the
detectors via photodiodes instead of photomultipliers, whose gains may vary
with time. In the present article, discussion will be focused upon properties of
CsI(Tl) crystals read out by photodiodes.
Energy resolution is an essential requirement of many experiments. For
low energy particles, the energy resolutions of crystals, read out by photodiodes,
are mainly limited by electronic noise. The importance of this noise depends on
the light collection efficiency of the crystal-diode assembly and on the
photodiode capacitance. For example, a resolution of 4.4% (59 keV) FWHM was
reported [14] for the detection of 1.33 MeV γ rays in a small crystal (3 cm ) with a
3
small (1 cm2) photodiode [14]. Somewhat worse energy resolution 25% (165 keV)
FWHM was achieved for the detection of 0.66 MeV γ rays in a much larger 100
cm3 CsI crystal [2] with a larger (2x2 cm2) photodiode [2].
With increasing energy deposition, photon statistics makes an increasing
contribution to the resolution that can be approximated by δE = E ⋅ E0 where E
is particle energy and E0 is the typical energy per photoelectron-hole pair. This
latter constant depends on Thalium doping, the light collection of the detector
assembly and the quantum efficiency of the photodiode. For reasonable values
for E0 of about 70 eV, photon statistics provides a 84 keV contribution to overall
energy resolution for particles with E ≈ 100 MeV. If other factors did not
contribute significantly to the resolution, one might expect to achieve resolutions
2of about several hundred keV in CsI(Tl), which would reduce the incentives to
utilize more expensive solid state detector technologies in high resolution
experiments.
Unfortunately, the resolutions achieved for higher energy particles are
larger than one might expect from noise and photon statistics. For example,
energy resolutions of 1.2% (1.2 MeV) FWHM were achieved for 98 MeV α
particles with small (1 cm3) crystals [13]. Energy resolutions of 0.8% (740 keV)
FWHM were achieved for 92 MeV α particles with larger (100 cm3) CsI crystals
[2]. In the latter measurements, the resolutions were comparable to the measured
variations in the light output over the volume of the crystals, suggesting that the
light output uniformity of the CsI(Tl) scintillator may be a limiting factor in the
energy resolution.
As discussed in this article and earlier studies [1,2], reasonably uniform
CsI(Tl) crystals can be obtained commercially. Testing and pre-selecting crystals
before construction can further improve the overall quality of the crystals. We
explore whether this is sufficient to achieve resolutions that are limited by noise
and photon statistics and find local non-uniformities in the light output that
prevent optimum crystal performance. We also investigate the non-linear mass
and charge dependence of the light output of the crystals, which is another factor
complicating the use of CsI(Tl) crystals for the detection of charged particles. We
find that these dependencies can be constrained by careful energy calibration
using beams of different isotopes.
Preselection of CsI(Tl) crystals for Light Output Uniformity:
Typically, commercial CsI(Tl) crystals can manifest non-uniformities in the
light output across the detector face on the order of one percent per centimeter
[1,2]. To a large extent this non-uniformity can be limited to better than 0.3% per
centimeter by controlling the manufacturing process and by scanning the CsI(Tl)
crystals and rejecting those that do not meet this criterion[1,2]. The influence of
this small (combining the CsI(Tl) scintillator with a position sensitive silicon detector. This
effect can then be removed by making position dependent corrections to the light
output.
The magnitude of the observed non-uniformity is influenced by both the
choices of radioactive source and readout scheme [2]. Unlike the energy
deposition of an alpha particle which is relatively localized, the energy
deposition of a gamma ray samples a larger volume of the crystal and hence the
sensitivity to measuring local uniformities is reduced [2]. Photodiodes are more
sensitive than phototubes to the stronger light output variations manifested by
the longer wavelength scintillation photons [15]. In this section, we describe the
pre-selection procedure which involved scanning with a collimated α source and
reading out the CsI(Tl) crystal with a silicon photodiode as described in Ref. [2].
As delivered by the manufacturer [16], the crystals were rectangular in
shape with dimensions of 3.5 x 3.5 x 6 cm3. They were polished on one 3.5 x 3.5
cm2 surface (here labeled as the front) and sanded at the 3.5 x 6 cm2 sides. Before
scanning, the crystals were inspected for visual cracks or imperfections. Then the
remaining 3.5 x 3.5 cm2 surface (here labeled as the back) was sanded down and
polished. It was then optically coupled to a clear 1x3.5x3.5 cm3 acrylic light guide
with optical grease. This light guide was in turn optically connected to a 2 x 2 cm2
photo-diode [17]. The sides of the crystals and the light guide were wrapped
with two layers of 0.1 mm thick white Teflon tape. The front face of the crystal
2
was covered with an aluminized mylar foil (0.17 mg/cm ) to ensure uniform
light collection.
The 5.486 MeV α-particles from a collimated Am α-source were used to
241
irradiate the front face of the crystal and monitor the uniformity in the light
output of the crystals. The collimators were selected so as to illuminate circular
regions of 5mm diameter on the front surface of the detector. The alpha spectra
were recorded with a multichannel analyzer equipped with a peak sensing ADC.
The spectra were then transferred to a computer and analyzed offline. Figure 1
4shows the scanning results of two crystals, #652 that was accepted (top panel)
and #291 that was rejected (bottom panel). The peak location of the 5.486 MeV α-
line was detected in vacuum at nine equally spaced positions on the crystal face.
The scanned position corresponded to the center of each of the nine sub-squares
in Figure 1.
The different gray levels of the big squares correspond to the percentage
deviations of the alpha peak of each point from the median value. The actual
deviations are recorded (in percent) in the small 3x3 table next to the shaded
crystal face. The accepted crystal (top panel) is nearly uniform in the shading,
varying in light output from –0.11% to 0.05% of the mean. On the other hand, the
rejected crystal (bottom panel) clearly shows the existence of a gradient in the
light output non-uniformity from left to right. The total variations in light output
deviate by nearly ±1% from the mean. Selected crystals were also scanned on the
back surface of the crystal. The light output variations displayed by the front and
back surfaces were consistent with the component of the thallium doping
gradient parallel to the front and back surfaces being approximately uniform
throughout the crystal, as observed in Ref. [1,2]. No information was obtained
on the doping gradient perpendicular to the front and back surfaces since the
influence of that gradient can be addressed by adjustments to the energy- light
output relationship.
Crystals with deviations larger than ±0.5% such as the one shown on the
bottom panel of Fig. 1 were rejected and sent back to the manufacturer. Crystals
with deviations less than ±0.5% were accepted and subsequently machined to
their final shapes. This machining step only involves two adjacent sides, which
were tapered on an angle of about 7° relative to the normal to the surface of the
crystal. This tapering enabled the crystals to form an array of four crystals as
shown in Figure 2. Such design allows the crystals to be placed, during
subsequent experiment, behind a 5 x 5 cm silicon detector forming a ∆E-E
2
telescope that could be closely packed with other telescopes of similar
5construction at a distance of 20 cm from the target. Consistent with this
requirement, the front surface of each CsI(Tl) crystal was reduced to an area of
2.5 x 2.5 cm2 ; the back surface was not modified. The crystals were then polished
and scanned one more time. In general, the differences between the results of the
initial and final scans were negligible.
Wrapping materials used for the CsI(Tl) crystals:
To obtain optimal light collection efficiency for low energy particles [2], a
reflective entrance foil was needed on the front face of a CsI(Tl) crystal [2].
Following ref. [2], the sides of the crystal are uniformly sanded with 400-grit
wet/dry sand paper using motions parallel to the long axis of the crystal. Several
wrapping materials and techniques were tested to see what provided the most
suitable diffuse reflecting surface. In one test, the sides of the CsI(Tl) crystals
were wrapped, following refs. [1,2], with several layers of 0.1mm thick Teflon
tape to minimize light loss and cross-talk between crystals. The upper panel of
Fig. 3 shows the signal amplitude (in channels) and the bottom panel shows the
resolution (in percent) of 5.486 MeV α particles from a collimated 241Am α-source
as a function of the number of layers of Teflon tape used to wrap the crystal. In
general, increasing the number of layers of Teflon tape increases the light
collection efficiency resulting in larger signal amplitudes (higher peak channels).
The improvement saturates at about five layers of Teflon tape. The increase in
the percent resolution of the crystal is directly related to the increased light
output. For these small signals, the resolution (in channels) is dictated by the
electronic noise and is unchanged at about 40 channels (~250 keV) FWHM
throughout the test. (This is equivalent to a γ-ray energy resolution of about 160
keV.)
Five layers of Teflon tape cause a rather thick gap between adjacent
CsI(Tl) crystals. Particles impinging on this gap are lost resulting in a loss of
detection efficiency. To reduce this gap, we tested the optical properties of 0.14
mm thick cellulose Nitrate membrane with pore size of 0.2 µm [18]. (Cellulose
6nitrate achieves its high reflectivity by virtue of the many micropores in the
material. Care must be taken not to wet the surfaces of this material or the
reflectivity will be reduced.) As shown by the solid points in Fig. 3, significantly
improved light collection efficiency and energy resolution are thereby obtained.
For this material, the light output saturated at two layers of cellulose
nitrate membranes. Nearly equivalent light output was observed in a wrapping
consisting of one layer of cellulose nitrate plus one layer of aluminized mylar. In
the final wrapping, each crystal is wrapped with two layers of cellulose nitrate
on the outer two surfaces and one layer on the inner surfaces. One layer of
aluminized mylar was inserted between adjacent crystals to improve optical
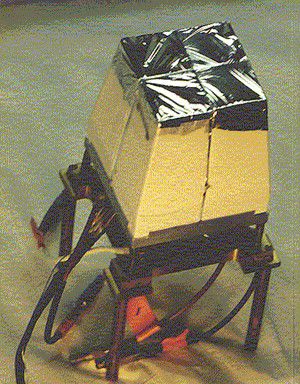
isolation. A robust wrapping for 4 crystals assembly is shown in Figure 2.
For the tests with accelerator beams, photodiodes were glued to the light
guides with Silicon RTV615. To prevent light leak and cross talk between
neighbor crystals, the back face, light guide and the photodiode were painted
with a reflective white paint (BC620) from Bicron [19]. The electronic signals
from the photodiodes are amplified with charge-sensitive preamplifiers that
were connected to the detector using short (6 cm) cables and situated inside the
vacuum chamber. The amplified signals are then shaped and amplified by a
computer-controlled 16-channel CAMAC shaping amplifier module [20], with a
unipolar pulse of 2 µsec shaping time and analyzed by a peak-sensing ADC
(Phillips P/S 7184 [21]). The stability of the setup is continuously monitored via a
precision pulse generator system and via temperature sensors attached to the
detector mounts within the vacuum system.
Position Dependence of the Energy resolution
To measure the energy response of the crystals for energetic beams, 240
MeV α particles extracted from the NSCL K1200 cyclotron were injected directly
into the CsI(Tl) crystals. Because 1% light output non-uniformities are equivalent
to a 2.4 MeV variation in the α particle energies, it was necessary to determine
the point of interaction in the detector for each α particle and make corrections to
7the resulting light output variation. To search for and identify any position
dependence in the crystals light output, the position information of each α
particle was measured by passing the α’s through a 500µm 2 dimensional
position sensitive silicon detector (Micron design W [22]) placed in front of the
CsI(Tl) crystals.
The double-sided Si-strip detector has 16 strips in the x- and 16 strips in
the y-direction. These strips provide 256 co-ordination points (pixels). As the
front face of the CsI(Tl) crystal is one-quarter the surface area of the Si-strip
detector, 64 measurements of the light output were obtained as a function of
position for each crystal.
The right panel of Fig. 4 shows the variations in percent of the light output
measured at each of the 64 pixels of crystal #655 for the 240 MeV 4He beam. This
crystal is chosen for display here since it was illuminated very uniformly by the
α beam. Other crystals also display similar trends. This crystal has approximately
the same overall uniformity as crystal #652 shown in Fig. 1. Here, however, the
sensitivity of the shading levels has been increased enabling the small overall
deviations measured in this crystal to be easily observed. The corresponding α
source scanning measurements are shown in the left panel. In contrast to the α
source measurements that display rather smooth variations, the α beam
measurement show significant local variations in the light output, of the order of
0.5%. Some of the local variations are larger than the average change that one
observes in the light output from one side of the detector to the other.
This average trend appears to be approximately the same in both α source
and α beam measurements. (The dotted lines in the left side for the α source
designate the outlines of the front face of the crystal after it was machined to its
final shape for the α beam measurements.) To show that these variations are not
an experimental artifact and that they are indicative of real variations in the light
output of the crystal, the upper and lower panels of Fig. 5 shows energy spectra
obtained for pixels along column “2” and row “e” as labeled in the right panel of
8Fig. 4, respectively. The exact coordinates of the pixels are labeled inside each
panel of the figures. Neighboring pixels correspond to trajectories that are on the
average, separated by 3 mm at the front face of the CsI(Tl) crystal. To provide a
fixed reference point, the average peak position of the alpha particles detected by
the whole crystal is marked by a dashed line (Channel 1315) in each panel. Since
different pixels are exposed to different number of particles, the counts in the
peak of each pixel are normalized to 1. For clarity, only the statistical error bars
of the peaks are indicated. Clearly, there are shifts in these individual spectra,
going from one pixel to another, that exceed the resolution of the spectra.
Moreover, the trends were not monotonically varying from one direction to
another. While the light output near the edge of the crystals (in the extreme left
and right panels of Fig. 5) may be sensitive to imperfections in the surface
treatment in the crystal, variations in the light output elsewhere must be
correlated to local light output variations in the crystal. We speculate that these
variations arise from local variations in the thallium doping introduced during
the crystal growing. We cannot exclude, however, that these variations could be
the result of local impurities that could vary with position on the scale of 3 mm.
In either case, one might expect equivalent variations in the light output along
the unobserved longitudinal axis of the crystal. Thus one might expect the local
variations in the light output to be different for different energy particles,
reflecting their different ranges.
The bottom panel of Fig. 6 shows the energy spectra for the 240 MeV 4He
beam particles detected with CsI crystal #655 without selection on position. The
energy resolution is about 1.54 MeV (0.65%). Several attempts can be made to
improve this resolution. First, one can correct the light output for the average
trend. This was accomplished by fitting the light output with a 3 parameter
function L=L0(1+ax)(1+bx). The spectra are then corrected for each pixel by the
relation
Ch
Ch’= . (1)
(1 + ax) ⋅ (1 + bx)
9After making this correction and summing the data from all pixels into
one spectrum, there is a slight improvement in the resolution, from 0.65% to
0.59% (1.41 MeV). This corrected spectrum is shown in the middle panel.
Alternatively, one can correct the energy-light output pixel by pixel by correcting
the energies of particles in one pixel by the ratio of the average energy in that
pixel divided by the average energy in the entire crystal. When this was done,
the resolution improves dramatically as shown in the top panel, to 0.45% or 1.08
MeV, about twice the noise width of 500 keV. In comparison, the peaks
corresponding to the single pixel spectra as shown in Figure 5, have a resolution
of 1.04 MeV, nearly the same as the overall resolution obtained after summing up
all the single spectra. Since the typical beam energy width is better than 0.1%, the
resolution of 0.45% probably represents the upper limit of the resolution of the
crystals. Unfortunately, the possible depth dependence of the light output
variation excludes the possibility to generalize such corrections to all particles
emitted in nuclear reactions.
Energy calibration:
The fluorescent light emitted by the CsI(Tl) crystal has two major decay
time constants, a fast (~500 ns) and a slow (~7 µs) component. Both components
have a light output – energy relationship that is mass and charge dependent.
This property has been exploited to provide mass identification for light ions
using pulse-shape discrimination [1, 3-11]. The pulse-shape discrimination
capability of CsI(Tl) is not needed if one uses the CsI crystals as the stopping
detectors in ∆E-E telescopes where Si detectors are used as ∆E detectors.
However, the pulse shape dependence on mass remains important because of the
influence it has on the energy calibration.
The temporal decay of the CsI(Tl) light output depends on the ionization
density, therefore, the charge, mass and energy, of the detected particles [13, 24-
29]. At low energy, the light response (L) of a CsI(Tl) crystal is known to show a
non- linear correlation with the deposited energy (E), especially for heavy ions,
10and a dependence of such correlation on both the charge Z and mass A of the
detected particle [24]. It also depends on the Tl doping of the crystal.
To determine the energy calibration for different ions, the detectors were
directly exposed to low intensity (1000 particles/sec) beams of different isotopes
and energies. These ions were obtained by fragmenting 2160 MeV 36Ar and 960
16
MeV O primary beams from the NSCL K1200 cyclotron in the A1200 fragment
separator [30]. The main advantage of this method is the availability of a large
number of particles that could be detected simultaneously (up to 52 isotopes
were identified in the case of the 36Ar fragmentation). Since particles are selected
36
only by their magnetic rigidity (B*ρ= 1.841 Tm for the Ar beam and B*ρ=1.295
16
Tm for the O beam) one obtains a broad range of different isotopes and
energies. The FWHM of the momentum widths for these particles were selected
to be 0.5%. The atomic and mass numbers as well as energies of the particles
used to calibrate the CsI crystals in the present work are listed in Table I.
Hydrogen and helium isotopes were also calibrated by elastic scattering of
E/A=30 MeV p-4He molecular beams on a Au target and by 240 MeV direct 4He
beam particles. The energy calibration for each isotope was done following the
mass and charge dependence of the light output described in ref. [24], which in
turn was based on previous studies of the light emission of CsI-crystals and on
semi-empirical model proposed by Birks [29]. In this approach, the incident
particle energy E is parameterized as a function of the light output L, the charge
Z, and the mass A of the particle, as
E ( L, Z , A) = aAZ 2 L + b ⋅ (1 + cAZ 2 ) ⋅ L1−d ⋅ A⋅Z 2
(2)
where a, b, c and d are the fitting parameters with values greater than zero. This
expression describes a linear part, dominating at high energies and an
exponential part dominating at low energies.
In Fig. 7, the solid and dashed lines represent the best fit of Eq. 2 to the
experimental energy calibration data corresponding to different carbon isotopes
(A=11-14). The need for a mass dependence can be demonstrated by examining
11the light output of the higher energy carbon isotopes. At high energy, the light
response is expected to be linear. Both the 11C points should lie in the linear
11
domain. However, a straight line joining the two C isotopes does not pass
12 13 14
through the high-energy C, C, and C isotopes. A curve going through all
11-14
points for the C would lead to a very large and unreasonable curvature
compared to calibration procedure adopted elsewhere in the literature. The only
solution is a mass dependent calibration curve. Since several fragmentation
beams would be required to have the full calibration curve for each isotope, we
adopt the mass dependent ansatz (closely related to the quenching effect) of Ref.
[24].
For light charged particles with Z≤3, the parameterization described in Eq.
2 did not accurately describe the detected energies. Compared to the observation
of Ref. [24], a less pronounced isotopic effect was observed for light ions. This
may be the result of the increased concentration of the activator element, Tl, in
the CsI-crystals used in the present study compared to those studied in ref. [24].
2
We find the mass dependence to be over-estimated by the AZ factor in Eq. 2,
and employ a modified function of Eq. 2 with a weaker dependence on A to fit
Z≤3 particles. The expression was modified for each element. For example, for
Lithium (Z=3) particles, the first term of Eq. 2 is changed.
E ( L, Z , A) = a AZ 2 L + b ⋅ (1 + cAZ 2 ) ⋅ L1− d ⋅ A⋅Z
2
(3)
For Helium (Z=2) isotopes, the following expression was used
E=aL+bAc[1-edL], (4)
The variables a, b, c, and d in Eq. 2-4 are fit parameters. There are sufficient
data to reproduce with good accuracy the light-output response for all the
isotopes of the same element using Equations 2-4. Our fitting procedure resulted
in a precision of the energy calibration better than 2% for isotopes from α to O.
As we have only limited calibration points for p, d and t, two calibration
points from each isotope, we adopt the simple linear function for Z=1 particles.
E=aL+b. (5)
12where a, and b are fit parameters.
More accurate energy calibration of Z=1 particles may be obtained in the
future. The present work focuses mainly on heavier elements where a direct
calibration with beam fragments is available.
Summary
In this article we have described the procedures used to construct CsI(Tl)
detectors with good energy resolution. These procedures involve pre-selecting
241
CsI crystals used in the construction of detectors by scanning with an Am alpha
source. Global correction factors were thereby obtained which can compensate
for the energy resolution due to non-uniformity of light output. In addition,
various common wrapping materials are compared in order to obtain a low light
cross-talk between adjacent modules with a minimal amount of material between
them. The choice of cellulose nitrate micropore filter appears to provide a high
reflectivity, much higher than that of white Teflon tape of the same thickness.
Measurements of the resolution with 240 MeV 4He beams that can
penetrate into the interior of the CsI crystal shows energy resolution of the order
of 0.5% can be obtained and suggests that the current CsI crystal manufacturing
process produces local variations in the Tl concentrations that are probably
depth dependent. Unfortunately, such local variations cannot be corrected easily
and they present the major limitations in the energy resolution of the CsI
crystals.
Using fragmentation products ranging from hydrogen to oxygen isotopes
produced in fragmentation beams and direct alpha and proton beam particles,
the relationship between the light response in the CsI crystals and the mass,
charge and energy of the detected particles has been investigated. For heavy
particles with Z≥3, the mass dependence of the light response function of the CsI
crystals cannot be neglected.
13The authors wish to thank the accelerator crew at NSCL for providing
excellent beams from the K1200 cyclotron and especially Dr. Mathias Steiner for
the preparation and delivery of the secondary beams. This work is supported by
the National Science Foundation under Grant No. PHY-95-28844 and
Department of Energy under Grant No. (DOE-92ER-40714).
REFERENCES
[1] R.T. De Souza et al., Nucl. Instr. and Meth. in Phys. Res. A 295 (1990) 109
and references therein.
[2] W.G. Gong et al., Nucl. Instr. and Meth. A268 (1988) 190.
[3] D.W. Stracener et al., Nucl. Instrum. Methods A 294, 485 (1990).
[4] J. Pouthas et al., Nucl. Instr. and Meth. A 357, 418 (1995)
[5] K. Kwiatkowski et al., Nucl. Instr. and Meth. A360, 571 (1995)
[6] R. Laforest et al., Nucl. Instr. and Meth. A404 (1998) 482.
[7] D. Drain et al. Nucl. Instr. and Meth. A 281 (1989) 528.
[8] H.-G. Ortlepp et al.Nucl. Instr. and Meth. A 403 (1998) 65.
[9] Y. Blumenfeld et al, Nucl. Instr. and Meth. A 421 (1999) 471.
[10] D. Fox et al., Nucl. Instr. and Meth. A 374, 63 (1996).
[11] I. Iori et al., Nucl. Instr. and Meth. in Phys. Res. A 325 (1993) 458.
[12] J. D. Valentine et al., Nucl. Instr. and Meth. in Phys. Res. A 325 (1993) 147.
[13] G. Viesti et al., Nucl. Instr. and Meth. in Phys. Res. A 252 (1986) 75.
[14] P. Krutz et al.,.Nucl. Instr. and Meth. in Phys. Res. A260 (1987) 120.
[15] H. Grassman et al., Nucl. Instr. and Meth. in Phys. Res. A 234 (1985) 122
[16] Scionix Holland BV, P.O. Box 143, 3980 CC Bunnik, The Netherlands.
[17] Hamamatsu Photonics K.K., 360 Foothill Rd., Bridgewater, NJ 08807, USA.
[18] Advantec MFS, Inc., 6691 Owens Drive, Pleasanton, CA 94588.
[19] Bicron (Saint-Gobain), 12345 Kinsman Rd., Newbery, OH 44065, USA
[20] Pico Systems, 543 Lindeman Rd., Kirkwood MD 63122.
[21] Phillips Scientific. 150 Hilltop Rd., Ramsey, NJ 07446
[22] Micron Superconductor LTD, 1 Royal Buildings, Marlborough Road,
Lancing, Sussex BN158UN, England
[23] R.S. Storey, W. Jack and A. Ward, Proc. Phys. Soc. 72 (1958) 1.
[24] Y. Larochelle et al., Nucl. Instr. and Meth. in Phys. Res. A 348 (1994) 167.
[25] C. J. W. Twenhoefel et al., Nucl. Instr. and Meth. in Phys. Res. B 51 (1991) 58.
[26] D. Horn et al., Nucl. Instr. and Meth. in Phys. Res. A 320 (1992) 273.
[27] N. Colonna et al., Nucl. Instr. and Meth. in Phys. Res. A 321 (1992) 529.
[28] P.F. Mastinu et al., Nucl. Instr. and Meth. in Phys. Res. A 338 (1994) 419.
[29] J.B. Birks, Proc. Phys. Soc. A 64 (1951) 874.
[30] B.M. Sherrill et al., Nucl. Instr. and Meth. in Phys. Res. B 56/57 (1991) 1106.
14Figure Captions:
Figure 1: Results of alpha source scans for two crystals. The non-uniformity
gradient in Crystal # 652 (top panel) is less than ±0.5% and was accepted.
However, the scanning results for Crystal # 291 (bottom panel) is outside
±0.5% non-uniformity and was rejected.
Figure 2: Photograph of an assembled array of four closely packed CsI crystals.
Figure 3: Dependence of light output and resolution of crystals on wrapping
materials.
Figure 4: Variations in light output from the scanning of 5.486 MeV alpha
particles (left panel) and from 240 MeV 4He particles pixel by pixel (right
panel). The 8x8 pixel shaded area in the right panel corresponds to the
area enclosed by the dashed line in the left panel. Column numbers (1-8)
and row letters (a-h), used to identify each pixel in Figure 5, are marked.
Figure 5: Energy spectra of 240 MeV 4He particles for individual pixels. The
upper panel shows 8 spectra down column “2” and the lower panel
shows 8 spectra across Row “e”. See Figure 4 captions for explanation of
pixel identification.
Figure 6: Energy resolutions for 240 MeV 4He particles detected by the CsI
crystal. The uncorrected energy spectrum is shown in the bottom panel.
It has an energy resolution of about 1.54 MeV (0.65%) FWHM. The
spectrum corrected for an average gradient determined by scanning is
shown in the middle panel. The energy resolution for this spectrum is
0.59% or 1.41 MeV FWHM. The spectrum corrected for local variations
(pixel by pixel) is shown in the top panel. It has an energy resolution of
0.45% or 1.08 MeV FWHM.
11 12 13 14
Figure 7: Calibration curves for C, C, C and C for the CsI (Tl) crystals
obtained using direct fragmentation beams listed in Table I. The curves
are the best fit according to Eq. 2.
15Table I : List of fragmentation products used in the energy calibrations of the
CsI crystals.
16 36
O fragmentation E (MeV) Ar fragmentation E (MeV)
products products
P 77.17
D 39.78 d 79.57
T 26.72 t 53.75
3 3
He 105.0 He 210.00
4 4
He 79.99 He 160.00
6 6
He 53.64 He 107.90
6 6
Li 119.90 Li 240.00
7 7
Li 103.10 Li 206.80
8 8
Li 90.40 Li 181.60
7 7
Be 182.20 Be 363.40
9 9
Be 142.50 Be 285.60
10 10
Be 128.40 Be 257.90
10 10
B 199.90 B 400.00
11 11
B 182.10 B 364.90
12
B 335.40
11 11
C 261.20 C 521.60
12 12
C 239.90 C 480.00
13 13
C 221.80 C 444.40
14
C 413.7
14 14
N 279.90 N 560.00
15
N 524.00
16
N 492.40
15 15
O 340.80 O 680.70
16
O 640.00
1617
O 603.70
18
O 571.30
17+1.0
-0.03 +0.03 +0.14
-0.09 -0.01 +0.05
0.0 -0.11 -0.04 +0.05
Crystal 652
-1.0.
3.5 cm
+1.0
+0.95 -0.05 -0.92
+0.88 -0.01 -0.87
0.0 +0.80 +0.14 -0.91
Crystal 291
-1.0.1 2 3 4 5 6 7 8
+0.55
a
b
c
d
0.0
e
f
g
h -0.38
Crystal 655You can also read