Evaluation of Local Gelation Behavior of Aqueous Methylcellulose Solution Using Quartz Crystal Microbalance+1 Kenji Yamaoka+2, Yoshihisa Fujii+3 ...
←
→
Page content transcription
If your browser does not render page correctly, please read the page content below
Materials Transactions, Vol. 62, No. 5 (2021) pp. 647 to 654
© 2021 The Japan Institute of Metals and Materials
Evaluation of Local Gelation Behavior of Aqueous Methylcellulose Solution Using
Quartz Crystal Microbalance+1
Kenji Yamaoka+2, Yoshihisa Fujii+3 and Naoya Torikai
Department of Chemistry for Materials, Graduate School of Engineering, Mie University, Tsu 514-8507, Japan
The physical gelation of an aqueous methylcellulose (MC) solution in response to temperature change was evaluated using a quartz crystal
microbalance (QCM), which is an extremely sensitive mass balance that measures changes in mass per unit area from nanogram to microgram
level. Then, the potential use of QCM for interfacial selective viscoelasticity measurements was investigated. The viscosity changes
accompanying gelation were observed as resonance frequency shifts. The gelation temperature determined from the temperature dependence of
the resonance frequency shifts showed good agreement with the gelation temperatures obtained by visual inclination observation and rheology
measurements. Furthermore, MC molecules were adsorbed, and the local concentration increased at the interface with hydrophobic quartz units
due to the surface properties. We believe that QCM enables the evaluation of interfacial viscoelasticity.
[doi:10.2320/matertrans.MT-M2020392]
(Received January 14, 2021; Accepted February 9, 2021; Published March 12, 2021)
Keywords: quartz crystal microbalance, interface, viscoelasticity, physical gel, methylcellulose
1. Introductions
Electronic materials, adhesives, lubricants, selectively
permeable membranes, and biomaterials exhibit their
functionality when in contact with different materials.
Therefore, for these polymeric materials to achieve high
performance, the structure and properties at the interface Fig. 1 Chemical structure of methylcellulose used in this study.
between the polymer and a dissimilar material must be
accurately understood for material design. The polymer
interface is at a significantly different energy state compared
with the bulk material,1,2) and its structure and properties are by applying vibrations from the quartz crystal resonator to
notably different. Presently, spectroscopy using X-rays, create the strain necessary to evaluate viscoelasticity, it would
neutrons, and sum frequency generation provides a nonde- be possible to selectively evaluate localized regions near the
structive and accurate method to analyze the structures of interface.
material interfaces,37) thereby enabling the incorporation of Methylcellulose (MC) is a chemically modified cellulose
interfacial structures in material designs. However, when where some or all of the hydrophilic hydroxyl groups (OH
analyzing viscoelasticity, it is extremely difficult to groups) at C2, C3, and C6 of the anhydro-¢-glucose ring
selectively apply and detect micro-strain and force without repeating unit are replaced with the hydrophobic methoxy
destroying the material structures near the interface; thus, group (CH3O). The chemical structure of MC was showed
evaluation methods are limited. in Fig. 1. It is produced from cellulose molecules that are
The piezoelectric oscillation of a quartz resonator has been isolated and purified from trees; therefore, it is a natural
used as an ultra sensitive mass sensor, utilizing the Sauerbrey resource with a low environmental burden. MC with
relationship between the resonance frequency and the mass moderate methoxy group substitution per glucose ring
per unit area deposited on the crystal.8) This relationship (degree of substitution (DS) of 1.52.0) has a nonuniform
has enabled the quartz crystal microbalance (QCM) to be DS in a chain; thus, it behaves as a water-soluble polymer
a mainstay of vacuum science. Kanazawa and co-workers at low temperatures, reversibly transitioning to a cloudy
demonstrated that QCM operation in liquids was possible,9) hydrogel as the temperature increases.11,12) Heyman believed
opening opportunities for QCM to contribute to many that the solution-to-gel (sol-gel) transition of MC is caused by
electrochemical and biological investigations.10) However, dehydration of the molecular chain during heating.13) Kato
the frequency changes depending not only on mass but also et al. proposed hydrogen bond and dipoledipole interaction
on viscoelasticity in liquids. Consequently, we focused on operating between molecular chains, as well as hydrophobic
the depth of ultra-small strains and high-frequency vibrations interaction between chain segments with a high DS, as
from the probe of a QCM quartz crystal resonator propagated candidates for reversible physical crosslinking resulting in
to a liquid at a distance from the interface. We conceived that reversible gelation.14) Kobayashi et al. showed that MC first
undergoes liquid-liquid phase separation forming a polymer
+1
dense phase and a dilute phase, followed by the formation of
This Paper was Originally Published in Japanese in J. Japan Inst. Met.
Mater. 85 (2021) 2329. Captions of all Figures and Tables are modified. physical crosslinking in the polymer dense phase. Thus,
+2
Graduate Student, Mie University gelation occurs in two steps.15) However, much of the initial
+3
Corresponding author, E-mail: fujii@chem.mie-u.ac.jp path of phase separation is unknown, and many models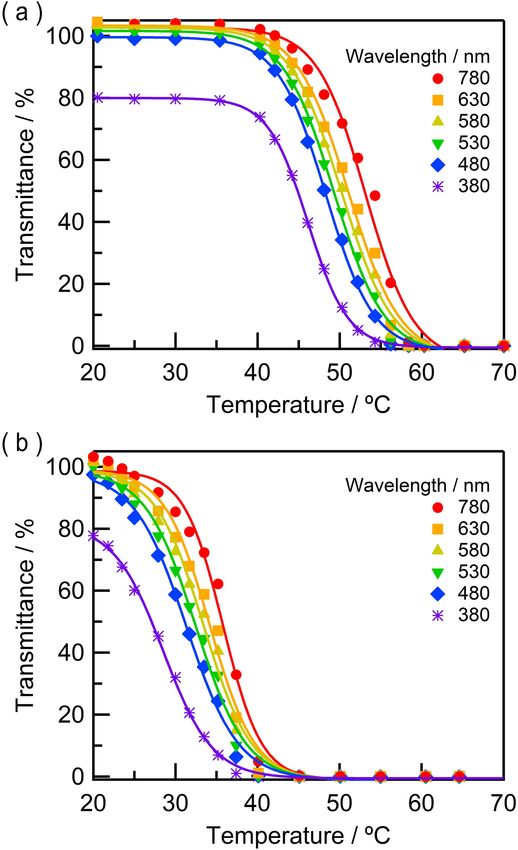
648 K. Yamaoka, Y. Fujii and N. Torikai
have been proposed. Takeshita et al. and Fairclough et al.
proposed that the phase separation of MC is spinodal
decomposition.16,17) On the other hand, Lodge et al.
concluded that the process involves nucleation and growth
mechanism,18) while Tanaka et al. explained that it was
viscoelastic phase separation.19) Therefore, the phase
separation of aqueous MC solutions and the detailed gelation
mechanism are still unclear.
In this study, QCM was used to examine the physical
gelation behavior of an aqueous methylcellulose (MC)
solution that changed in a thermoreversible manner to gain
new insights into MC gelation. Changes in the resonance
frequency of the quartz crystal resonator in the aqueous
MC solution and the dissipation rate were evaluated as a
function of temperature, which enabled the gelation behavior
of the aqueous MC solution to be measured. Results were
compared with the bulk gelation behavior obtained via
traditional transition evaluation methods, namely visual
inclination observation, light transmittance measurement,
and the measurement of rheological properties. The latter
method is frequently used. In addition, by regulating the
electrode surface properties of the quartz crystal resonator, Fig. 2 (a) Optical image of a quartz oscillator with gold electrodes. (b)
the interfacial interaction between the quartz crystal resonator Diagram of the equivalent circuit of a quartz oscillator. C0 is the
electrodes and the aqueous MC solution was changed, the capacitance of electrode. L1, R1 and C1 are the inductance, resistance, and
impact of the interface on the gelation of the aqueous MC capacitance of the AT-cut quartz, respectively. (c) Spectrum of electrical
conductance obtained via QCM with the corresponding resonance
solution was evaluated, and the interface selectivity of the
frequency ( f ) and dissipation (!). (d) Schematic representation of a
viscoelasticity measurement method using the quartz crystal quartz oscillator in a Newtonian liquid. The solid red line represents
resonator was examined. the propagation of vibrations damped depending on distance from the
interface (z). u is the displacement field of a shear wave. ¤ is the
2. Quartz Crystal Microbalance penetration depth represented by the analysis depth of the quartz oscillator
in the liquid.20)
The QCM method is an extremely sensitive weighing
method that detects changes in mass at the molecular level on adhering to the electrodes. Changes in f and ! ("f and "! )
the quartz crystal resonator electrodes through changes in are used to evaluate changes in mass and viscoelasticity.
resonance frequency.8) The AT-cut quartz crystal resonator Complex resonance frequency (f ) is expressed as a
is a typical quartz crystal resonator comprising an extremely function of "f and "! in the following equation:20)
thin quartz crystal cut along AT plane with thin metal film
f ¼ f þ i ð1Þ
electrodes attached to both sides (Fig. 2(a)). Due to the
inverse piezoelectric effect of the crystal, when an When a minute amount of a rigid substance comes in contact
alternating-current (AC) voltage is applied to electrodes, with electrodes of the quartz crystal resonator, the complex
thickness-shear vibration occurs in the direction parallel to resonance frequency changes in proportion to the change in
the crystal surface at a certain resonance frequency. The the mass on the electrodes, which is at the nanogram scale.
resonance frequency of the quartz crystal resonator depends However, since changes in the dissipation rate are extremely
on the thickness of the crystal and is typically high (in the small compared with changes in the resonance frequency
order of 106 Hz). In addition, mechanical strain induced by («"!« ¹ «"f «), changes in mass on the electrodes and
the quartz crystal resonator has been reported to be extremely changes in the resonance frequency are expressed by
small, at a sub-nanometer scale. eq. (2):8)
When the quartz crystal resonator is vibrating at the
f f ¼ 2 n f0 2 m=Zq ð2Þ
resonance frequency, it can be represented by the equivalent
circuit in Fig. 2(b). The electrical characteristics of the quartz where n represents harmonics, f0 is the basic resonance
crystal resonator change in response to the environment frequency of the quartz crystal resonator, "m is the change
and the application of mechanical power.20) The QCM can in mass per unit volume on the quartz crystal resonator
evaluate changes in the mass on the electrode substrate and electrodes, and Zq is the acoustic impedance of AT-cut quartz
changes in the viscoelasticity of a substance adhering to the crystal (8.8 © 106 kg m¹2 s¹1).
electrode substrate from the electrical characteristics of the However, when the quartz crystal resonator is in contact
quartz crystal resonator. Figure 2(c) shows the conductance with a homogeneous Newtonian fluid in a semi-infinite
spectrum of the quartz crystal resonator measured via QCM. region wider than the limit of vibration propagation, the
The peak frequency is referred to as the resonance frequency complex resonance frequency is proportional to the product
( f ), while the half width at half maximum (! ) of the peak is of the viscosity and the density of liquid and is expressed by
the dissipation rate due to the viscoelasticity of substance the following equation:9,2025)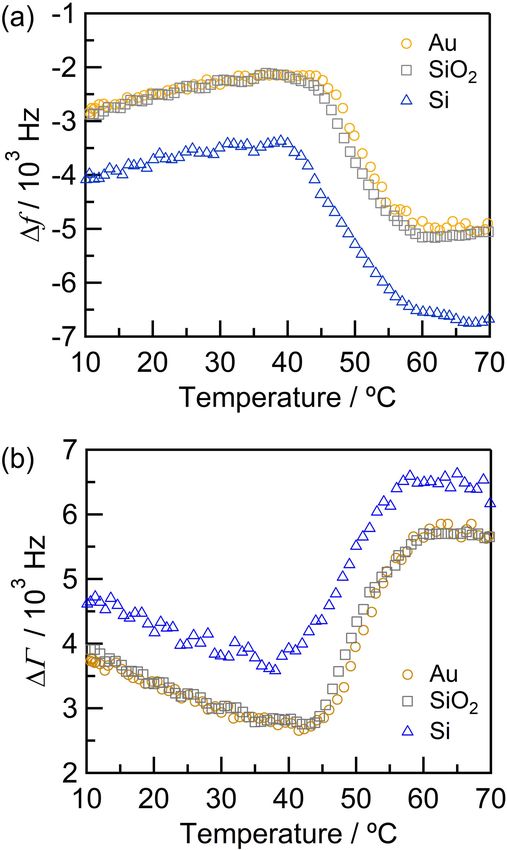
Evaluation of Local Gelation Behavior of Aqueous Methylcellulose Solution Using Quartz Crystal Microbalance 649
f =f0 ¼ ð1 þ iÞ ð2nf0 Þ1=2 3.2 Visual inclination observation
We visually observed the gelation behavior of the bulk
ð©liq μ liq Þ1=2 =ð³ 1=2 Zq Þ ð3Þ aqueous MC solution. The solution was heated from 10°C
©liq and μliq are the viscosity and density of the liquid, at a rate of 1°C/min. At pre-determined temperatures, the
respectively. When f is replaced by "f and "! according screw-cap vial containing the solution was tilted 90° to
to eq. (1), eq. (3) can be re-organized and expressed as: visually observe if there was a change in state and fluidity.
Subsequently, the solution was cooled to 10°C at the same
jfj ¼ j j ¼ n1=2 f0 3=2 ð©liq μ liq Þ1=2 =ð³ 1=2 Zq Þ
rate and the change from gel to solution was visually
ð4Þ observed. The temperature of the solution was recorded using
As shown in eq. (4), the absolute value of change of the a thermocouple thermometer. When tilting the screw-cap vial,
resonance frequency and dissipation rate are equal, moreover, a solution that flowed under its own weight was defined as
"f and "! are reciprocals of each other. However, this “sol” and a solution that did not flow was defined as “gel”.
relationship does not apply to non-Newtonian fluids. The temperature at which fluidity was lost was defined as the
Furthermore, the vibration amplitude of the quartz crystal gelation temperature (Tgel). Each experiment was performed
resonator attenuates exponentially from the interface. Thus, five times and the average value was used.
the distance at which the amplitude is 1/e of vibration
amplitude at the interface is called the viscous invasiveness 3.3 Light transmittance measurements
(¤), which is the analytical depth of the quartz crystal A spectrophotometer (V-650, JASCO Corporation) was
resonator in a liquid (Fig. 2(d)). ¤ is expressed by the used to evaluate the temperature dependence of transmittance
following equation:26,27) to assess the phase separation behavior that induces the
gelation of the aqueous MC solution. An aqueous MC
¤ ¼ ½©liq =ð³ f0 μ liq Þ1=2 ð5Þ
solution with concentration of 10 C was placed in a quartz
When the quartz crystal resonator has a basic resonance cell with an optical path length of 1 cm. The cell was sealed
frequency of 9 MHz, the viscous invasiveness in water is with a rubber stopper to avoid the evaporation of water
approximately 190 nm. Therefore, the extremely small during heating. An aluminum heating block was used to
amplitude of the quartz crystal resonator can be directly increase the temperature of the solution from 20 to 70°C at
applied to the interface as a stimulant and the viscoelasticity a rate of 1°C/min. The transmittance of light with a
of a microregion near the interface can be measured. wavelength of 380780 nm was measured every 5°C, as
well as every 2°C between 40 and 60°C in the vicinity of the
3. Experimental gelation temperature. Subsequently, the MC gel that was
heated to 70°C was cooled at a rate of 1°C/min, and the
3.1 Sample and solution preparation transmittance of light with a wavelength of 380780 nm was
We used Metoloseμ SM-25 provided by Shin-Etsu measured every 5°C. This measurement was performed every
Chemical Co., Ltd. as MC with a weight-average molecular 2°C between 40 and 20°C in the vicinity of the temperature
weight (Mw) of 5.1 © 104 g/mol, a polydispersity (Mw/Mn) where the gel returned to sol.
of 1.52, and a DS of 1.8. Vacuum-dried MC powder was
weighed using an electronic balance. An aqueous solution 3.4 Rheology measurements
with a concentration of 10 times that of the critical A rheometer (MCR302, Anton Paar GmbH) was used to
entanglement concentration (C ) was prepared. Here, C is evaluate changes in viscoelasticity associated with the
the concentration where adjacent polymer chains in the gelation of the bulk aqueous MC solution. We poured
solution come in contact resulting in entanglement. More- approximately 20 mL of the solution into the cup of a coaxial
over, it is the concentration where the dilute solution cylindrical jig, and after moving the rotor (inner cylinder) to
transitions to a semi-dilute solution. Since the viscosity of the measurement position, a sample from the upper part of
the polymer solution increases significantly above C , it is the rotor was removed using a pipette (trimming) to improve
a key concentration that characterizes the viscosity of a the reproducibility of the experimental data. The upper part of
polymer solution. C is expressed as the inverse of limiting the sample was sealed with silicon oil with viscosity of 10 cS
viscosity [©], which represents the coefficient of viscosity per (Shin-Etsu Chemical Co., Ltd.). The provided lid for the
molecule:28) prevention of solvent evaporation was applied from the top
of the jig to minimize changes in concentration through
C 1=½© ð6Þ
solvent evaporation during measurement. The resonance
The C of the MC used in the present experiment was frequency was set at 1 Hz and strain was fixed at 1%, which
0.58 mass% in water at 25°C. Viscosity was measured using is the linear range. The storage modulus (GA) and the loss
an Ubbelohde-type viscometer. When water was directly modulus (GAA) were measured in 1°C increments. Temper-
added to the MC powder, only the powder surface became ature was regulated via a Peltier temperature control system
wet and partially dissolved aggregates formed; thus, we (C-PTD200, Anton Paar GmbH) and was increased from 10
prepared the solution via the hydrothermal method where to 70°C at a rate of 1°C/min. Subsequently, the aqueous MC
water heated to 70°C or higher was added. The prepared solution was cooled down to 10°C at the same rate and the
aqueous MC solution was stored overnight at 4°C in a temperature dependence of the moduli during gel-to-sol
refrigerator before use. transition was evaluated.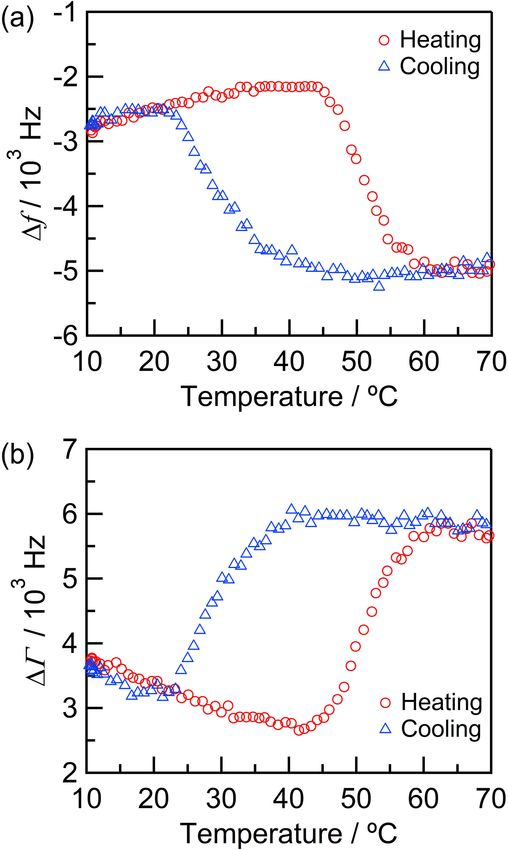
650 K. Yamaoka, Y. Fujii and N. Torikai
Fig. 3 Schematic illustration of QCM measurement equipment.
3.5 QCM measurements
Figure 3 illustrates a schematic of the experimental device.
The quartz crystal resonator had a basic resonance frequency
of 9 MHz and gold (Au) electrodes. The surface of the
electrodes was ultrasonically cleaned for 15 min in ethanol.
The quartz crystal resonator with a Teflon dip-type cell,
which allows for measurement in liquids, was immersed in
the aqueous MC solution. The temperature of the solution
was regulated using an aluminum heating block and was
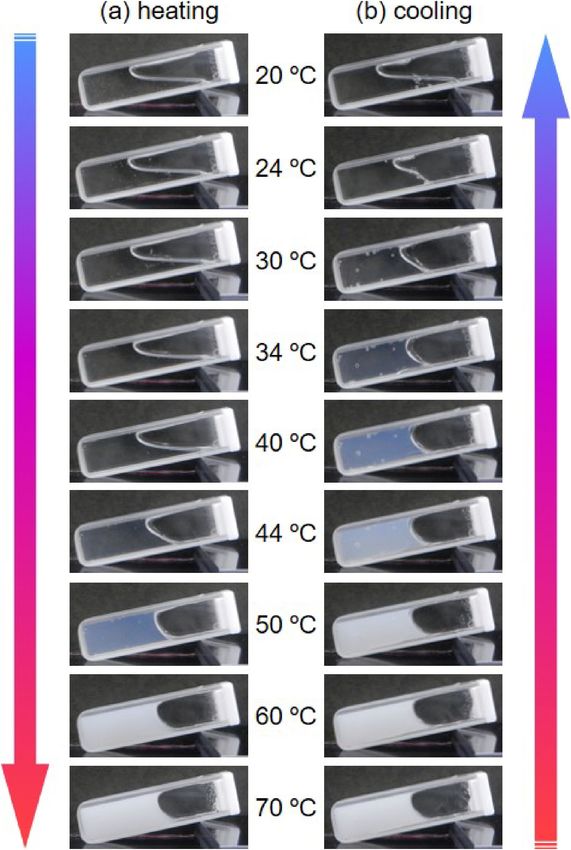
heated from 10 to 70°C at a heating rate of 1°C/min. The Fig. 4 Optical images of the aqueous methylcellulose solution at various
temperature of the solution near the quartz crystal resonator temperatures during (a) heating and (b) cooling.
was recorded using a thermocouple thermometer. "f and "!
were measured via a quartz crystal microbalance measure-
ment system, QCM922A (SEIKO EG&G Co., Ltd.). The MC increased. As the temperature continued to increase, at a
gel heated to 70°C was cooled to 10°C at a rate of 1°C/min, specific temperature, the solution completely lost its fluidity
and the temperature dependence of "f and "! during and changed to a gel. Within the polymer dense phase,
transition from gel to sol was evaluated. physical crosslinking occurred leading to aggregation. The
In addition to the Au electrode quartz crystal resonator, we hydrophobic parts of the MC acted as crosslinking points,
used a silica (SiO2) electrode as the hydrophilic surface. The leading to the reversible formation of a network structure.
natural oxide layer (SiOH group) at the outermost surface The temperature at which the fluidity of the solution was
of the silicon (Si) electrode quartz crystal resonator was completely lost was 50.9 « 0.9°C, which was set as the
hydrophobized (SiH groups) using a 1% of hydrofluoric acid visual Tgel. During cooling (Fig. 4(b)), the solution cleared
aqueous solution. We examined the impact on gelation of the with decreasing temperature and fluidity re-appeared at
interaction at the interface between these three electrodes and approximately 30°C, which was lower than that in case of
the aqueous MC solution with a concentration of 10C . the Tgel obtained during heating. Thus, hysteresis was
observed in the gelation behavior of the aqueous MC
4. Results and Discussion solution.
4.1 Visual inclination observation of the gelation behav- 4.2 Coarsening of the aggregate structure associated
ior of the aqueous MC solution with gelation
Figure 4(a) shows photographs of the state change Figure 5(a) shows the temperature dependence of trans-
associated with increased temperature of the aqueous MC mittance during heating measured in the wavelength band
solution with a concentration of 10C . At lower temperatures, of 380780 nm. When the aqueous methylcellulose solution
MC dissolved in water forming a clear and colorless aqueous was clear and colorless, transmittance was almost 100%.
solution. However, as the temperature increased, the solution However, transmittance at 380 nm was lower at approx-
became cloudy due to the change in the solubility of the imately 80% because the MC molecules absorb light near
MC molecules in water. Methoxy groups within the MC 210 nm within the ultraviolet region. When heated, trans-
molecules dehydrated as the temperature increased.29) As mittance rapidly decreased at approximately 3540°C. The
chain segments with numerous hydrophobic methoxy groups temperature at which transmittance began to decrease shifted
aggregated through hydrophobic interaction, phase separa- toward higher temperatures as the wavelength of the light
tion into a polymer dense phase and a dilute phase increased. We believe this was due to the size of aggregates
occurred,17) resulting in the clouding of the aqueous solution. consisting of MC molecules. When the temperature of the
As clouding progressed, the viscosity of the solution aqueous MC solution was low (2030°C), the molecules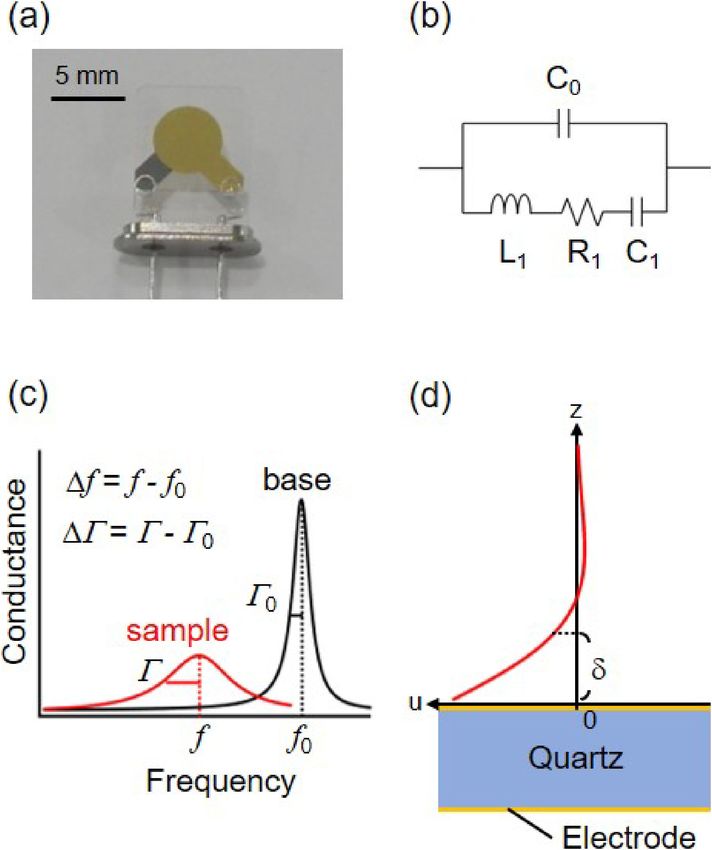
Evaluation of Local Gelation Behavior of Aqueous Methylcellulose Solution Using Quartz Crystal Microbalance                   651

                                                                         Fig. 6 Temperature dependence of the storage modulus (GA) and loss
                                                                            modulus (GAA) of the aqueous methylcellulose solution during heating and
                                                                            cooling.

                                                                         modulus (GA) and loss modulus (GAA) of the aqueous MC
                                                                         solution with a concentration of 10C . At lower temperatures,
                                                                         GAA (viscosity component) was larger than GA (elasticity
                                                                         component), indicating that the aqueous MC solution was in
                                                                         the sol state. The gradual decrease in the moduli between 10
                                                                         and 40°C was caused by the increased thermal activity of
                                                                         molecules with increasing temperature that led to decreasing
                                                                         intermolecular interaction, which in turn lowered the solution
                                                                         viscosity.31) Above approximately 40°C, all moduli rapidly
Fig. 5 Temperature dependence of the transmittance of the aqueous        increased. At higher temperatures, GA was larger than GAA and
   methylcellulose solution during (a) heating and (b) cooling.
                                                                         the aqueous MC solution transitioned to the gel state. Thus,
                                                                         we defined the temperature at which GA and GAA reversed as
                                                                         the “rheometer Tgel”. The rheometer Tgel of the aqueous MC
dissolved in water and minimal aggregation of the molecules              solution with a concentration of 10C was 50.4°C. On the
occurred.30) Therefore, most light passed through the aqueous            other hand, during the cooling of the MC gel, GA and GAA both
MC solution without scattering. However, since light with                displayed constant values down to 40°C, followed by a rapid
short wavelengths was scattered by the MC molecules, short-              decrease from approximately 35°C. The relative values of GA
wavelength transmittance was reduced even at the low                     and GAA reversed at 25°C. The moduli of the aqueous MC
temperatures. As the temperature of the solution increased,              solution followed different paths during heating and cooling,
MC molecules aggregated. As the size of the aggregates                   thus displaying hysteresis, which was attributed to the
increased, initially only short-wavelength light was scattered,          gelation of MC being an entropy-driven reaction.32) To
reducing transmittance. As the size of aggregates further                hydrate the dehydrated MC molecules, entropy must be
increased, even longer wavelength light was scattered At                 lowered to change water molecules from a random state to a
temperatures of 60°C or higher, transmittance of all                     relatively ordered state. To produce the required energy state,
wavelengths reduced to 0% and visual observation confirmed                the aqueous solution must be cooled. Therefore, the network
complete clouding of the MC gel.                                         structure of the MC molecular chain was maintained at a
   The temperature dependence of transmittance during                    lower temperature, leading to observation of hysteresis. After
cooling (Fig. 5(b)) displayed a different behavior from that              cooling to below 15°C, the values of the moduli were similar
during heating. At all wavelengths, transmittance rapidly                to those before heating. This indicates that the gelation of
increased at temperatures, above which transmittance rapidly             the aqueous MC solution is thermally reversible.
decreased during heating, i.e., 20°C. This confirmed hystere-
sis and the thermal reversibility of the gelation of aqueous             4.4   Investigation of gelation behavior of the aqueous
MC solutions with respect to the temperature dependence of                     MC solution via QCM
transmittance. In addition, since the transmittance of long                 We used a quartz crystal resonator with Au electrodes to
wavelengths gradually increased with cooling, it is assumed              measure the temperature dependence of changes in resonance
that the size of the aggregates in the MC molecular chain                frequency ("f ) and dissipation rate ("! ) associated with the
gradually decreased during cooling.                                      gelation of the aqueous MC solution with a concentration of
                                                                         10C . The results are shown in Fig. 7. "f and "! were
4.3  Moduli changes associated with the gelation of the                  dependent on the solution viscosity. The gradual increase in
     aqueous MC solution                                                 "f (decrease in "!) between 10 and 40°C was caused by a
  Figure 6 shows the temperature dependence of the storage               decrease in the solution viscosity associated with increasing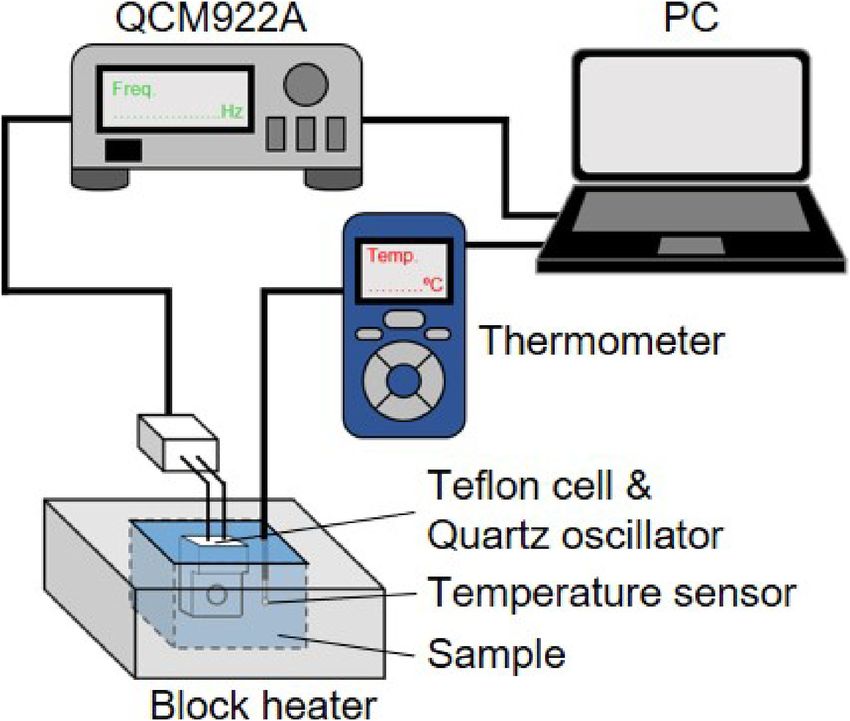
652                                                        K. Yamaoka, Y. Fujii and N. Torikai

Fig. 7 Temperature dependence of (a) the resonance frequency shifts and       Fig. 8 Temperature dependence of (a) the resonance frequency shifts and
   (b) the dissipation shift of the aqueous methylcellulose solution during      (b) the dissipation shifts of the aqueous methylcellulose solution with Au
   heating and cooling.                                                          (yellow circles), SiO2 (gray squares) and Si (blue triangles) electrodes.

Table 1 Gelation temperature of an aqueous methylcellulose solution
                                                                              MC gel was cooled from 70 to 10°C, "f and "! did not
   determined by visual observation, rheometer measurements and QCM
   evaluation.                                                                change until near 40°C, displaying constant values. From
                                                                              approximately 35°C, "f rapidly increased ("! decreased)
                                                                              to a value similar to the pre-heating value at 20°C and below.
                                                                              Hysteresis and thermal reversibility of the aqueous MC
                                                                              solution observed during rheological measurements were
                                                                              also observed as changes in "f and "! during the QCM
                                                                              measurements, empirically demonstrating that QCM can be
                                                                              used to evaluate the gelation of the aqueous MC solution.

                                                                              4.5   Effect of the surface properties of the quartz crystal
                                                                                    resonator
temperature, similar to the gradual decrease in moduli                           Figure 8 shows the temperature dependence of "f and "!
observed during the measurement of rheological proper-                        measured via quartz crystal resonators with three different
ties.33) "f decreased rapidly (increase in "! ) at temperatures               electrodes, namely Au, hydrophilic SiO2, and hydrophobic
above 45°C because the gelation of the aqueous MC solution                    Si. There was no notable difference in the temperature
rapidly increased the solution viscosity. Subsequently, at                    dependence of "f and "! for the aqueous MC solution
60°C and higher, the gelation of the aqueous MC solution                      when using the Au and SiO2 electrodes. However, when
was complete; therefore, "f and "! displayed constant                         using the hydrophobic Si electrode, the resonance frequency
values. As such, "f and "! changed due to the gelation                        was approximately 1000 Hz lower than that measured with
of the aqueous MC solution. Therefore, we defined the                          the Au and SiO2 electrodes, while the dissipation rate was
inflection point where "f rapidly decreased as the “QCM                        approximately 500 Hz higher, indicating that the viscosity
Tgel”. The QCM Tgel of the aqueous MC solution with the                       of the solution was high near the interface. Since the change
concentration of 10C was 50.4 « 0.5°C. It is listed in                       in the resonance frequency was greater than the change in
Table 1 along with Tgel obtained from the measurement of                      the dissipation rate, it was assumed that MC molecular
rheological properties. The Tgel values obtained via the                      chains were adsorbed onto the electrode thereby increasing
different measurement methods were consistent. When the                        the viscosity. In addition, the Tgel values obtained from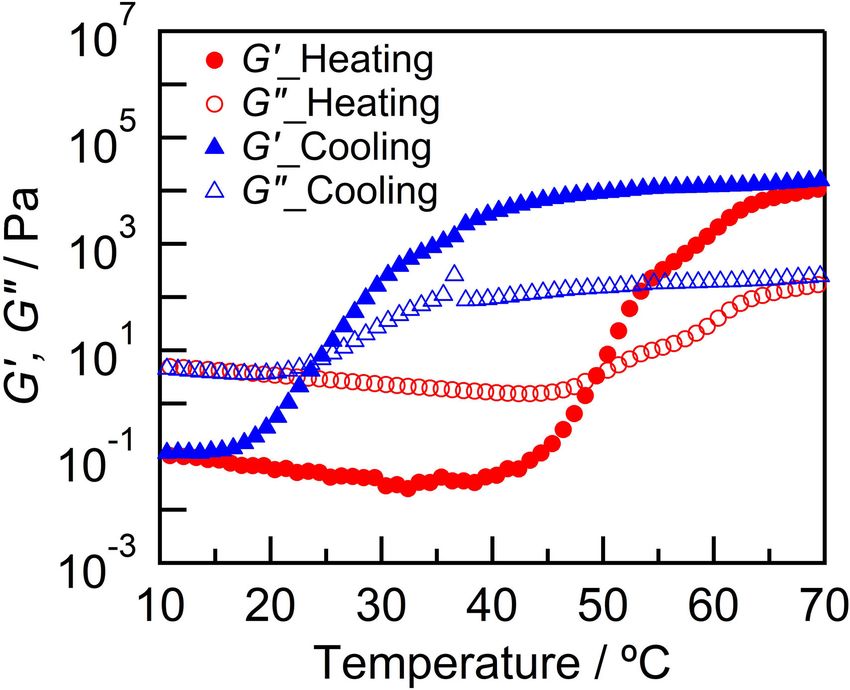
Evaluation of Local Gelation Behavior of Aqueous Methylcellulose Solution Using Quartz Crystal Microbalance 653
Table 2 Gelation temperature (Tgel) of an aqueous methylcellulose solution 5. Conclusions
via a quartz oscillator with various electrodes. £ is the surface free energy
and RMS is the root mean square of the surface roughness of the
electrodes. We successfully observed changes in solution viscosity
associated with the gelation of an aqueous MC solution with
the concentration of 10C as changes in resonance frequency
by via QCM and thereby determined the gelation temper-
ature. Similar to the rheological behavior, the hysteresis and
thermal reversibility of the aqueous MC solution were
successfully demonstrated using the temperature dependence
of "f and "!. In addition, the temperature dependence of "f
and "! associated with the gelation of the solution using
three different electrodes was investigated. The measure-
ments confirmed an increase in the adsorption of MC
temperature dependence of "f for each electrode are molecules onto the increased surface area of the quartz
summarized in Table 2. The lowest value was observed in crystal resonator electrodes and an associated decrease in Tgel,
case of the Si electrode. It was implied that at the interface indicating that QCM can measure viscoelasticity near the
with the Si electrode substrate, the local MC concentration interface.
was higher than at the Au and SiO2 electrode interfaces.
To determine the reason for the differences in Tgel for the Acknowledgement
different electrodes, we evaluated the surface free energy (£)
and root mean square (RMS) roughness of each electrode This work was supported by JSPS KAKENHI Grant
surface. £ was calculated from the contact angle of the Numbers JP19H05720 and JP16K05926. Part of this study
electrode surface to water and diiodomethane, while RMS utilized the Alumni Association research fund of the Faculty
roughness was evaluated via atomic force microscopy of the of Engineering at Mie University. In addition, the measure-
electrode surface (Table 2). ment of rheological properties was performed at National
The SiO2 and the Si electrodes that had been hydro- Institute for Materials Science (NIMS) supported by NIMS
phobized with hydrofluoric acid displayed similar £ values Joint Research Hub Program. We would like to extend our
that were larger than that of the Au electrode. £ of the Au most sincere appreciation to the NIMS Data-driven Polymer
electrode was close to the theoretical value;34,35) however, the Design Group Leader, Dr. Masanobu Naito, for providing an
Si and SiO2 electrodes deviated from the hydrophilic and opportunity for measurement.
hydrophobic behavior observed for a typical Si substrate
surface. In case of the Si electrode, we believe that this was REFERENCES
due to the extremely unstable nature of the SiH group that
covers the outermost surface of the dehydrated Si electrode, 1) M. Kawaguchi and K. Hayakawa: Interfaces and Dispersion Colloids
along with the impact of being oxidized even in ambient Basic Principles and Applications, (CMC Publishing CO., LTD.,
atmosphere. For the SiO2 electrode, the deviation was due Tokyo, Japan, 2017).
2) Y. Fujii, H. Morita, A. Takahara and K. Tanaka: in Glass Transition,
to the inadequate acidification of the outermost surface of Dynamics and Heterogeneity of Polymer Thin Films, (Springer Verlag
the electrode because of the structure of the quartz crystal Berlin, Heidelberg, 2013) pp. 127.
resonator. In addition, MC has both hydrophilic hydroxyl 3) K. Mitamura, N.L. Yamada, H. Sagehashi, N. Torikai, H. Arita, M.
groups and hydrophobic methoxy groups, thus displaying Terada, M. Kobayashi, S. Sato, H. Seto, S. Goko, M. Furusaka, T. Oda,
amphiphilicity. Therefore, adhesion occurred on all surfaces M. Hino, H. Jinnai and A. Takahara: Polym. J. 45 (2013) 100108.
4) H. Tanoue, N.L. Yamada, K. Ito and H. Yokoyama: Langmuir 33
independent of the hydrophilic or hydrophobic nature of the (2017) 51665172.
electrode resulting in no significant difference in £. The above 5) D.A. Barkley, N.S. Jiang, M. Sen, M.K. Endoh, J.G. Rudick, T. Koga,
results are expected since surface free energy exhibits Y.G. Zhang, O. Gang, G.C. Yuan, S.K. Satija, D. Kawaguchi, K.
extremely short distance interaction compared with the depth Tanaka and A. Karim: Macromolecules 50 (2017) 76577665.
of analysis of the quartz crystal resonator. 6) X. Li and X.L. Lu: Macromolecules 51 (2018) 66536660.
7) H. Ogawa, M. Takenaka, T. Miyazaki, T. Kabe and T. Kanaya:
The RMS roughness was approximately 0.8 nm for the Au
Macromolecules 51 (2018) 1004010051.
and SiO2 electrodes, but notably lower than 1.8 nm for the 8) G. Sauerbrey: Z. Phys. 155 (1959) 206222.
hydrophobized Si electrode surface. Since the RMS rough- 9) K.K. Kanazawa and J.G. Gordon: Anal. Chem. 57 (1985) 17701771.
ness of the Si electrode surface prior to hydrophobization 10) K. Sadman, C.G. Wiener, R.A. Weiss, C.C. White, K.R. Shull and B.D.
by hydrofluoric acid was 0.76 nm, the hydrofluoric acid Vogt: Anal. Chem. 90 (2018) 40794088.
11) M. Hirrien, J. Desbrieres and M. Rinaudo: Carbohydr. Polym. 31
treatment likely increased the surface roughness of the Si
(1996) 243252.
electrode. Consequently, the surface area of the Si electrode 12) L. Li, P.M. Thangamathesvaran, C.Y. Yue, K.C. Tam, X. Hu and Y.C.
with hydrophobization treatment increased and more MC Lam: Langmuir 17 (2001) 80628068.
molecules adhered to the interface than in case of other 13) E. Heymann: Trans. Faraday Soc. 31 (1935) 846864.
electrodes. (This was reflected by the change in "f.) Thus, it 14) T. Kato, M. Yokoyama and A. Takahashi: Colloid Polym. Sci. 256
(1978) 1521.
can be concluded that an increase in the surface area of
15) K. Kobayashi, C.-i. Huang and T.P. Lodge: Macromolecules 32 (1999)
electrodes resulted in a higher local concentration of the 70707077.
aqueous MC solution near the interface, leading to a decrease 16) H. Takeshita, K. Saito, M. Miya, K. Takenaka and T. Shiomi: J. Polym.
in Tgel. Sci. B Polym. Phys. 48 (2010) 168174.654 K. Yamaoka, Y. Fujii and N. Torikai
17) J.P. Fairclough, H. Yu, O. Kelly, A.J. Ryan, R.L. Sammler and M. 27) H. Muramatsu: in Handbook of Biosensor and Chemical Sensors,
Radler: Langmuir 28 (2012) 1055110557. (TECHNO SYSTEM CO., LTD, Tokyo, Japan, 2007) pp. 374383.
18) J.R. Lott, J.W. McAllister, M. Wasbrough, R.L. Sammler, F.S. Bates 28) S.A. Arvidson, J.R. Lott, J.W. McAllister, J. Zhang, F.S. Bates, T.P.
and T.P. Lodge: Macromolecules 46 (2013) 97609771. Lodge, R.L. Sammler, Y. Li and M. Brackhagen: Macromolecules 46
19) H. Tanaka: J. Phys. Condens. Matter 12 (2000) R207R264. (2013) 300309.
20) D. Johannsmann: The Quartz Crystal Microbalance in Soft Matter 29) J. Desbrieres, M. Hirrien and M. Rinaudo: Carbohydr. Polym. 37
Research: Fundamentals and Modeling, (Springer International (1998) 145152.
Publishing, Cham, Switzerland, 2015). 30) R. Bodvik, A. Dedinaite, L. Karlson, M. Bergstrom, P. Baverback, J.S.
21) T. Nomura and O. Hattori: Anal. Chim. Acta 115 (1980) 323326. Pedersen, K. Edwards, G. Karlsson, I. Varga and P.M. Claesson:
22) T. Nomura and M. Okuhara: Anal. Chim. Acta 142 (1982) 281284. Colloids Surf. A 354 (2010) 162171.
23) S. Bruckenstein and M. Shay: Electrochim. Acta 30 (1985) 12951300. 31) S.M. Silva, F.V. Pinto, F.E. Antunes, M.G. Miguel, J.J. Sousa and A.A.
24) P. Schön, R. Michalek and L. Walder: Anal. Chem. 71 (1999) 3305 Pais: J. Colloid Interface Sci. 327 (2008) 333340.
3310. 32) L. Li: Macromolecules 35 (2002) 59905998.
25) I. Goubaidoulline, J. Reuber, F. Merz and D. Johannsmann: J. Appl. 33) M.I.S. Veríssimo, A.A.C.C. Pais and M.T.S.R. Gomes: Carbohydr.
Phys. 98 (2005) 014305. Polym. 82 (2010) 363369.
26) L.D. Landau and E.M. Lifshitz: Fluid Mechanics, (Pergamon, Oxford, 34) R.A. Erb: J. Phys. Chem. 72 (1968) 24122417.
1987) pp. 4494. 35) D. Parobek and H. Liu: 2D Materials 2 (2015) 032001.You can also read