Copper-nickel oxide nanofilm modified electrode for non-enzymatic determination of glucose
←
→
Page content transcription
If your browser does not render page correctly, please read the page content below
J. Electrochem. Sci. Eng. 10(3) (2020) 245-255; http://dx.doi.org/10.5599/jese.699
Open Access: ISSN 1847-9286
www.jESE-online.org
Original scientific paper
Copper-nickel oxide nanofilm modified electrode for
non-enzymatic determination of glucose
Mahsa Hasanzadeh1,, Zahra Hasanzadeh1, Sakineh Alizadeh2, Mehran Sayadi3,,
Mojtaba Nasiri Nezhad4, Reza E. Sabzi1 and Sajjad Ahmadi1
1
Department of Analytical Chemistry, Faculty of Chemistry, University of Urmia, Urmia, Iran
2
Faculty of Chemistry, Bu-Ali Sina University, Hamadan, Iran
3
Department of Food Safety and Hygiene, School of Health, Fasa University of Medical Science,
Fasa, Iran
4
Department of Chemical Engineering, Urmia University of Technology, Urmia, Iran
Corresponding authors: mahsa.hasanzadeh95@gmail.com; tmf_fmt3000@yahoo.com
Received: May 22, 2019; Revised: December 20, 2019; Accepted: December 22, 2019
Abstract
CuxO-NiO nanocomposite film for the non-enzymatic determination of glucose was
prepared by the novel modifying method. At first, anodized Cu electrode was kept in a
mixture solution of CuSO4, NiSO4 and H2SO4 for 15 minutes. Then, a cathodization process
with a step potential of -6 V in a mixture solution of CuSO4 and NiSO4 was initiated,
generating formation of porous Cu-Ni film on the bare Cu electrode by electrodeposition
assisted by the release of hydrogen bubbles acting as soft templates. Optimized conditions
were determined by the experimental design software for electrodeposition process.
Afterward, Cu-Ni modified electrode was scanned by cyclic voltammetry (CV) method in
NaOH solution to convert Cu and Ni nanoparticles to the nano-scaled CuxO-NiO film. The
electrocatalytic behavior of the novel CuxO-NiO film toward glucose oxidation was studied
by CV and chronoamperometry (CHA) techniques. The calibration curve of glucose was
found linear in a wide range of 0.04–5.76 mM, with a low limit of detection (LOD) of 7.3 µM
(S/N = 3) and high sensitivity (1.38 mA mM-1 cm-2). The sensor showed high selectivity
against some usual interfering species and high stability (loss of only 6.3 % of its
performance over one month). The prepared CuxO-NiO nanofilm based sensor was
successfully applied for monitoring glucose in human blood serum and urine samples.
Keywords
CuxO; NiO; nanofilm; Cu electrode; modifying method; non-enzymatic glucose sensor.
Introduction
In electro-biochemical analysis, it is generally believed that sensing interfaces play key roles in the
enzyme-less detection of biomolecules like glucose, ascorbic acid (AA), dopamine (DA) and uric acid
http://dx.doi.org/10.5599/jese.699 245
J. Electrochem. Sci. Eng. 10(3) (2020) 245-255                NON-ENZYMATIC DETERMINATION OF GLUCOSE

(UA) [1]. Glucose detection is essential in clinical diagnosis, biotechnology and food industry [2]. Over
past decades, a number of studies was performed on alleviating drawbacks of enzymatic glucose
sensors [3]. The majority of known amperometric biosensors for glucose monitoring use glucose
oxidase (GOD) or glucose dehydrogenase enzymes [4,5]. The most common and serious problem is
insufficient stability resulted from the nature of the enzymes which could hardly be restrained.
Although GOD is quite stable compared to other enzymes, glucose sensors based on GOD are always
exposed to a possibility of thermal and chemical deformation during fabrication, storage or use.
Furthermore, GOD quickly loses its activity below pH 2 and above pH 8, and also, temperatures above
40 °C can cause fatal damages [3]. Ionic detergents also deactivate GOD. At the other side, glucose
dehydrogenase enzyme showed the problem of effectiveness from interfering species like AA, DA, etc.
[6,7], unless a selective membrane for reducing effect of interfering species was used [8]. To overcome
the above obstacles, non-enzymatic glucose sensors are developed coming closer to practical
applications [6]. Non-enzymatic glucose sensors have received significant interest due to their
advantage of thermal and chemical stability [7]. In order to prepare a non-enzymatic glucose sensor,
nanostructured particles have attracted extensive scientific and industrial interests due to their unique
electronic, optical and catalytic properties [9]. Moreover, when utilizing nanomaterials, it becomes
possible to minimize the influence of interfering substances such as AA and UA [10]. Various
nanostructured materials have been proposed as new opportunities to develop novel non-enzymatic
glucose sensors [6] such as carbon nanotubes [11], metals [12,13], metal oxides such as NiO [14-17]
or Cu2O [18], metal composites such as Cu-Ni [19], etc. Different methods were already reported for
preparations of different forms of Cu-Ni film for determining various materials, such as preparation of
Cu-Ni alloys used in electrochemical oxygen analysis [20] or preparation of Cu and Ni nanoparticles
deposited on ITO electrode for non-enzymatic electrochemical carbohydrates sensor applications
[21]. In addition, Cu@Ni/MWCNT nanocomposite was prepared for simultaneous electrochemical
determination of guanine and adenine [22], Cu@Ni core–shell nanoparticles/reduced graphene oxide
nanocomposite for non-enzymatic glucose sensor [23], and non-enzymatic multispecies sensor based
on Cu-Ni nanoparticle dispersion on doped graphene [19].
    The goal of this work is preparation of the novel Cu-Ni nanofilm on an inexpensive electrode like
Cu, which should serve as fast, low-cost and easy method for the non-enzymatic glucose determina-
tion. A novel procedure of CuxO-NiO nanocomposite fabrication is proposed, involving hydrogen
bubbles evolution serving as soft templates for electrodeposition of porous Cu-Ni nanofilm. Finding of
optimized conditions for electrodeposition is based on a famous statistical method called the response
surface methodology (RSM). RSM method is widely applicable in electrochemistry and other research
fields for gaining some important information for optimizing experimental conditions by considering
the interactions between model factors instead individual variables. Deposition potential, time of
deposition and volume combination of Ni-Cu solutions are chosen as model factors in
electrodeposition. The prepared novel nanocomposite CuxO-NiO film is studied by CV and CHA
techniques and tested for amperometric determination of glucose in practical samples of human
blood serum and urine.

Experimental
Reagents and chemicals
   CuSO4×5H2O, NiSO4×6H2O, NaOH, AA, UA, DA and H2SO4 were all purchased from Merck Co.
Blood serum samples were obtained from a local hospital. For glucose determination, 0.1 M NaOH

246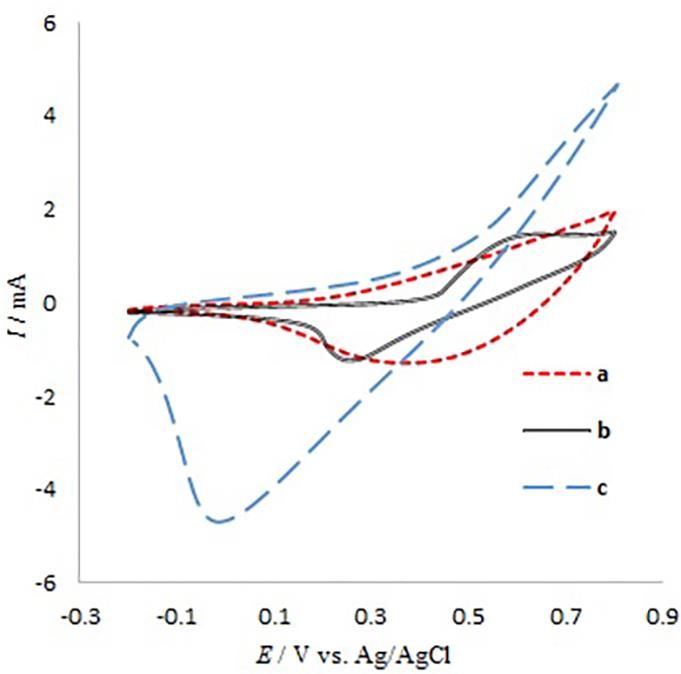
M. Hasanzadeh et al.                                         J. Electrochem. Sci. Eng. 10(3) (2020) 245-255

solution was used as the electrolyte. Double distilled (DD) water was applied in preparing all
solutions.
Apparatus and electrochemical measurements
   Electrochemical experiments were performed in a three-electrode cell, µAutolab type III
(Netherlands). Agilent technologies DC power supply N5752A (USA) was used for applying -6 V
potential. Cu rod electrode (3 mm in diameter), Ag/AgCl (KCl saturated) electrode and a piece of Pt
wire were used as working, reference and counter electrode, respectively. Ultrasonicator (Pars
Nahad Co., Iran) was applied to clean the electrode surface from impurities. Field emission scanning
electron microscopy (FESEM) images were obtained by a MIRA3 TESCAN SEM system [Razi
Metallurgical Research Center (RMRC), Iran]. X-ray diffraction (XRD) measurements were done at
Urmia University. Optimized conditions were determined by the experimental design. All
calculations and programming for the experimental design were performed in MATLAB (Hyper-cube
Inc. Version10) software. The essential regression and experimental design for chemists and
engineers (Eregress) excel were added in software. All experiments were conducted in stationary
solutions except tests relevant to a hydrodynamic CHA method, which were conducted using a
magnetic stirrer with a constant rotation speed of 150 rpm. All parameters affecting the
experiments including concentrations of solutions, volume ratios of solutions, electrolyte
concentrations, applied step potential and its duration time, were optimized. All experiments were
performed at room temperature (25 °C) and repeated at least three times.
Modified electrode fabrication
   Bare Cu electrode was firstly polished with 400 and 2000 grit emery papers respectively, and
washed to remove impurities. Then, the electrode was immersed into DD water and ultrasonicated
for few minutes. Afterwards, the surface of the electrode was washed with DD water again to clean
any surface impurity. After polishing and cleaning of the surface, the electrode was anodized
electrochemically by CHA method with an applied potential of +1.5 V for 40 s in 0.1 M NaOH. Then,
the electrode was washed carefully with DD water and dried in air. Before electrodeposition of Cu-
Ni film, the anodized Cu electrode was kept for 15 minutes in a solution mixture of 0.3 M CuSO4, 0.3
M NiSO4 and 0.5 M H2SO4 (5:5:2 v/v), which was referred to as precursor solution, for effective
contacting with electrode surface. Then, a step potential of -6 V was applied for 70 s in a solution
mixture of 0.3 M CuSO4 and 0.3 M NiSO4 (1:1 v/v). During the cathodic electrodeposition process,
the porous Cu-Ni film was generated on the bare Cu electrode surface with the concurrent release
of hydrogen bubbles acting as soft templates. In the next step, Cu-Ni film modified electrode was
scanned by CV method in the potential range of -0.2 to 0.8 V in 0.1 M NaOH to convert Cu and Ni
nanoparticles to the nano-scaled CuxO-NiO film. At the end of the synthesis procedure, CuxO-NiO
modified Cu electrode was carefully rinsed with DD water, dried and kept in the air for further
experiments. Eregress software was utilized to determine the optimum deposition conditions,
including applied potential and its duration, as well as relative volume percent of 0.3 M CuSO4 and
0.3 M NiSO4 as model factors. The central composite design was used to prepare a model for
obtaining optimized conditions.

Results and discussion
Characterization of nanostructured modified Cu electrode
    A novelty of this work is related to a newly proposed method for preparing Cu-Ni nanocomposite
film on the electrode surface, including a novel mixing method for modifier solutions. The method is

http://dx.doi.org/10.5599/jese.699                                                                    247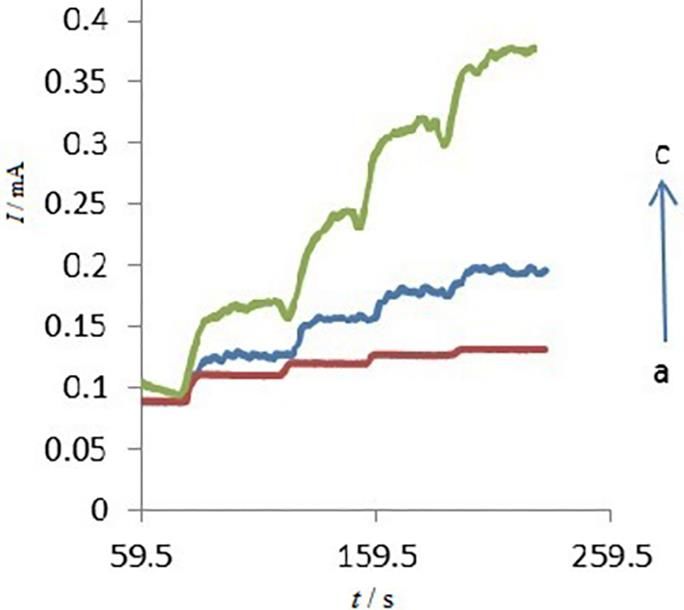
J. Electrochem. Sci. Eng. 10(3) (2020) 245-255                    NON-ENZYMATIC DETERMINATION OF GLUCOSE

very fast, straightforward and cheap compared to other methods which have been previously used
for fabricating composite materials, like fabrication of Cu-Ni by mechanically alloying [24] or some
other techniques [25,26]. It must be stressed that here proposed method could also be applied in
producing other electroactive composites for detecting other materials.
   The surface examination of CuxO-NiO/Cu electrode under FESEM proved formation of nano-sized
and non-uniform porous structures (Figure 1).

                       Figure 1. SEM images of CuxO-NiO film at different magnifications

    The use of porous films with non-uniform pores resulted in better efficiency compared to traditi-
onal porous films [27]. Presence of nanoparticles deposited on Cu electrode is clearly demonstrated
in Figure 1. The obvious porosity of the electrode surface is due to the hydrogen bubble evolution. By
applying a high negative step potential for a limited time, a deposition of nano-scaled particles is
generally expected because particles could not expand their size and participate in the nucleation
process. In the present case, nanoparticles had just 70 s to deposit on the electrode surface at -6 V
and therefore, they deposit along each other in a sloppy manner. The phase characteristics of the
modified electrode are identified from its XRD pattern. As depicted in Figure 2 the diffraction peaks of
the modified film are well indexed as monoclinic CuO (JCPDS no. 45-0937), Cu2O (JCPDS no. 34-1354),
NiO (JCPDS no. 47-1049), Cu (JCPDS no. 04-0836) and Ni (JCPDS no. 04-0850), respectively.

                                      Figure 2. XRD pattern of CuxO-NiO film

248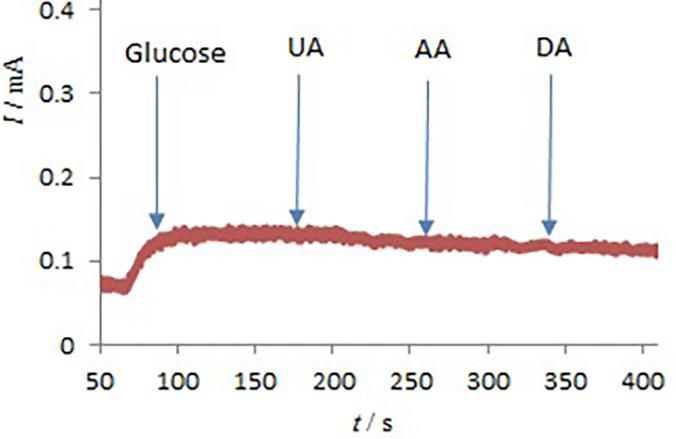
M. Hasanzadeh et al.                                                 J. Electrochem. Sci. Eng. 10(3) (2020) 245-255

Optimization of electrodeposition process by experimental design method
      Central composite experimental design (CCD) was applied for simultaneous optimization of
experimental parameters. CCD method is useful to determine the number of experiments that must
be performed for the optimization of variables (factors) and responses. CCD uses the response
surface methodology (RSM) to optimize experimental conditions. RSM is a widely used
mathematical and statistical method for modeling and analyzing a process in which the response of
interest is influenced by various variables and the goal of this method is to optimize the response.
A key aim of experiment was to determine how significant each factor is. It is discussed how to
design an experiment that allows sufficient degrees of freedom to determine the significance of a
given factor. In the following section, the procedure of proving significance of each factor is
explained. There are many situations, in which this information would be useful. After checking
different parameters in CCD, one model is defined for obtaining the best conditions of synthesis,
which get the response as a function of effective parameters. Multiple linear regression (MLR)
method is used for modelling and the coefficients are calculated. The effect of three independent
electrodeposition variables (E, t and v) on the system response is approximated by the second
degree polynomial (MLR) equation:
   response = b0 + b1E + b2t + b3v + b4E2 + b5Et + b6t2 + b7v2                                 (1)
   According to eq. (1), the response for optimization of three factors, i.e. applied potential (E), applied
potential duration (t) and relative volume percent (v), involves b0 as an intercept or average, b1E, b2t
and b3v as linear terms depending on each of three factors, b5Et interaction term between factor E
and t, and also b4E2, b6t2, and b7v2 quadratic terms depending on each of three factors. Greater
coefficients in eq. (1) show a more effective parameter and positive signs of coefficients describe that
with their increasing, the response is increased as well. Some of the obtained characteristics of the
designed model calculated by experimental design software (Eregress) are: b0 = -0.179, b1 = -0.06307,
b2 = 0.00406, b3 = 0.00642, b4 = -0.00659, b5 = -0.000217, b6 = -3.92673×10⁻⁵, b7 = -6.68436×10⁻⁵. Since
coefficients b2 and b3 have the highest values, t and v are defined as the most effective factors in the
response.
   In this work, Eregress software was used for interpreting the effect of both first and second order
of parameters. The minimum, intermediate, and maximum values of each variable are labeled as −1,
0, and +1, respectively. If P-value (probability value) for each variable was greater than 0.05, it would
not have significant effect in the model and takes zero value. If P-value was greater than 0.05 but the
higher order of this factor had P-value less than 0.05, the variable was not removed.
   Table 1 shows R2 (coefficient of determination), that was improved by eliminating some
unimportant variables (P>0.05). R2 is a statistical measure that shows the proportion of the variance
for a dependent variable that is affected by all independent variables in a regression model. In other
words, R2 assumes that every independent variable explains the variation in the dependent variable.
                       Table 1. Coefficients of determination of prepared statistical model
                                    R2           Adjusted R2         Predicted R2
                                  0.946            0.908                0.747

   The adjusted R2, however, increases only if the new term improves the model more than would
be expected by chance. Therefore, in statistical modeling, adjusted R2 was also determined. The
predictive power of the model has been proved by the predicted R2 value. This parameter was
obtained from the sum of squares of predicted errors. Comparing of R2, adjusted R2 and predicted
R2 can be a convenient technique to understand the conformity of a model. In a good model these

http://dx.doi.org/10.5599/jese.699                                                                            249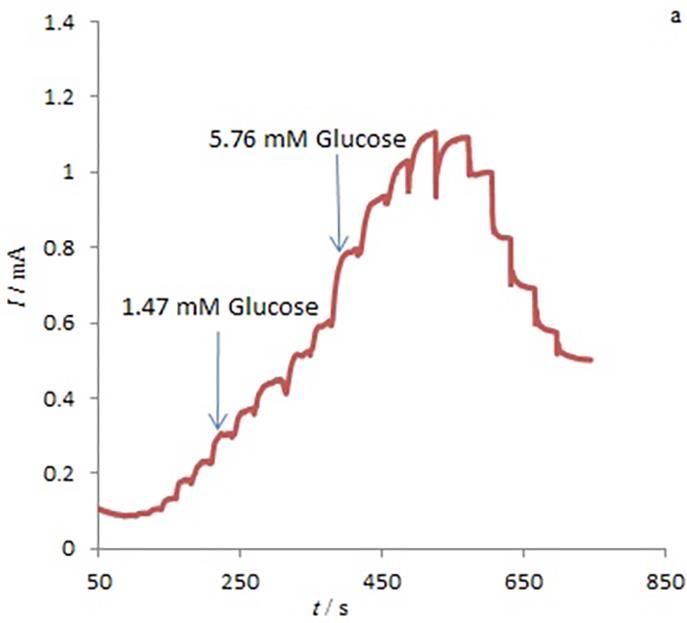
J. Electrochem. Sci. Eng. 10(3) (2020) 245-255 NON-ENZYMATIC DETERMINATION OF GLUCOSE
three parameters should not be too different. As shown in Table 1, R2, adjusted R2 and predicted R2
have acceptable values for the model conformity.
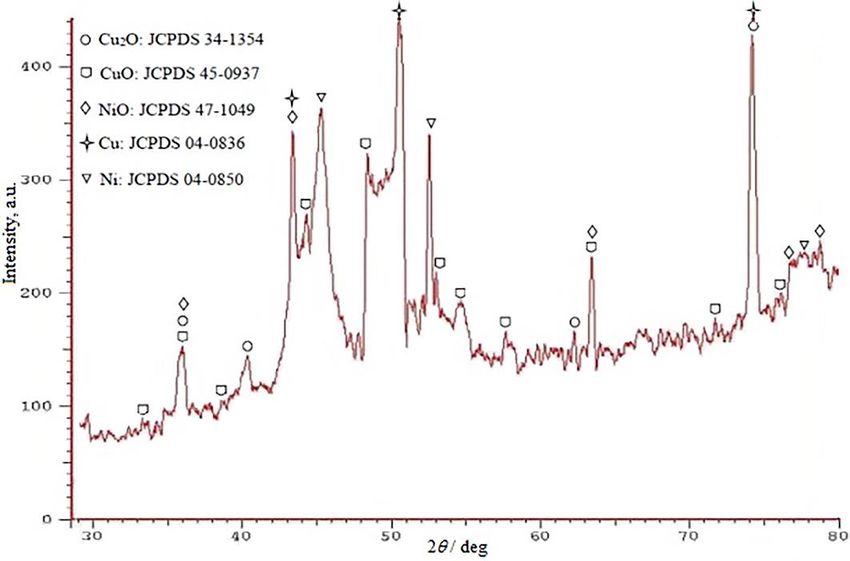
For obtaining the optimum conditions of studied parameters, the surface response plots (plots
show response as surfaces) were constructed. The optimum values can be derived using these plots.
In these plots, all the minimum or maximum values of response for relative volume (V / %), E and t
were investigated. Also, the relationship between the dependent and independent variables can be
understood by these plots. Since the model has more than two factors, one factor was always kept
constant. The example of surface response plot is shown in Figure 3. This figure demonstrates the
interaction between relative volume (v) and E when t was kept constant. Response numbers show
how much the factors influence another variable. Maximum response for each factor was selected
according to surface response. As a general result, the optimized values for the applied potential,
deposition time and relative volume percent were determined to be -6 V, 70 s and 50 % (1:1 v/v),
respectively where the current or response was maximum in the corresponding surface response
plots.
Figure 3. Surface response representation related to RSM for optimizing two variables
(E and relative volume, when t was kept constant).
Cyclic voltammograms and electro-oxidation behavior of glucose at CuxO-NiO modified Cu electrode
Cyclic voltammograms in Figure 4 show that Cu (a), Ni (b) and Cu-Ni (c) particles can deposit
separately or along each other at -6 V. However cyclic voltammogram for CuxO-NiO shows higher
current of the overall redox process. Maybe the synergistic effect of Ni and Cu particles along each
other is the reason for this phenomenon. It must be stressed here that according to our previous
experiments performed under optimum conditions, presence of 0.3 M NiSO4 in the deposition
solution of 0.3 M CuSO4 resulted in an increased current of the redox peaks in cyclic voltammograms
and chronoamperograms.
Cyclic voltammograms in Figure 4 are in accordance with other studies [1,28]. It is seen in Figure
4a, that the modified CuxO electrode provides broad anodic and cathodic peaks attributed to
successive Cu+/Cu2+ and Cu2+/Cu3+ redox pairs in the alkaline solution within the specified potential
region [28]. Figure 4b shows Ni2+/Ni3+ redox pair for NiO film, what is in well agreement with Ref.
[14]. Therefore, Cu+/Cu2+, Cu2+/Cu3+ and Ni2+/Ni3+ redox pairs would play the main role in redox
process of CuxO-NiO film modified electrode.
Figure 5 compares the electro-oxidation behaior of CuxO-NiO film electrode in alkaline medium
with and without presence of glucose in the potential range of -0.2 to 0.8 V.
250
M. Hasanzadeh et al.                                              J. Electrochem. Sci. Eng. 10(3) (2020) 245-255

    Figure 4. Cyclic voltammograms of (a) CuxO      Figure 5. Comparison of the electro-oxidation behavior
     (b) NiO and (c) CuxO-NiO film electrode in     of CuxO-NiO film electrode in 0.1 M NaOH in(a) absence
             0.1 M NaOH (ν = 0.05 V/s)                 and (b) presence of 2.87 mM glucose (ν = 0.05 V/s)

   Oxidation of glucose started at about 0.45 V and caused an increase in current as observed. By
adding only 2.87 mM glucose, a current difference of about 0.43 mA has been observed, what is
observable on the current scale of mA and in accordance with chronoamperograms demonstrated
below. The electrons resulting from the oxidation of glucose transfer directly to the electrode
surface and result in the increase of anodic current at approximately 0.45 to 0.8 V during scanning.
During the potential scan, the modified electrode surface can be oxidized, while the deprotonation
of glucose molecules in an alkaline medium trigger isomerization to an enediol form, which then
oxidizes to gluconolactone and then further hydrolyzes to gluconic acid [28].
Amperometric detection of glucose at CuxO-NiO modified Cu electrode
   Figure 6 illustrates chronoamperograms of 0.05 M glucose at different electrode modifying
stages (before modifying, after anodizing and after electrodeposition), showing the effect of each
modifying step.

       Figure 6. CHA detection of 0.05 M glucose at (a) bare Cu electrode, (b) anodized Cu electrode,
                                 (c) anodized and cathodized Cu electrode

http://dx.doi.org/10.5599/jese.699                                                                         251
J. Electrochem. Sci. Eng. 10(3) (2020) 245-255 NON-ENZYMATIC DETERMINATION OF GLUCOSE
According to Figure 6, the best chronoamperogram with the highest current response is obtained
after fabricating CuxO-NiO modified Cu electrode. Finally, the fabricated non-enzymatic glucose
sensor is applied for real samples such as human blood serum and urine at optimized condition using
the CHA technique. The data of glucose evaluation in real samples obtained using the proposed
sensor and data obtained from the local hospital were in full accordance.
The optimized step potential for chronoamperometric measurements of glucose was determined
as 0.6 V. The chronoamperogram related to the addition of glucose into stirred 0.1 M NaOH solution
is shown in Figure 7a. It is obvious that increase of the concentration of glucose in the electrolyte
resulted in increase of the amperometric current value.
Figure 7. (a) CHA response of CuxO-NiO modified Cu electrode upon optimized conditions after
successive additions of glucose into 0.1 M NaOH, (b) relationship between current and glucose
concentration relevant to Figure 7a, and (c) the corresponding calibration curve for glucose.
The proposed sensor, however, lost its performance after the exposure to high concentrations
of glucose, what is probably due to destruction of its active sites. Thus, the sensor shows decreased
current values at high concentrations of glucose. Figure 7b demonstrates the relationship between
currents and glucose concentrations, while Figure 7c shows the corresponding calibration plot for
glucose concentration in a linear range from 0.04 to 5.76 mM.
Low limit of detection (LOD), equal to 0.0073 ± 4.16×10⁻⁴ mM and limit of quantification (LOQ) of
0.0243 ± 1.38×10⁻³ mM (signal/noise (S/N) = 3, n= 3 and confidence limit= 95 %) were determined. The
calculated sensitivity of the proposed sensor was 1.38 mA mM-1 cm-2 which is signifycantly higher
compared to data reported in previous studies for CoOOH nanosheets (0.34 mA mM-1 cm-2) [29], or
NiONPs/GO (1.09 mA mM-1 cm-2) [30]. In this work, the obtained LOD of 7.3 µM is much better than
252M. Hasanzadeh et al. J. Electrochem. Sci. Eng. 10(3) (2020) 245-255
obtained for CuxO-Cu (49 µM) and gold nanotube array electrodes (10 µM) [7,31]. The calibration
plot linearity range for our sensor is between 0.04 and 5.76 mM which is an order of magnitude
higher than for CuO nanoleaves/MWCNTs (0–0.9 mM) [32].
Results obtained after comparison of the performance of fabricated glucose sensor with other
enzyme less glucose sensors are shown in Table 2. It is seen in Table 2 that here proposed sensor is
superior among most of other compared sensors, what is mainly due to its high sensitivity, low LOD
and wide linear range.
Table 2. Analytical data for glucose evaluation of the proposed CuxO-NiO/Cu nanosensor
and other modified electrodes
Working electrode Linear range of Sensitivity, LOD, μM Ref.a
concentration, mM mA mM-1 cm-2
CuxO-NiO/Cu 0.04–5.76 1.38 7.3 This Work
CuO nanoleaves/MWCNTsb 0–0.9 0.6643 5.7 [32]
CuxO/polypyrrole 0–0.8 0.232 6.2 [33]
NiO-Cu 0.01–2.14 4.02 1.7 [14]
Cu cubes/MWCNTs 0.5–7.5 0.922 2.0 [34]
CuxO 0–6 1.62 49 [7]
Platinum oxide layers 1–10 0.0056 800 [35]
SiO2/C/CuO 0.02–20 0.472 0.06 [36]
ATCSNCc spheres 1–8.1 1.968 0.19 [37]
Pt@CNOsd 2–28 0.0216 90 [38]
Au/NiAu 0.005−31 0.483 1.0 [39]
Au@Cu2O 0.05−2.0 0.715 18 [40]
Cu@Ni 0.001–4.1 0.78 0.5 [23]
CuNi-NGre/GCE Up to 20 7.143 10 [19]
Polyaniline/zinc oxide/ MWCNTs 0.1–1, 1–6 7.83, 1.67 0.0001 [41]
a
Reference, bMulti-walled carbon nanotubes, cAg@TiO2 core-shell nano composite, dCarbon nano-onions,
e
CuNi-nitrogen doped graphene.
Selectivity and poison resistance of CuxO-NiO nanosensor
Selectivity against interfering species such as AA, UA and DA is crucial for a sensor. Amperometric
currents recorded upon addition of glucose and these interfering species are depicted in Figure 8,
showing the favorable selectivity of the proposed nanosensor for glucose monitoring. For most of
the non-enzymatic glucose sensors based on precious metals and alloys, however, the activity can
be easily lost due to the poisoning by chloride ions [9]. The amperometric current for CuxO-NiO
modified electrode toward glucose detection, however, is found almost constant in 0.1 M NaOH in
the presence and absence of 0.15 M NaCl. Therefore, the proposed sensor has demonstrated good
poison-resistance ability towards chloride ions.
Figure 8. CHA response of CuxO-NiO modified electrode upon addition of glucose, UA, AA and DA of equal
concentrations (0.05 M) and equal volumes of 1 ml into 0.1 M NaOH upon optimized condition.
http://dx.doi.org/10.5599/jese.699 253J. Electrochem. Sci. Eng. 10(3) (2020) 245-255 NON-ENZYMATIC DETERMINATION OF GLUCOSE
Stability and reproducibility of CuxO-NiO nanosensor
Stability and reproducibility should be checked for any proposed sensor. In the present paper,
stability of CuxO-NiO modified Cu electrode was monitored over the one month period. The sensor
was kept in the refrigerator (4 °C) and evaluated each day for ten consecutive days and every five days
over the next twenty days. After monitoring for one month, the sensor lost only 6.3 % of its efficiency
in glucose detection. Moreover, we studied the reproducibility of the developed nanosensor by
recording the amperometric current responses towards 0.6 mM glucose. Data of 7 parallel tests for
each analyte showed a relative standard deviation RSD, % of 5.1 ± 4.02 × 10⁻³. Thus, the proposed
non-enzymatic sensor showed favorable stability and reproducibility for glucose determination.
Conclusion
A new, simple, and low-cost electrochemical method is proposed for preparation of CuxO-NiO
nanofilm on a bare Cu electrode for enzyme-free glucose sensing. The high electro-catalytic
behavior could be attributed to the large electrochemical surface of the modified electrode, resulted
from electrodeposition of nanostructured particles. Moreover, the fabricated sensor showed high
sensitivity, a wide linear range, high stability (only 6.3 % decrease in performance in one-month time
period), favorable precision and accuracy. The results from the determination of glucose
concentration in blood serum and urine samples complied with those obtained from the local
hospital. Thus, this easily fabricated CuxO-NiO nanosensor, could be applied as a practical sensor for
routine analysis of glucose in clinical samples.
Acknowledgements: The authors appreciate Fasa University of Medical Sciences for financial
supports of this work.
References
[1] X. Niu, Y. Li, J. Tang, Biosensors and Bioelectronics 51 (2014) 22-28.
[2] S. R. Lee, Y. T. Lee, K. Sawada, Biosensors and Bioelectronics 24 (2008) 410-414.
[3] R. Wilson, A. P. F. Turner, Biosensors and Bioelectronics 7 (1992) 165-185.
[4] M. Willander, L. L. Yang, A. Wadeasa, Journal of Materials Chemistry 19 (2009) 1006-1018.
[5] S. Cosnier, R. E. Ionescu, M. Holzinger, Journal of Materials Chemistry 18 (2008) 5129-5133.
[6] S. Park, H. Boo, T. D. Chung, Analytica Chimica Acta 556(1) (2006) 46-57.
[7] C. Li, Y. Su, S. Zhang, Biosensors and Bioelectronics 26 (2010) 903-907.
[8] I. Kim, D. Kwon, D. Lee, T. H. Lee, J. H. Lee, G. Lee, D. S. Yoon, Biosensors and Bioelectronics 102 (2018)
617-623.
[9] C. M. Welch, R. G. Compton, Analytical and Bioanalytical Chemistry 384(3) (2006) 601-619.
[10] S. Park, T. D. Chung, H. C. Kim, Analytical Chemistry 75(13) (2003) 3046-3049.
[11] J. S. Ye, Y. Wen, W. D. Zhang, Electrochemistry Communications 6(1) (2004) 66-70.
[12] Y. Liu, H. Teng, H. Q. Hou, Biosensors and Bioelectronics 24 (2009) 3329-3334.
[13] H. Zhu, X. Lu, M. Li, Talanta 79(5) (2009) 1446-1453.
[14] M. Hasanzadeh, R. E. Sabzi, Current Chemistry Letters 4 (2015) 45-54.
[15] Y. Zhang, Y. Wang, J. Jia, Sensors and Actuators B: Chemical 171–172 (2012) 580-587.
[16] F. Cao, S. Guo, H. Y. Ma, Biosensors and Bioelectronics 26 (2011) 2756-2760.
[17] C. C. Li, Y. L. Liu, L. M. Li, Talanta 77(1) (2008) 455-459.
[18] L. Zhang, Y. H. Ni, H. Li, Microchimica Acta 171 (2010) 103-108.
[19] L. Shabnam, S. N. Faisal, A. K. Roy, A. I. Minett, V. G. Gomes, Electrochimica Acta 224 (2017) 295-305.
[20] L. Nei, Journal of Analytical Chemistry 367 (2000) 436-439.
[21] Y. He, G. Wei, J. Lin, M. Sun, Electroanalysis 29(4) (2017) 965-974.
[22] D. Wang, B. Huang, J. Liu, X. Guo, G. Abudukeyoumu, Y. Zhang, B. C. Ye, Y. Li, Biosensors and
Bioelectronics 102 (2018) 389-395.
254M. Hasanzadeh et al. J. Electrochem. Sci. Eng. 10(3) (2020) 245-255
[23] K. L. Wu, Y. M. Cai, B. B. Jiang, W. C. Cheong, X. W. Wei, W. Wang, N. Yu, RSC Advances 7 (2017) 21128-
21135.
[24] I. S. Ahn, T. H. Nam, S. R. Bae, Metals and Materials International 3(4) (1997) 260-264.
[25] N. Karthik, T. N. J. I. Edison, M. G. Sethuraman, Y. R. Lee, Applied Surface Science 396 (2017) 1245-1250.
[26] P. E. Sharel, D. Liu, R. A. Lazenby, J. Sloan, M. Vidotti, P. R. Unwin, J. V. Macpherson, The Journal of
Physical Chemistry C 120(29) (2016) 16059-16068.
[27] S. Cherevko, C. H. Chung, Talanta 80(3) (2010) 1371-1377.
[28] S. K. Meher, G. R. Rao, Nanoscale 5 (2013) 2089-2099.
[29] K. K. Lee, P. Y. Loh, C. H. Sow, Electrochemistry Communications 20 (2012) 128-132.
[30] A. Salimi, A. Noorbakhash, E. Sharifi, Biosensors and Bioelectronics 24 (2008) 792-798.
[31] Y. G. Zhou, S. Yang, Q. Y. Qian, Electrochemistry Communications 11(1) (2009) 216-219.
[32] Z. Y. Yang, J. S. Feng, J. S. Qiao, Analytical Methods 4 (2012) 1924-1926.
[33] F. H. Meng, W. Shi, Y. N. Sun, Biosensors and Bioelectronics 42 (2013) 141-147.
[34] J. Zhao, L. M. Wei, C. H.Peng, Biosensors and Bioelectronics 47 (2013) 86-91.
[35] A. Weremfo, S. T. C. Fong, A. Khan, D. B. Hibbert, C. Zhao, Electrochimica Acta 231 (2017) 20-26.
[36] A. Rahim, Z. U. Rehman, S. Mir, N. Muhammad, F. Rehman, M. H. Nawaz, M. Yaqub, S. A. Siddiqi, A. A.
Chaudhry, Journal of Molecular Liquids 248 (2017) 425-431.
[37] T. Dayakar, R. K. Venkateswara, M. Vinodkumar, K. Bikshalu, B. Chakradhar, R. K. Ramachandra, Applied
Surface Science 435 (2018) 216-224.
[38] J. Mohapatra, B. Ananthoju, V. Nair, A. Mitra, D. Bahadur, N. V. Medhekar, M. Aslam, Applied Surface
Science 442 (2018) 332-341.
[39] L. Wang, W. Zhu, W. Lu, X. Qin, X. Xu, Biosensors and Bioelectronics 111 (2018) 41-46.
[40] Y. Su, H. Guo, Z. Wang, Y. Long, W. Li, Y. Tu, Sensors and Actuators B: Chemical 255 (2018) 2510-2519.
[41] S. Mohajeri, A. Dolati, K. Yazdanbakhsh, Journal of Electrochemical Science and Engineering 9(2) (2019)
207-222.
©2020 by the authors; licensee IAPC, Zagreb, Croatia. This article is an open-access article
distributed under the terms and conditions of the Creative Commons Attribution license
(http://creativecommons. org/licenses/by/4.0/)
http://dx.doi.org/10.5599/jese.699 255You can also read