Direct measurements of the ionization profile in krypton helicon plasmas
←
→
Page content transcription
If your browser does not render page correctly, please read the page content below

Direct measurements of the ionization profile in krypton helicon plasmas
R. M. Magee, M. E. Galante, N. Gulbrandsen, D. W. McCarren, and E. E. Scime

Citation: Phys. Plasmas 19, 123506 (2012); doi: 10.1063/1.4772060
View online: http://dx.doi.org/10.1063/1.4772060
View Table of Contents: http://pop.aip.org/resource/1/PHPAEN/v19/i12
Published by the American Institute of Physics.

Related Articles
Single exposure three-dimensional imaging of dusty plasma clusters
Rev. Sci. Instrum. 84, 023501 (2013)
Hydrogen transport diagnostics by atomic and molecular emission line profiles simultaneously measured for
large helical device
Phys. Plasmas 20, 012514 (2013)
Time-and-space resolved comparison of plasma expansion velocities in high-power diodes with velvet cathodes
J. Appl. Phys. 113, 043307 (2013)
Development of a diffuse air-argon plasma source using a dielectric-barrier discharge at atmospheric pressure
Appl. Phys. Lett. 102, 033503 (2013)
Nonmonotonic radial distribution of excited atoms in a positive column of pulsed direct currect discharges in
helium
Appl. Phys. Lett. 102, 034104 (2013)

Additional information on Phys. Plasmas
Journal Homepage: http://pop.aip.org/
Journal Information: http://pop.aip.org/about/about_the_journal
Top downloads: http://pop.aip.org/features/most_downloaded
Information for Authors: http://pop.aip.org/authors

             Downloaded 05 Feb 2013 to 157.182.3.70. Redistribution subject to AIP license or copyright; see http://pop.aip.org/about/rights_and_permissions
PHYSICS OF PLASMAS 19, 123506 (2012)

Direct measurements of the ionization profile in krypton helicon plasmas
             R. M. Magee,1,a) M. E. Galante,1 N. Gulbrandsen,2 D. W. McCarren,1 and E. E. Scime1
             1
                 Department of Physics, West Virginia University, Morgantown, West Virginia 26506, USA
             2
                 Department of Physics and Technology, Faculty of Science, University of Tromsï, N-9037 Tromsï, Norway
             (Received 21 September 2012; accepted 28 November 2012; published online 17 December 2012)
             Helicons are efficient plasma sources, capable of producing plasma densities of 1019 m3 with only
             100 s W of input rf power. There are often steep density gradients in both the neutral density and
             plasma density, resulting in a fully ionized core a few cm wide surrounded by a weakly ionized
             plasma. The ionization profile is usually not well known because the neutral density is typically
             inferred from indirect spectroscopic measurements or from edge pressure gauge measurements. We
             have developed a two photon absorption laser induced fluorescence (TALIF) diagnostic capable of
             directly measuring the neutral density profile. We use TALIF in conjunction with a Langmuir
             probe to measure the ionization fraction profile as a function of driving frequency, magnetic field,
             and input power. It is found that when the frequency of the driving wave is greater than a critical
             frequency, fc  3 flh , where flh is the lower hybrid frequency at the antenna, the ionization fraction
             is small (0.1%) and the plasma density low (1017 m3 ). As the axial magnetic field is increased, or,
             equivalently, the driving frequency decreased, a transition is observed. The plasma density
             increases by a factor of 10 or more, the plasma density profile becomes strongly peaked, the neutral
             density profile becomes strongly hollow, and the ionization fraction in the core approaches 100%.
             Neutral depletion in the core can be caused by a number of mechanisms. We find that in these
             experiments the depletion is due primarily to plasma pressure and neutral pumping. V           C 2012

             American Institute of Physics. [http://dx.doi.org/10.1063/1.4772060]

I. INTRODUCTION                                                                                 light, xpe is the electron plasma frequency, B is the magnetic
                                                                                                field, and n is the plasma density. Measurements of plasma
     Helicons are simple and efficient sources of high purity
                                                                                                density versus input rf power show a discrete, stepwise
plasma. Efficient because relatively modest magnetic fields
                                                                                                increase in the former with the latter, a result of the admitted
(100 G) and input power (100 W) lead to high plasma
                                                                                                wavelengths of the dispersion relation.3
density (101819 m3 ), and high purity because they are free
                                                                                                     Accurate measurements of neutral density are a vital
of electrodes and the antenna is external to the plasma. For
                                                                                                component of helicon characterization because neutrals can
these reasons, helicons are attractive sources for industrial
                                                                                                influence the plasma in several ways: in weakly ionized plas-
plasma etching.
                                                                                                mas where the ion-neutral collision frequency is large, they
     The way in which the rf power is coupled to the plasma
                                                                                                mediate energy transfer from the wave to the plasma; they
depends on the operating regime. When the electron density
                                                                                                affect plasma transport—neutral depletion in the core can
is low, such that the electron skin depth is larger than the
                                                                                                lead to increased radial plasma transport;4 and, as in magnet-
system size, the plasma is unable to shield out the rf electric
                                                                                                ically confined fusion plasmas, ion-neutral charge exchange
field, and the electrons are directly accelerated. This regime
                                                                                                is a sink for ion thermal energy. Additionally, the neutral
is referred to as capacitive coupling. When the plasma
                                                                                                density must be known to accurately calculate the ionization
density is large enough that the skin depth is smaller than the
                                                                                                fraction, a key figure of merit for evaluating the efficiency of
system size, the energy is transferred from the rf to the
                                                                                                a plasma source.
plasma by the induction of currents, referred to as inductive
                                                                                                     The neutral density profile is difficult to measure directly.
coupling. As the plasma density continues to increase a
                                                                                                Measurements are often made at the edge with a pressure
second transition occurs when the helicon wave—a right-
                                                                                                gauge or by laser induced fluorescence of an excited metasta-
handed, circularly polarized, whistler-like wave with
                                                                                                ble state. Both of these require extrapolation—the first in
xci  x  xce —is supported by the plasma.1 This occurs
                                                                                                space, from the edge to the core, the second across states, from
when the helicon dispersion relation is satisfied2
                                                                                                an excited state to the ground state, usually done with a
                                     xce kjj kc2 B                                              collisional-radiative model.5 A direct measurement of the
                             x¼                  ;                                  (1)        ground state can be made using two photon absorption laser
                                       x2pe      n
                                                                                                induced fluorescence (TALIF).6 This diagnostic advancement
                                                                                                has recently been applied to xenon plasmas, where neutral
where xce is the electron cyclotron frequency, kjj is the paral-
                                                                                                depletion was observed and attributed to a combination of neu-
lel wavenumber, k is the total wavenumber, c is the speed of
                                                                                                tral pumping and neutral gas heating, although neutral temper-
                                                                                                ature measurements were not available.7,8 We investigate the
a)
     richard.magee@mail.wvu.edu.                                                                roles of these mechanisms in our plasmas in Sec. IV C.

1070-664X/2012/19(12)/123506/6/$30.00                                               19, 123506-1                                            C 2012 American Institute of Physics
                                                                                                                                            V

                      Downloaded 05 Feb 2013 to 157.182.3.70. Redistribution subject to AIP license or copyright; see http://pop.aip.org/about/rights_and_permissions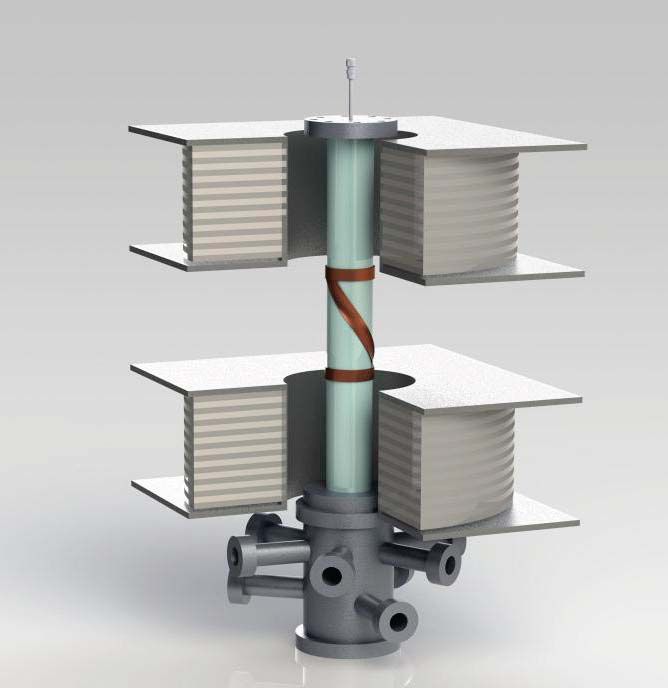
123506-2       Magee et al.                                                                                                                  Phys. Plasmas 19, 123506 (2012)

      The focus of this work is the comparison of conditions                                 results in emission at 826 nm, which is collected to infer the
in an inductively coupled mode to the conditions in a helicon                                absorption rate. The absorption rate is directly proportional to
mode in krypton plasma. Although the precise location of                                     the density of neutrals. TALIF has several advantages over
the transition from inductively coupled plasma (ICP) to heli-                                LIF: (1) the ground state is excited directly with a near-UV
con is difficult to identify visually because the change is                                  laser, (2) the measurement is localized without a perpendicu-
smooth and continuous, the differences at extrema are strik-                                 lar view by focusing the injected laser, and (3) Doppler-free
ing (see Figure 1). At low magnetic field (B < 600 G) or                                     measurements are possible by employing counter-propagating
high driving frequency (rf > 13:5 MHz), the plasma is nearly                                 beams (the data reported here are obtained using co-
uniform in color and brightness, a diffuse pink glow filling                                 propagating beams, so the Doppler-broadening is present).
the tube. At high magnetic or low driving frequency, a bright                                     The laser system is a Sirah CobraStretch dye laser
“core” appears: a bright blue column in the middle of the dif-                               pumped with a Spectra-Physics Quanta-Ray Pro 270
fuse pink background plasma. As the magnetic field is                                        Nd:YAG. The dye is a mixture of Rhodamine B and 101 opti-
increased or driving frequency decreased, the core becomes                                   mized for 612–615 nm. The output of the dye laser is then fre-
brighter, more distinct, and increases in axial extent.                                      quency tripled in two full width at half maximum (FWHM)
      We use the TALIF diagnostic and a Langmuir probe to                                    stages. The resulting UV light pulse has a temporal FWHM of
quantitatively characterize these distinct plasmas in terms of                               7 ns, pulse-to-pulse energy stability of 5%–7%, a Gaussian
the neutral and plasma density and temperature. In the ICP                                   spatial profile with r ¼ 1:7 mm, a spectral width of
mode, the neutral and plasma density profiles are relatively                                 Dk ¼ 0:1 cm1 , and a maximum energy of 8.5 mJ/pulse. The
flat and the ionization fraction is low. In the helicon mode,                                laser repetition rate is 20 Hz.
the neutral density profile is hollow, the plasma density pro-                                    The collected light is filtered with a band pass filter and
file is peaked, and the ionization fraction is high in the core.                             focused onto a photomultiplier tube (PMT; Hamamatsu
We also investigate mechanisms of neutral depletion. The                                     H11526-20-NF), whose output is amplified with a high
neutrals are substantially heated above room temperature to                                  speed, AC-coupled amplifier (Hamamatsu C5594). The
0.1–1.0 eV, but as the neutral temperature is observed to be                                 amplified signal is integrated and averaged with a Stanford
lower in helicon plasmas, neutral heating cannot be the sole                                 Research System Fast Gated Integrator and Boxcar Averager
depletion mechanism. The plasma pressure is however                                          (Model SR250). The laser wavelength and energy are simul-
peaked, indicating ion-neutral collisions may play a role in                                 taneously measured with a High Finesse WS7 wavemeter
neutral expulsion. Finally, a comparison of static fill and                                  and a Gentec Energy meter, respectively.
constant flow plasmas show that enhanced neutral pumping                                          The system is absolutely calibrated by filling the cham-
in the helicon mode influences the neutral profile.                                          ber to a known pressure of neutral krypton gas. Since the gas
                                                                                             is at the room temperature, the density is accurately calcu-
                                                                                             lated. A calibration factor (i.e., atoms per volt) is then
II. TALIF
                                                                                             derived from the measured TALIF signal.9
      TALIF is a variant of traditional laser induced fluores-                                    Each measurement is obtained by scanning the laser
cence (LIF). In this application, an injected UV laser pulse                                 wavelength through the transition wavelength. The PMT
excites a ground state transition in neutral krypton                                         voltage, laser energy, and laser wavelength are simultane-
(4p61 S0 ! 5p0 ½3=22 ) via the simultaneous absorption of two                               ously measured and the PMT signal is corrected for any vari-
photons. One subsequent decay mode (5p0 ½3=22 ! 5s0 ½1=21 )                                ation in laser energy (i.e., divided by measured energy
                                                                                             squared). A sample spectrum is shown in Figure 2. This par-
                                                                                             ticular scan corresponds to a neutral temperature of
                                                                                             T ¼ 0.45 eV and a neutral density of n ¼ 7:3  1020 m3 .
                                                                                                  There are several processes which can corrupt the criti-
                                                                                             cal linear scaling of TALIF signal with neutral density.
                                                                                             Among these are power saturation, self-quenching,10 and
                                                                                             pressure-broadening. We found in previous work that for

FIG. 1. The plasmas pictured above differ only in the strength of the applied                FIG. 2. A sample TALIF spectrum from Kr plasma. The x- and y-error bars
magnetic field: 60 G on the left and 1200 G on the right. No enhancements                    are the uncertainty in the wavelength and voltage measurements, respec-
to the image beyond the usual gamma correction have been applied.                            tively. In this case it was found that T ¼ 0.45 eV and n ¼ 7:3  1020 m3 .

                   Downloaded 05 Feb 2013 to 157.182.3.70. Redistribution subject to AIP license or copyright; see http://pop.aip.org/about/rights_and_permissions
123506-3 Magee et al. Phys. Plasmas 19, 123506 (2012)
FIG. 5. The core electron (blue diamonds; right y-axis) and neutral density
FIG. 3. The TALIF signal is proportional to the fill pressure over the range (black triangles; left y-axis) as a function of source magnetic field for
3–30 mT. rf ¼ 13.0 MHz and P ¼ 600 W. The error bars are the standard deviation of
the mean from several similar scans.
E < 200 lJ the laser power is below the saturation thresh- IV. RESULTS
old.9 Here, we confirm that the energy corrected signal from A. Parametric scans of core plasma and neutral
neutral krypton gas is proportional to the fill pressure across densities
the operating regime (see Figure 3). The same linear relation
was also measured in hydrogen plasma. In the following, we vary the magnetic field, the driving
frequency, and the rf power independently while holding all
III. COMPACT HELICON SOURCE other controllable parameters fixed. We observe the tightest
and brightest cores in plasmas at high magnetic field, low
The compact helicon source is composed of a Pyrex driving frequency, and high rf power.
tube with D ¼ 5 cm and L ¼ 60 cm threaded by an axial mag- In the case shown in Figure 5, the driving frequency is
netic field of 10–1000 G and wrapped with an m ¼ 1 helical 13.0 MHz, the rf power is 600 W, and the krypton gas is
antenna (Shoji type). The antenna couples 100 1000 W pumped in at a rate of 5 sccm resulting in a fill pressure of
of rf power to the plasma in the frequency range of 8–16 3 mT before the plasma is ignited. The current in the exter-
MHz. (The power is limited by the Pyrex. For P > 1 kW nal coils is then adjusted to produce a range of magnetic field
strong local electric fields arising from edges and points on strengths. (To maintain a good match between the imped-
the antenna result in holes being drilled through the Pyrex by ance of the rf amplifier and the antenna/plasma system, the
accelerated particles.) The bottom of the vertical Pyrex tube capacitance of an external matching network is adjusted. For
is connected to a cylindrical stainless steel expansion cham- all measurements the reflected power is less than 4 W.) The
ber with D ¼ 14 cm and L ¼ 25 cm, which is pumped from core neutral density remains fairly constant just below its ini-
below with a turbomolecular drag pump. The expansion tial fill level until the magnetic field reaches B 600 G
chamber has nine arms on which windows are mounted. All (magnetic field at the antenna), at which point it drops rap-
measurements reported here are performed within the expan- idly by a factor of 10. At the same critical field strength, the
sion chamber at z ¼ 35 cm, approximately 30 cm downstream core plasma density, measured with a planar tip, rf compen-
from the antenna (see Figure 4). The krypton fuel gas is fed sated Langmuir probe, begins to rise, reaching 3 1018 m3
from above the source. Typical plasma parameters from by 1200 G. The fact that the total number of particles (i.e.,
Langmuir probe measurements are ne 101012 cm3 and neutrals þ electrons) does not remain constant over the
Te 1 10 eV. Ion temperature data obtained with a retard- course of the experiment is due to the fact that this is a local-
ing field energy analyzer (RFEA) are Ti 0:1 1:0 eV. ized, core measurement, and the profile shapes are changing
substantially (see Sec. IV B).
If instead the driving frequency is varied while the other
parameters are held constant, similar behavior is seen (see
Figure 6). In this case the magnetic field is B ¼ 600 G, the rf
power is 600 W, and the krypton gas is pumped at a rate of 5
FIG. 4. The compact helicon source used in these experiments with key
components labeled is shown on the left. A calculation of the magnetic field FIG. 6. The core electron (blue diamonds; right y-axis) and neutral density
expansion is shown on the right. The location of the magnets is indicated by (black triangles; left y-axis) as a function of driving field for P ¼ 600 W and
the shaded regions and the location of the measurements by the solid hori- B ¼ 600 G. The error bars are the standard deviation of the mean from sev-
zontal line. eral similar scans.
Downloaded 05 Feb 2013 to 157.182.3.70. Redistribution subject to AIP license or copyright; see http://pop.aip.org/about/rights_and_permissions123506-4 Magee et al. Phys. Plasmas 19, 123506 (2012)
FIG. 7. The core electron (blue diamonds; right y-axis) and neutral density
(black triangles; left y-axis) as a function of rf power for rf ¼ 13.0 MHz and
B ¼ 600 G. The hollow triangles indicate where n0 < 2:0 1018 m3 .
sccm to give an initial fill pressure of 3 mT. Again, the ca-
pacitance of the matching circuit was adjusted to minimize
reflected power, in all cases less than 20 W. The neutral den-
sity is significantly lower at all frequencies relative to Figure
5, but a similar trend is evident: the neutral density rises
most sharply where the plasma density drops most sharply -
in this case rf 13:5 MHz.
Finally, Figure 7 illustrates the trend in densities with
input rf power (for B ¼ 1200 G, rf ¼ 13.0 MHz). For FIG. 8. Neutral (black triangles; left y-axis) and electron (blue diamonds;
right y-axis) density profiles for two different plasma conditions: B ¼ 600 G,
P < 200 W, the ionization fraction is very low, and the neu- rf ¼ 13 MHz, P ¼ 600 W (top) and B ¼ 1200 G, rf ¼ 11.0 MHz, P ¼ 800 W
tral density curiously appears to increase with increasing (bottom).
power. But at P 300 W the neutral density drops and the
plasma density sharply increases (more sharply than in the mode, the electron density profile becomes very peaked, so
previous 2 parameter scans). The trend, which looks to con- that the density in the core is ten times the density at the edge.
tinue beyond the maximum power, results in an ionization The neutral density profile on the other hand, is extremely hol-
fraction of 99% at 1 kW. low—the core density is 1/20th of that at the edge.
Both the magnetic field scan and the frequency scan The combined effects of the plasma density rising and
indicate that the plasma production efficiency increases the neutral density dropping result in a dramatic change in
when rf < 2:8 flh , where flh is the lower hybrid frequency cal- the ionization fraction, defined here as, ne =ðne þ n0 Þ. Shown
culated using the magnetic field strength at the antenna. Pre- in Figure 9 are the ionization fraction profiles for the data in
vious work, both theoretical11 and experimental,12 has Figure 8. In the helicon case, the nearly fully ionized core
reported that the transition occurs at rf ¼ flh . In our case, the transitions to a weakly ionized edge (3%) in 7 cm. The radial
magnetic field strength at the center of the coils is larger than location of this transition is only partially due to the expan-
at the antenna, and there, at the location of maximum field sion of the magnetic field. It can be seen in Figure 4 that field
strength, the resonance condition is nearly satisfied. Our lines at the very edge of the source (r ¼ 2.5 cm) end up at
result may therefore be consistent with previous work. The r ¼ 5 cm at the measurement location. This implies there is
transition to higher ionization is thought to arise because of cross-field transport.
the nature of the dispersion relation near the lower hybrid
resonance. The cold plasma dispersion relation supports two C. Interpretation
wave solutions for large magnetic fields: a fast wave (the hel-
icon wave) and a slow wave (the Trivelpiece-Gould wave). Hollow radial profiles of neutral density in a helicon
pffiffiffiffiffiffiffiffiffiffiffiffiffi source have been observed before,7,8,13 although the precise
At the lower hybrid resonance, xlh xce xci , the perpen-
dicular wavenumber of the slow wave becomes large and mechanics of neutral depletion remain a subject of debate. In
dominated by a negative imaginary component, so that
damping occurs (caclulations show that for these plasma
conditions Landau damping dominates collisional damping).
The data presented here support this picture.
B. Plasma and neutral density profiles
The plasma and neutral density profiles in the different
operating modes vary in both magnitude and character. In
ICPs, the neutral density is much larger than the plasma den-
sity, so that the pressure is dominated by the neutral pressure
and the ionization fraction is small, on the order of 103 . Both
the plasma and neutral profiles are fairly flat, although the neu- FIG. 9. Ionization fraction profiles for the two plasma conditions plotted in
tral density profile may be considered slightly hollow and the Figure 8. As the magnetic field and power are increased and the frequency
plasma density drops at the edge (see Figure 8). In the helicon reduced, the ionization fraction ðne =ðne þ n0 ÞÞ increases.
Downloaded 05 Feb 2013 to 157.182.3.70. Redistribution subject to AIP license or copyright; see http://pop.aip.org/about/rights_and_permissions123506-5 Magee et al. Phys. Plasmas 19, 123506 (2012)
the simplest picture, the depletion is due to neutral gas heat-
ing: an increase in neutral temperature requires a commensu-
rate drop in neutral density to maintain radial pressure
balance.8,13 This picture does not account for the fact that in
a flowing discharge the pumping efficiency may be a func-
tion of plasma parameters.8 Previous work has inferred a
plasma flow from axial measurements of density and temper-
ature.14 Although we do not have measurements of axial var-
iation in the present work, data from a Mach probe indicate
that such a flow may exist. In the following sections, we dis-
cuss the phenomena of neutral heating and neutral pumping
FIG. 11. The neutral temperature profiles in the ICP (upside down red trian-
in producing the observed neutral density profiles. gles) and the helicon mode (black triangles).
1. Neutral heating
duce hollow neutral density profiles. When a neutral atom
Because our laser line width is smaller than the Doppler drifts from the edge into the highly ionized core, it is likely
width, we are able to measure the neutral temperature. We to be ionized by electron impact. It can then diffuse to the
find that as the core neutral density drops with increasing end of the chamber along magnetic field lines, recombine,
source magnetic field strength, the core neutral temperature and be pumped out. The short lifetime of neutrals in the high
also drops (see Figure 10). We also compare the temperature ionization region results in a depletion of neutral density rel-
profile for the plasma with a flat neutral density profile and ative to the edge.15
low ionization to one with a hollow neutral density profile We see direct evidence for a plasma flow at high mag-
and high ionization (the same data from Figures 8 and 9). netic field strengths. The planar tip Langmuir probe used for
We find the neutral temperature to be a factor of 2 and 3 density measurements is insulated on one face, so that it may
lower in the high ionization case, and, in fact, the tempera- also be used as a Mach probe. We find that the ion saturation
ture profile is (slightly) more hollow (see Figure 11). This is current (Ii;sat ) measurement is direction dependent only for
contrary to the commonly held expectation that neutrals are B > 700 G, where Ii;sat is larger when the probe is facing
heated in the core and pressure balance requires the density upstream than downstream, as shown in Figure 12. This
to drop in proportion.8,13 One interpretation of this observa- implies a downward directed flow for conditions with a hol-
tion is that there is a mechanism preferentially removing low neutral density profile, the magnitude of which can be
high energy neutrals (neutral pumping, for example), lower- calculated with standard Mach probe theory. Because the ion
ing the temperature of those which remain. This is investi- gyroradius (1–10 cm) is larger than the radius of the probe
gated in the following section by comparing flowing and (0.3 cm), we apply the unmagnetized Machffi probe calibration
pffiffiffiffiffiffiffiffiffiffiffiffiffiffi up down 16
static discharges. (k ¼ 1.34) to obtain, v ¼ 0:746 ZTe =mi lnðIi;sat =Ii;sat Þ.
The Ii;sat data are first fit to a simple quadratic to obtain a
2. Neutral pumping smooth function (black and purple solid lines in Figure 12).
We then apply the above expression to calculate the
Sometimes called ion pumping, this mechanism relies
velocity, v ¼ 1 – 2 km/s. (In these plasmas, cs 3:3 km=s, so
on the restricted motion of ions in a magnetic field to pro-
M 0:3 0:6.)
To investigate the role of this mechanism in producing
the hollow neutral density profiles seen at high magnetic
fields, we repeated the magnetic field scan of Figure 5, but
with a static fill, where the chamber is filled to a pressure of
6 mT and valved off. We observe three clear trends. First,
the core neutral density does not decrease with increasing
magnetic field (see Figure 13). This is evidence that neutral
FIG. 12. The ion saturation current collected by a directional probe is larger
FIG. 10. The core neutral density (top) and core neutral temperature (bot- when the probe is facing upward (black squares) than when it is facing
tom) as a function of source magnetic field for plasma with 650 W of downward (purple circles) only for B > 700 G. The implied plasma flow is
13.0 MHz rf. As the neutral density is depleted, the temperature drops. plotted in orange (right y-axis). See text for details of calculation.
Downloaded 05 Feb 2013 to 157.182.3.70. Redistribution subject to AIP license or copyright; see http://pop.aip.org/about/rights_and_permissions123506-6 Magee et al. Phys. Plasmas 19, 123506 (2012)
neutral heating, as the neutral temperature is actually lower
there relative to the low field case (Figures 10 and 11). It
may be due to neutral pumping, as the depletion of core
neutrals is not observed in static fill cases in where the pres-
sure is held constant (Figure 13).
ACKNOWLEDGMENTS
FIG. 13. The core neutral density (black triangles; left y-aixs) and core
This work was funded by the US Department of Energy
plasma density (blue diamonds; right y-axis) as a function of magnetic field, through Grant No. DE-SC0004736.
similar to Figure 5, but as a static fill. It can be seen that the neutral density
does not decrease at high field strengths, as in the flowing case. 1
A. R. Ellingboe and R. W. Boswell, “Capacitive, inductive and helicon-
wave modes of operation of a helicon plasma source,” Phys. Plasmas 3,
pumping is at least partially responsible for the observed 2797–2804 (1996).
2
depletion. Second, in the static case, the discrete nature of F. F. Chen, “Plasma ionization by helicon waves,” Plasma Phys. Con-
trolled Fusion 33, 339–364 (1991).
the modes is evident, and the multiple plasma density meas- 3
P. A. Keiter, E. E. Scime, and M. M. Balkey, “Frequency dependent
urements taken at each magnetic field have not been aver- effects in helicon plasmas,” Phys. Plasmas 4, 2741–2747 (1997).
4
aged to illustrate that behavior. For example, the plasma A. Fruchtman, G. Makrinich, P. Chabert, and J. M. Rax, “Enhanced plasma
density jumps from less than 1 to 3 1018 m3 at 530 G, 5
transport due to neutral depletion,” Phys. Rev. Lett. 95, 115002 (2005).
A. M. Keese and E. E. Scime, “Neutral density profiles in argon helicon
and then back down at 600 G. Although the mode strongly plasmas,” Plasma Sources Sci. Technol. 16, 742–749 (2007).
depends on the magnetic field, other parameters (most nota- 6
J. Bokor, R. Freeman, J. White, and R. Storz, “Two-photon excitation of
bly input power) play a role, so that near the transition, the n ¼ 3 level in H and D atoms,” Phys. Rev. A 24, 612–614 (1981).
7
small changes to the match can cause the plasma to jump A. Aanesland, L. Liard, G. Leray, J. Jolly, and P. Chabert, “Direct meas-
urements of neutral density depletion by two-photon absorption laser-
back and forth. Finally, we note that the maximum plasma induced fluorescence spectroscopy,” Appl. Phys. Lett. 91, 121502 (2007).
densities achieved are higher than those in flowing plasmas 8
L. Liard, A. Aanesland, and P. Chabert, “Dynamics of neutral gas deple-
for similar parameters, confirmation of previous helicon tion investigated by time- and space-resolved measurements of xenon
atom ground state density,” J. Phys. D: Appl. Phys. 45, 235201 (2012).
results.17 9
R. M. Magee, M. E. Galante, D. McCarren, E. E. Scime, R. L. Boivin, N.
H. Brooks, R. J. Groebner, D. N. Hill, and G. D. Porter, “A two photon
V. SUMMARY absorption laser-induced fluorescence diagnostic for fusion plasmas,” Rev.
Sci. Instrum. 83, 10D701 (2012).
We report measurements of the neutral density and ion- 10
L. Cherigier, U. Czarnetzki, D. Luggenholscher, V. S. von der Gathen, and
ization fraction profiles in a krypton helicon plasma as a H. F. Dobele, “Absolute atomic hydrogen densities in a radio frequency
function of source parameters. The neutral density measure- discharge measured by two-photon laser induced fluorescence imaging,” J.
Appl. Phys. 85, 696–702 (1999).
ments are performed with TALIF, which represents a 11
S. Cho, “The role of the lower hybrid resonance in helicon plasmas,”
diagnostic improvement over traditional LIF as the meas- Phys. Plasmas 7, 417–423 (2000).
12
urements are directly of the ground state and highly local- J. L. Kline, E. E. Scime, R. F. Boivin, A. M. Keese, and X. Sun, “Slow
ized. We find that as driving frequency is decreased below wave ion heating in the helix helicon source,” Plasma Sources Sci. Tech-
nol. 11, 413–425 (2002).
a critical frequency, fc 3 flh (Figure 6), or the magnetic 13
M. Shimada, G. R. Tynan, and R. Cattolica, “Neutral gas density depletion
field increased so that the same relative frequency condition due to neutral gas heating and pressure balance in an inductively coupled
is achieved (Figure 5), the neutral density drops and the plasma,” Plasma Sources Sci. Technol. 16, 193–199 (2007).
14
C. M. Denning, M. Wiebold, and J. E. Scharer, “Observations of neutral
electron density increases. In the high field case, the neutral
depletion and plasma acceleration in a flowing high-power argon helicon
density profile is hollow, such that the core density is 1/ plasma,” Phys. Plasmas 15, 072115 (2008).
20th the edge density, and the plasma density is peaked 15
J. Gilland, R. Breun, and N. Hershkowitz, “Neutral pumping in a helicon
(Figure 8). These effects combine to give nearly complete discharge,” Plasma Sources Sci. Technol. 7, 416–422 (1998).
16
I. H. Hutchinson, “Ion collection by a sphere in a flowing plasma: I.
ionization in the core (Figure 9), while the ionization in the
quasineutral,” Plasma Phys. Controlled Fusion 44, 1953–1977 (2002).
edge remains modest (a few percent). The neutral depletion 17
S. Houshmandyar and E. E. Scime, “Enhanced neutral depletion in a static
observed in the high field case does not appear to be due to helium helicon discharge,” Plasma Sources Sci. Technol. 21, 035008 (2012).
Downloaded 05 Feb 2013 to 157.182.3.70. Redistribution subject to AIP license or copyright; see http://pop.aip.org/about/rights_and_permissionsYou can also read