Cat Head Detection - How to Effectively Exploit Shape and Texture Features
←
→
Page content transcription
If your browser does not render page correctly, please read the page content below
Cat Head Detection - How to Effectively Exploit Shape
                and Texture Features

                        Weiwei Zhang1, Jian Sun1 , and Xiaoou Tang2
                             1
                              Microsoft Research Asia, Beijing, China
                           {weiweiz,jiansun}@microsoft.com
    2
        Dept. of Information Engineering, The Chinese University of Hong Kong, Hong Kong
                                  xtang@ie.cuhk.edu.hk

         Abstract. In this paper, we focus on the problem of detecting the head of cat-like
         animals, adopting cat as a test case. We show that the performance depends cru-
         cially on how to effectively utilize the shape and texture features jointly. Specifi-
         cally, we propose a two step approach for the cat head detection. In the first step,
         we train two individual detectors on two training sets. One training set is normal-
         ized to emphasize the shape features and the other is normalized to underscore
         the texture features. In the second step, we train a joint shape and texture fusion
         classifier to make the final decision. We demonstrate that a significant improve-
         ment can be obtained by our two step approach. In addition, we also propose a set
         of novel features based on oriented gradients, which outperforms existing leading
         features, e. g., Haar, HoG, and EoH. We evaluate our approach on a well labeled
         cat head data set with 10,000 images and PASCAL 2007 cat data.

1 Introduction

Automatic detection of all generic objects in a general scene is a long term goal in im-
age understanding and remains to be an extremely challenging problem duo to large
intra-class variation, varying pose, illumination change, partial occlusion, and cluttered
background. However, researchers have recently made significant progresses on a par-
ticularly interesting subset of object detection problems, face [14,18] and human detec-
tion [1], achieving near 90% detection rate on the frontal face in real-time [18] using
a boosting based approach. This inspires us to consider whether the approach can be
extended to a broader set of object detection applications.
   Obviously it is difficult to use the face detection approach on generic object detection
such as tree, mountain, building, and sky detection, since they do not have a relatively
fixed intra-class structure like human faces. To go one step at a time, we need to limit
the objects to the ones that share somewhat similar properties as human face. If we can
succeed on such objects, we can then consider to go beyond. Naturally, the closest thing
to human face on this planet is animal head. Unfortunately, even for animal head, given
the huge diversity of animal types, it is still too difficult to try on all animal heads. This
is probably why we have seen few works on this attempt.
   In this paper, we choose to be conservative and limit our endeavor to only one type
of animal head detection, cat head detection. This is of course not a random selection.

D. Forsyth, P. Torr, and A. Zisserman (Eds.): ECCV 2008, Part IV, LNCS 5305, pp. 802–816, 2008.

c Springer-Verlag Berlin Heidelberg 2008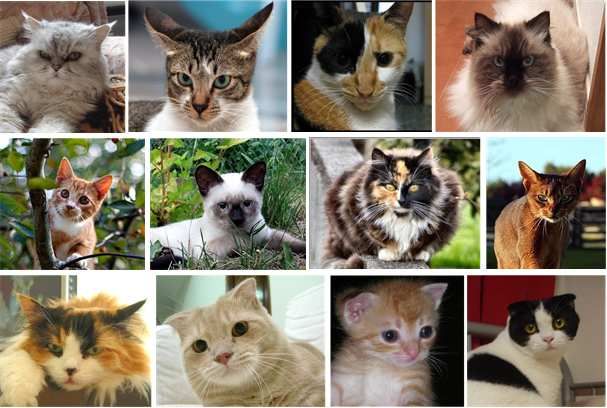
Cat Head Detection - How to Effectively Exploit Shape and Texture Features   803

              (a) cat-like animal                                  (b) cats

                  Fig. 1. Head images of animals of the cat family and cats

Our motivations are as follows. First, cat can represent a large category of cat-like an-
imals, as shown in Figure 1 (a). These animals share similar face geometry and head
shape; Second, people love cats. A large amount of cat images have been uploaded and
shared on the web. For example, 2,594,329 cat images had been manually annotated
in flickr.com by users. Cat photos are among the most popular animal photos on the
internet. Also, cat as a popular pet often appears in family photos. So cat detection can
find applications in both online image search and offline family photo annotation, two
important research topics in pattern recognition. Third, given the popularity of cat pho-
tos, it is easy for us to get training data. The research community does need large and
challenging data set to evaluate the advances of the object detection algorithm. In this
paper, we provide 10,000, well labeled cat images. Finally and most importantly, the cat
head detection poses new challenges for object detection algorithm. Although it shares
some similar property with human face so we can utilize some existing techniques, the
cat head do have much larger intra-class variation than the human face, as shown in
Figure 1 (b), thus is more difficult to detect.
    Directly applying the existing face detection approaches to detect the cat head has
apparent difficulties. First, the cat face has larger appearance variations compared with
the human face. The textures on the cat face are more complicated than those on the
human face. It requires more discriminative features to capture the texture information.
Second, the cat head has a globally similar, but locally variant shape or silhouette. How
to effectively make use of both texture and shape information is a new challenging issue.
It requires a different detection strategy.
    To deal with the new challenges, we propose a joint shape and texture detection ap-
proach and a set of new features based on oriented gradients. Our approach is a two step
approach. In the first step, we individually train a shape detector and a texture detector
to exploit the shape and appearance information respectively. Figure 2 illustrates our
basic idea. Figure 2 (a) and Figure 2 (c) are two mean cat head images over all training
images: one aligned by ears to make the shape distinct; the other is aligned to reveal the
texture structures. Correspondingly, the shape and texture detectors are trained on two
differently normalized training sets. Each detector can make full use of most discrimi-
native shape or texture features separately. Based on a detailed study of previous image
and gradient features, e.g., Haar [18], HoG [1], EOH [7], we show that a new set of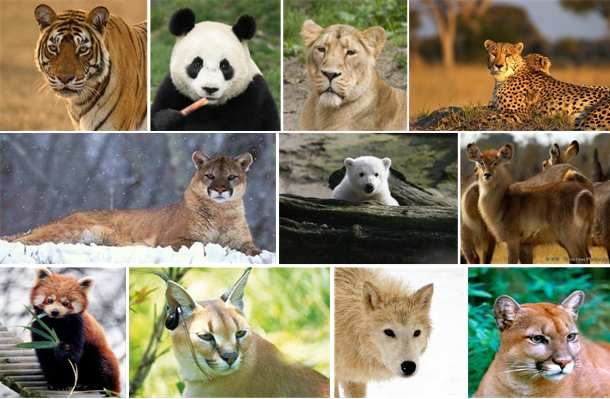
804      W. Zhang, J. Sun, and X. Tang

                        Shape                                     Texture

                         (a)                   (b)                    (c)

Fig. 2. Mean cat head images on all training data. (a) aligned by ears. More shape information is
kept. (b) aligned by both eyes and ears using an optimal rotation+scale transformation. (c) aligned
by eyes. More texture information is kept.

carefully designed Haar-like features on oriented gradients give the best performance
in both shape and texture detectors.
   In the second step, we train a joint shape and texture detector to fuse the outputs
of the above two detectors. We experimentally demonstrate that the cat head detection
performance can be substantially improved by carefully separating shape and texture
information in the first step, and jointly training a fusion classifier in the second step.

1.1 Related Work
Since a comprehensive review of the related works on object detection is beyond the
scope of the paper, we only review the most related works here.
Sliding window detection vs. parts based detection. To detect all possible objects
in the image, two different searching strategies have been developed. The sliding win-
dow detection [14,12,18,1,17,15,20] sequentially scans all possible sub-windows in the
image and makes a binary classification on each sub-window. Viola and Jones [18] pre-
sented the first highly accurate as well as real-time frontal face detector, where a cascade
classifier is trained by AdaBoost algorithm on a set of Haar wavelet features. Dalal and
Triggs [1] described an excellent human detection system through training a SVM clas-
sifier using HOG features. On the contrary, the parts based detection [5,13,9,6,3] detects
multiple parts of the object and assembles the parts according to geometric constrains.
For example, the human can be modeled as assemblies of parts [9,10] and the face can
be detected using component detection [5].
    In our work, we use two sliding windows to detect the “shape” part and “texture”
part of the cat head. A fusion classifier is trained to produce the final decision.
Image features vs. gradient features. Low level features play a crucial role in the
object detection. The image features are directly extracted from the image, such as
intensity values [14], image patch [6], PCA coefficients [11], and wavelet coefficients
[12,16,18]. Henry et al.[14] trained a neural network for human face detection using
the image intensities in 20 × 20 sub-window. Haar wavelet features have become very
popular since Viola and Jones [18] presented their real-time face detection system. The
image features are suitable for small window and usually require a good photometric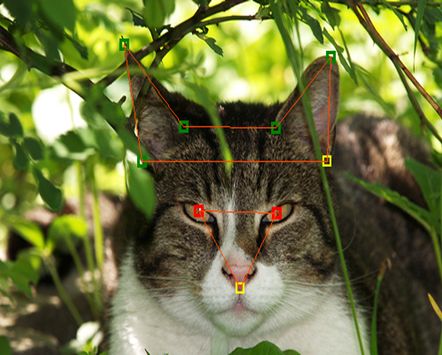
Cat Head Detection - How to Effectively Exploit Shape and Texture Features     805

normalization. Contrarily, the gradient features are more robust to illumination changes.
The gradient features are extracted from the edge map [4,3] or oriented gradients, which
mainly include SIFT [8], EOH [7], HOG [1], covariance matrix[17], shapelet [15], and
edgelet [19]. Tuzel et al. [17] demonstrated very good results on human detection using
the covariance matrix of pixel’s 1st and 2nd derivatives and pixel position as features.
Shapelet [15] feature is a weighted combination of weak classifiers in a local region. It
is trained specifically to distinguish between the two classes based on oriented gradients
from the sub-window. We will give a detailed comparison of our proposed features with
HOG and EOH features in Section 3.1.

2 Our Approach – Joint Shape and Texture Detection
The accuracy of a detector can be dramatically improved by first transforming the object
into a canonical pose to reduce the variability. In face detection, all training samples are
normalized by a rotation+scale transformation. The face is detected by scanning all sub-
windows with different orientations and scales. Unfortunately, unlike the human face,
the cat head cannot be well normalized by a rotation+scale transformation duo to the
large intra-class variation.
   In Figure 2, we show three mean cat head images over 5,000 training images by
three normalization methods. In Figure 2 (a), we rotate and scale the cat head so that
both eyes appear on a horizontal line and the distance between two ears is 36 pixels.
As we can see, the shape or silhouette of the ears is visually distinct but the textures in
the face region are blurred. In a similar way, we compute the mean image aligned by
eyes, as shown in Figure 2 (c). The textures in the face region are visible but the shape
of the head is blurred. In Figure 2 (b), we take a compromised method to compute an
optimal rotation+scale transformation for both ears and eyes over the training data, in a
least square sense. As expected, both ears and eyes are somewhat blurred.
   Intuitively, using the optimal rotation+scale transformation may produce the best re-
sult because the image normalized by this method contains two kinds of information.
However, the detector trained in this way does not show superior performance in our ex-
periments. Both shape and texture information are lost to a certain degree. The discrim-
inative power of shape features or texture features is hurt by this kind of compromised
normalization.

2.1 Joint Shape and Texture Detection
In this paper, we propose a joint shape and texture detection approach to effectively
exploit the shape and texture features. In the training phase, we train two individual
detectors and a fusion classifier:
 1. Train a shape detector, using the aligned training images by mainly keeping the
    shape information, as shown in Figure 2 (a); train a texture detector, using the
    aligned training image by mainly preserving the texture information, as shown in
    Figure 2 (c). Thus, each detector can capture most discriminative shape or texture
    features respectively.
 2. Train a joint shape and texture fusion classifier to fuse the output of the shape and
    texture detectors.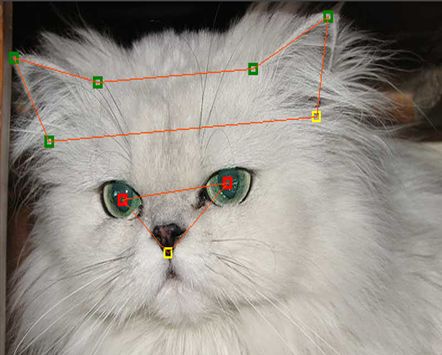
806      W. Zhang, J. Sun, and X. Tang

   In the detection phase, we first run the shape and texture detectors independently.
Then, we apply the joint shape and texture fusion classifier to make the final decision.
Specifically, we denote {cs , ct } as output scores or confidences of the two detectors,
and {fs , ft } as extracted features in two detected sub-windows. The fusion classifier is
trained on the concatenated features {cs , ct , fs , ft }.
   Using two detectors, there are three kinds of detection results: both detectors re-
port positive at roughly the same location, rotation, and scale; only the shape detector
reports positive; and only the texture detector reports positive. For the first case, we
directly construct the features {cs , ct , fs , ft } for the joint fusion classifier. In the sec-
ond case, we do not have {ct , ft }. To handle this problem, we scan the surrounding
locations to pick a sub-window with the highest scores by the texture detector, as il-
lustrated in Figure 3. Specifically, we denote the sub-window reported by the detector
as [x, y, w, h, s, θ], where (x, y) is window’s center, w, h are width and height, and s, θ
are scale and rotation level. We search sub-windows for the texture/shape detector in
the range [x ± w/4] × [y ± h/4] × [s ± 1] × [θ ± 1]. Note that we use real value score of
the texture detector and do not make 0-1 decision. The score and features of the picked
sub-window are used for the features {ct , ft }. For the last case, we compute {cs , fs } in
a similar way.
   To train the fusion classifier, 2,000 cat head images in the validation set are used as
the positive samples, and 4,000 negative samples are bootstrapped from 10,000 non-cat
images. The positive samples are constructed as usual. The key is the construction of the
negative samples which consist of all incorrectly detected samples by either the shape
detector or the texture detector in the non-cat images. The co-occurrence relationship
of the shape features and texture features are learned by this kind of joint training. The
learned fusion classifier is able to effectively reject many false alarms by using both
shape and texture information. We use support vector machine (SVM) as our fusion
classifier and HOG descriptors as the representations of the features fs and ft .
   The novelty of our approach is the discovery that we need to separate the shape
and texture features and how to effectively separate them. The latter experimental re-
sults clearly validate the superiority of our joint shape and texture detection. Although
the fusion method might be simple at a glance, this is exactly the strength of our ap-
proach: a simple fusion method already worked far better than previous non-fusion
approaches.

                 {cs , fs }           {ct , ft }   {ct , ft }         {cs , fs }

                                (a)                             (b)

Fig. 3. Feature extraction for fusion. (a) given a detected sub-window (left) by the shape detector,
we search a sub-window (right, solid line) with highest score by the texture detector in sur-
rounding region (right, dashed line). The score and features {ct , ft } are extracted for the fusion
classifier. (b) similarly, we extract the score and features {cs , fs } for the fusion.
Cat Head Detection - How to Effectively Exploit Shape and Texture Features     807

3 Haar of Oriented Gradients

To effectively capture both shape and texture information, we propose a set of new
features based on oriented gradients.

3.1 Oriented Gradients Features

Given the image I, the image gradient −
                                      →
                                      g (x) = {gh , gv } for the pixel x is computed as:

                      gh (x) = Gh ⊗ I(x), gv (x) = Gv ⊗ I(x),                           (1)

where Gh and Gv are horizontal and vertical filters, and ⊗ is convolution operator. A
bank of oriented gradients {gok }K                                               →
                                                                                 −
                                 k=1 are constructed by quantifying the gradient g (x)
on a number of K orientation bins:

                                      |−
                                       →g (x)| θ(x) ∈ bink
                          go (x) =
                           k
                                                           ,                       (2)
                                      0        otherwise

where θ(x) is the orientation of the gradient − →g (x). We call the image gok oriented
gradients channel. Figure 4 shows the oriented gradients on a cat head image. In this
example, we quantify the orientation into four directions. We also denote the sum of
oriented gradients of a given rectangular region R as:

                                   S k (R) =         gok (x).                           (3)
                                               x∈R

It can be very efficiently computed in a constant time using integral image technique [18].
    Since the gradient information at an individual pixel is limited and sensitive to noise,
most of previous works aggregate the gradient information in a rectangular region to
form more informative, mid-level features. Here, we review two most successful fea-
tures: HOG and EOH.

                    Fig. 4. Oriented gradients channels in four directions
808        W. Zhang, J. Sun, and X. Tang

HOG-cell. The basis unit in the HOG descriptor is the weighted orientation histogram
of a “cell” which is a small spatial region, e.g., 8 × 8 pixels. It can be represented as:

                       HOG-cell(R) = [S 1 (R), ..., S k (R), ..., S K (R)].                        (4)

The overlapped cells (e.g., 4 × 4) are grouped and normalized to form a larger spatial
region called “block”. The concatenated histograms form the HOG descriptor.
   In Dalal and Triggs’s human detection system [1], a linear SVM is used to classify
a 64 × 128 detection window consisting of multiple overlapped 16 × 16 blocks. To
achieve near real-time performance, Zhu et al. [21] used HOGs of variable-size blocks
in the boosting framework .

EOH. Levi and Weiss [7] proposed three kinds of features on the oriented gradients:
                      EOH1 (R, k1, k2) = (S k1 (R) + )/(S k2 (R) + ),

                      EOH2 (R, k) = (S k (R) + )/( j (S j (R) + )),

                      EOH3 (R, R, k) = (S k (R) − S k (R))/sizeof (R),

where R is the symmetric region of R with respect to the vertical center of the detection
window, and  is a small value for smoothing. The first two features capture whether
one direction is dominative or not, and the last feature is used to find symmetry or the
absence of symmetry. Note that using EOH features only may be insufficient. In [7],
good results are achieved by combining EOH features with Haar features on image
intensity.

      Fig. 5. Haar of Oriented Gradients. Left: in-channel features. Right: orthogonal features.

3.2 Our Features - Haar of Oriented Gradients
In face detection, the Haar features demonstrated their great ability to discover local
patterns - intensity difference between two subregions. But it is difficult to find dis-
criminative local patterns on the cat head which has more complex and subtle fine scale
textures. On the contrary, the above oriented gradients features mainly consider the
marginal statistics of gradients in a single region. It effectively captures fine scale tex-
ture orientation distribution by pixel level edge detection operator. However, it fails to
capture local spatial patterns like the Haar feature. The relative gradient strength be-
tween neighboring regions is not captured either.
   To capture both the fine scale texture and the local patterns, we need to develop a set
of new features combining the advantage of both Haar and gradient features. Taking a
Cat Head Detection - How to Effectively Exploit Shape and Texture Features    809

close look at Figure 4, we may notice many local patterns in each oriented gradients
channel which is sparser and clearer than the original image. We may consider that
the gradient filter separates different orientation textures and pattern edges into several
channels thus greatly simplified the pattern structure in each channel. Therefore, it is
possible to extract Haar features from each channel to capture the local patterns. For
example, in the horizontal gradient map in Figure 4, we see that the vertical textures
between the two eyes are effectively filtered out so we can easily capture the two eye
pattern using Haar features. Of course, in addition to capturing local patterns within a
channel, we can also capture more local patterns across two different channels using
Haar like operation. In this paper, we propose two kinds of features as follows:
In-channel features
                                               S k (R1 ) − S k (R2 )
                      HOOG1 (R1 , R2 , k) =                          .                 (5)
                                               S k (R1 ) + S k (R2 )
These features measure the relative gradient strength between two regions R1 and R2
in the same orientation channel. The denominator plays a normalization role since we
do not normalize S k (R).
Orthogonal-channel features
                                                                ∗
                                                 S k (R1 ) − S k (R2 )
                    HOOG2 (R1, R2, k, k ∗) =                            ,              (6)
                                                 S k (R1 ) + S k∗ (R2 )
where k ∗ is the orthogonal orientation with respect to k, i.e., k ∗ = k + K/2. These fea-
tures are similar to the in-channel features but operate on two orthogonal channels. In
theory, we can define these features on any two orientations. But we decide to compute
only the orthogonal-channel features based on two considerations: 1) orthogonal chan-
nels usually contain most complementary information. The information in two channels
with similar orientations is mostly redundant; 2) we want to keep the size of feature pool
small. The AbaBoost is a sequential, “greedy” algorithm for the feature selection. If the
feature pool contains too many uninformative features, the overall performance may
be hurt. In practice, all features have to be loaded into the main memory for efficient
training. We must be very careful about enlarging the size of features.
   Considering all combinations of R1 and R2 will be intractable. Based on the success
of Haar features, we use Haar patterns for R1 and R2 , as shown in Figure 5. We call the
features defined in (5) and (6), Haar of Oriented Gradients (HOOG).

4 Experimental Results
4.1 Data Set and Evaluation Methodology
Our evaluation data set includes two parts, the first part is our own data, which includes
10,000 cat images mainly obtained from flickr.com; the second part is from PASCAL
2007 cat data, which includes 679 cat images. Most of our own cat data are near frontal
view. Each cat head is manually labeled with 9 points, two for eyes, one for mouth,
and six for ears, as shown in Figure 6. We randomly divide our own cat face images
810 W. Zhang, J. Sun, and X. Tang
Fig. 6. The cat head image is manually labeled by 9 points
into three sets: 5,000 for training, 2000 for validation, and 3,000 for testing.We follow
the PASCAL 2007 original separations of training, validation and testing set on the cat
data. Our cat images can be downloaded from http://mmlab.ie.cuhk.edu.hk/ for research
purposes.
We use the evaluation methodology similar to PASCAL challenge for object detec-
tion. Suppose the ground truth rectangle and the detected rectangle are rg and rd , and
the area of those rectangles are Ag and Ad . We say we correctly detect a cat head only
when the overlap of rg and rd is larger than 50%:
(A ∩A )
1 if (Agg ∪Add ) > 50% ,
D(rg , rd ) = , (7)
0 otherwise
where D(rg , rd ) is a function used to calculate detection rate and false alarm rate.
4.2 Implementation Details
Training samples. To train the shape detector, we align all cat head image with respect
to ears. We rotate and scale the image so that two tips of ears appear on a horizontal line
and the distance between two tips is 36 pixel. Then, we extract a 48 × 48 pixel region,
centered 20 pixels below two tips. For the texture detector, a 32 × 32 pixel region is
extracted. The distance between two eyes is 20 pixel. The region is centered 6 pixel
below two eyes.
Features. We use 6 unsigned orientations to compute the oriented gradients features.
We find the improvement is marginal when finer orientations are used. The horizontal
and vertical filters are [−1, 0, 1] and [−1, 0, 1]T . No thresholding is applied on the com-
puted gradients. For both shape and texture detector, we construct feature pools with
200,000 features by quantifying the size and location of the Haar templates.
4.3 Comparison of Features
First of all, we compare the proposed HOOG features with Haar, Haar + EOH, and
HOG features on both shape detector and texture detector using our Flickr cat data set.
For the Haar features, we use all four kinds of Haar templates. For the EOH features,
we use default parameters suggested in [7]. For the HOG features, we use 4 × 4 cell
size which produces the best results in our experiments.Cat Head Detection - How to Effectively Exploit Shape and Texture Features 811
0.9
0.9
0.8 0.8
0.7 0.7
Recall
Recall
0.6 0.6
0.5 0.5
Haar Haar
Haar+EOH 0.4 Haar+EOH
0.4
HOG HOG
our feature our feature
0.3 0.3
0 50 100 150 200 250 300 0 50 100 150 200 250 300 350 400 450 500
False Alarm Count False Alarm Count
(a) shape detector (b) texture detector
Fig. 7. Comparison of Haar, Haar+EOH, HOG, and our features
Figure 7 shows the performances of the four kinds of features. The Haar feature on
intensity gives the poorest performance because of large shape and texture variations
of the cat head. With the help of oriented gradient features, Haar + EOH improves the
performance. As one can expect, the HOG features perform better on the shape detector
than on the texture detector. Using both in-channel and orthogonal-channel information,
the detectors based on our features produce the best results.
shape detector texture detector
(a) (b) 0o (d) (e) 0o
(c) 60o, 150o (f) 30o, 120o
Fig. 8. Best features leaned by the AdaBoost. Left (shape detector): (a) best Haar feature on image
intensity. (b) best in-channel feature. (c) best orthogonal feature on orientations 60o and 150o .
Right (texture detector): (d) best Haar feature on image intensity. (e) best in-channel feature. (f)
best orthogonal-channel feature on orientations 30o and 120o .
In Figure 8, we show the best in-channel features in (b) and (e), and the best
orthogonal-channel features in (c) and (f), learned by two detectors. We also show the
best Haar features on image intensity in Figure 8 (a) and (d). In both detectors, the best
in-channel features capture the strength differences between a region with strongest812 W. Zhang, J. Sun, and X. Tang
horizontal gradients and its neighboring region. The best orthogonal-channel features
capture the strength differences in two orthogonal orientations.
In the next experiment we investigate the role of in-channel features and orthogonal-
channel features. Figure 9 shows the performances of the detector using in-channel
features only, orthogonal-channel features only, and both kinds of features. Not surpris-
ingly, both features are important and complementary.
1 1
0.95 0.95
Precision
Precision
0.9 in-channel 0.9 in-channel
orthogonal-channel orthogonal-channel
0.85 0.85
in-channel + in-channel +
orthogonal-channel orthogonal-channel
0.8 0.8
0.5 0.6 Recall 0.7 0.8 0.5 0.6 Recall 0.7 0.8
(a) shape detector (b) texture detector
Fig. 9. The importance of in-channel features and orthogonal-channel features
4.4 Joint Shape and Texture Detection
In this sub-section, we evaluate the performance of the joint fusion on the Flickr cat
data. To demonstrate the importance of decomposing shape and texture features, we also
train a cat head detector using training samples aligned by an optimal rotation+scale
transformation for the comparison. Figure 10 shows four ROC curves: a shape detec-
tor, a texture detector, a head detector using optimal transformation, and a joint shape
and texture fusion detector. Several important observations can be obtained: 1) the per-
formance of fusion detector is substantially improved! For a given total false alarm
count 100, the recall is improved from 0.74/0.75/0.78 to 0.92. Or the total false alarm
is reduced from 130/115/90 to 20, for a fixed recall 0.76. In image retrieval and search
applications, it is a very nice property since high precision is preferred; 2) the head
detector using optimal transformation does not show superior performance. The dis-
criminative abilities of both shape and texture features are decreased by the optimal
transformation; 3) the maximal recall value of the fusion detector (0.92) is larger than
the maximal recall values of three individual detectors(0.77/0.82/0.85). This shows the
complementary abilities of two detectors - one detector can find many cat heads which
is difficult to the other detector; 4) note that the curve of fusion detector is very steep in
the low false alarm region, which means the fusion detector can effectively improve the
recall while maintain a very low false alarm rate.
The superior performance of our approach verifies a basic idea in object detection–
context helps! The fusion detector finds surrounding evidence to verify the detection re-
sult. In our cat head detection, when the shape detector reports a cat, the fusion detector
checks the surrounding shape information. If the texture detector says it may be a cat,
we increase the probability to accept this cat. Otherwise, we decrease the probability to
reject this cat.Cat Head Detection - How to Effectively Exploit Shape and Texture Features 813
1
0.95
0.9
0.85
Recall 0.8
0.75
0.7
0.65
Shape
0.6
Texture
0.55 Optimal Align
Shape+Texture
0.5
0 100 200 300 400 500 600
False Alalm Count
Fig. 10. Joint shape and texture detection
1 1
PASCA2007 Best
Haar
0.9 Our approach
0.9 Haar+EOH
0.8 0.8 HOG
0.7
our approach
0.7
Precision
Precision
0.6 0.6
0.5
0.5
0.4
0.4
0.3
0.3
0.2
0.2
0.1
0.1
0
0
0 0. 1 0.2 0.3 0 .4 0.5 0 .6 0. 7 0.8 0.9 1
0 0. 1 0.2 0.3 0 .4 0. 5 0.6 0 .7 0 .8 0. 9 1
Recall Recall
(a) Competition 3 (b) Competition 4
Fig. 11. Experiments on PASCAL 2007 cat data. (a) our approach and best reported method on
Competition 3 (specified training data). (b) four detectors on Competition 4 (arbitrary training
data).
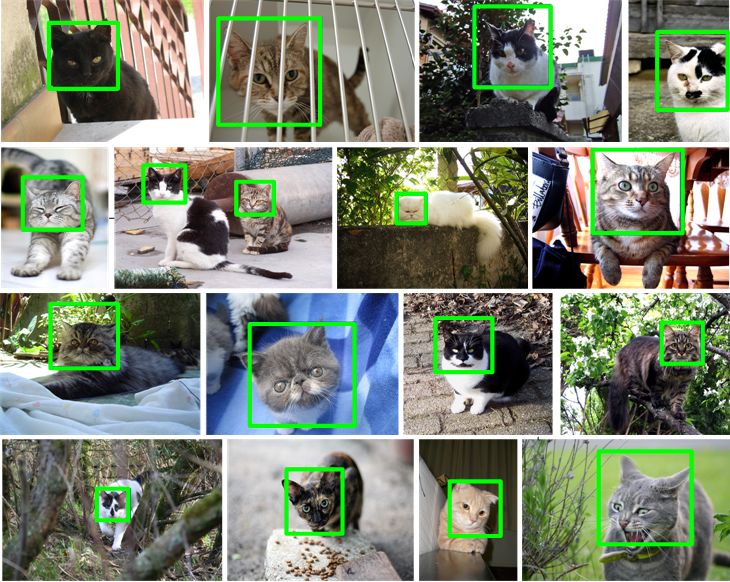
Figure 12 gives some detection examples having variable appearance, head shape,
illumination, and pose.
4.5 Experiment on the PASCAL 2007 Cat Data
We also evaluate the proposed approach on the PASCAL 2007 cat data [2]. There are
two kinds of competitions for the detection task: 1) Competition 3 - using both training
and testing data from PASCAL 2007; 2) Competition 4 - using arbitrary training data.
Figure 11 (a) shows the precision-recall curves of our approach and the best reported
method [2] on Competition 3. We compute the Average Precision (AP) as in [2] for a
convenient comparison. The APs of our approach and the best reported method is 0.364
and 0.24, respectively. Figure 11(b) shows the precision-recall curves on Competition
4. Since there is no reported result on Competition 4, we compare our approach with
the detectors using Haar, EOH, and HoG respectively. All detectors are trained on the814 W. Zhang, J. Sun, and X. Tang Fig. 12. Detection results. The bottom row shows some detected cats in PASCAL 2007 data. same training data. The APs of four detectors (ours, HOG, Haar+EOH, Harr) are 0.632, 0.427, 0.401, and 0.357. Using larger training data, the detection performance is signif- icantly improved. For example, the precision is improved from 0.40 to 0.91 for a fixed recall 0.4. Note that the PASCAL 2007 cat data treat the whole cat body as the object and only small fraction of the data contain near frontal cat face. However, our approach still achieves reasonable good results (AP=0.632) on this very challenging data (the best reported method’s AP=0.24). 5 Conclusion and Discussion In this paper, we have presented a cat head detection system. We achieved excellent results by decomposing texture and shape features firstly and fusing detection results
Cat Head Detection - How to Effectively Exploit Shape and Texture Features            815

secondly. The texture and shape detectors also greatly benefit from a set of new oriented
gradient features. Although we focus on the cat head detection problem in this paper,
our approach can be extended to detect other categories of animals. In the future, we
are planing to extend our approach to multi-view cat head detection and more animal
categories. We are also interest in exploiting other contextual information, such as the
presence of animal body, to further improve the performance.

References

 1. Dalal, N., Triggs, B.: Histograms of oriented gradients for human detection. In: CVPR, vol. 1,
    pp. 886–893 (2005)
 2. Everingham, M., van Gool, L., Williams, C., Winn, J., Zisserman, A.: The PASCAL Visual
    Object Classes Challenge (VOC 2007) Results (2007),
    http://www.pascal-network.org/challenges/VOC/voc2007/
    workshop/index.html
 3. Felzenszwalb, P.F.: Learning models for object recognition. In: CVPR, vol. 1, pp. 1056–1062
    (2001)
 4. Gavrila, D.M., Philomin, V.: Real-time object detection for smart vehicles. In: CVPR, vol. 1,
    pp. 87–93 (1999)
 5. Heisele, B., Serre, T., Pontil, M., Poggio, T.: Component-based face detection. In: CVPR,
    vol. 1, pp. 657–662 (2001)
 6. Leibe, B., Seemann, E., Schiele, B.: Pedestrian detection in crowded scenes. In: CVPR,
    vol. 1, pp. 878–885 (2005)
 7. Levi, K., Weiss, Y.: Learning object detection from a small number of examples: the impor-
    tance of good features. In: CVPR, vol. 2, pp. 53–60 (2004)
 8. Lowe, D.G.: Object recognition from local scale-invariant features. In: ICCV, vol. 2, pp.
    1150–1157 (1999)
 9. Mikolajczyk, K., Schmid, C., Zisserman, A.: Human detection based on a probabilistic
    assembly of robust part detectors. In: Pajdla, T., Matas, J(G.) (eds.) ECCV 2004. LNCS,
    vol. 3021, pp. 69–82. Springer, Heidelberg (2004)
10. Mohan, A., Papageorgiou, C., Poggio, T.: Example-based object detection in images by com-
    ponents. IEEE Trans. Pattern Anal. Machine Intell. 23(4), 349–361 (2001)
11. Munder, S., Gavrila, D.M.: An experimental study on pedestrian classification. IEEE Trans.
    Pattern Anal. Machine Intell. 28(11), 1863–1868 (2006)
12. Papageorgiou, C., Poggio, T.: A trainable system for object detection. Intl. Journal of Com-
    puter Vision 38(1), 15–33 (2000)
13. Ronfard, R., Schmid, C., Triggs, B.: Learning to parse pictures of people. In: ECCV, vol. 4,
    pp. 700–714 (2004)
14. Rowley, H.A., Baluja, S., Kanade, T.: Neural network-based face detection. IEEE Trans.
    Pattern Anal. Machine Intell. 20(1), 23–38 (1998)
15. Sabzmeydani, P., Mori, G.: Detecting pedestrians by learning shapelet features. In: CVPR
    (2007)
16. Schneiderman, H., Kanade, T.: A statistical method for 3d object detection applied to faces
    and cars. In: CVPR, vol. 1, pp. 746–751 (2000)
17. Tuzel, O., Porikli, F., Meer, P.: Human detection via classification on riemannian manifolds.
    In: CVPR (2007)
18. Viola, P., Jones, M.J.: Robust real-time face detection. Intl. Journal of Computer Vision 57(2),
    137–154 (2004)
816 W. Zhang, J. Sun, and X. Tang
19. Wu, B., Nevatia, R.: Detection of multiple, partially occluded humans in a single image by
bayesian combination of edgelet part detectors. In: ICCV, vol. 1, pp. 90–97 (2005)
20. Xiao, R., Zhu, H., Sun, H., Tang, X.: Dynamic cascades for face detection. In: ICCV, vol. 1,
pp. 1–8 (2007)
21. Zhu, Q., Avidan, S., Yeh, M.-C., Cheng, K.-T.: Fast human detection using a cascade of
histograms of oriented gradients. In: CVPR, vol. 2, pp. 1491–1498 (2006)You can also read