Corticospinal Excitability to the Biceps Brachii is Not Different When Arm Cycling at a Self-Selected or Fixed Cadence - MDPI
←
→
Page content transcription
If your browser does not render page correctly, please read the page content below
brain
           sciences
Article
Corticospinal Excitability to the Biceps Brachii is Not
Different When Arm Cycling at a Self-Selected or
Fixed Cadence
Evan J. Lockyer 1 , Anna P. Nippard 2 , Kaitlyn Kean 2 , Nicole Hollohan 2 , Duane C. Button 1,2
and Kevin E. Power 1,2, *
 1    Faculty of Medicine, Memorial University of Newfoundland, St. John’s, NL A1C5S7, Canada;
      ejl006@mun.ca (E.J.L.); dbutton@mun.ca (D.C.B.)
 2    School of Human Kinetics and Recreation, Memorial University of Newfoundland, St. John’s, NL A1C5S7,
      Canada; apn688@mun.ca (A.P.N.); kmk020@mun.ca (K.K.); neh420@mun.ca (N.H.)
 *    Correspondence: kevin.power@mun.ca; Tel.: +709-864-7275

 Received: 15 January 2019; Accepted: 12 February 2019; Published: 14 February 2019

 Abstract: Background: The present study compared corticospinal excitability to the biceps brachii
 muscle during arm cycling at a self-selected and a fixed cadence (SSC and FC, respectively).
 We hypothesized that corticospinal excitability would not be different between the two conditions.
 Methods: The SSC was initially performed and the cycling cadence was recorded every 5 s for one
 minute. The average cadence of the SSC cycling trial was then used as a target for the FC of cycling
 that the participants were instructed to maintain. The motor evoked potentials (MEPs) elicited via
 transcranial magnetic stimulation (TMS) of the motor cortex were recorded from the biceps brachii
 during each trial of SSC and FC arm cycling. Results: Corticospinal excitability, as assessed via
 normalized MEP amplitudes (MEPs were made relative to a maximal compound muscle action
 potential), was not different between groups. Conclusions: Focusing on maintaining a fixed cadence
 during arm cycling does not influence corticospinal excitability, as assessed via TMS-evoked MEPs.

 Keywords: motor evoked potential; MEP; arm cranking; pedalling; exercise

1. Introduction
     It is well established that rhythmic locomotor outputs in non-human animals (e.g., cat, rat,
and dog) are partially controlled by neural circuits located in the spinal cord, referred to as central
pattern generators (CPGs) [1,2]. Evidence, albeit indirect, has shown that the CPGs also contribute
to the production of rhythmic motor outputs in humans by integrating descending and afferent
inputs [3,4]; though it is believed that the descending input is of greater importance in the control of
human locomotor outputs [5].
     Arm cycling has been introduced as a model of locomotor output for examining changes in neural
excitability during rhythmic movement, with the vast majority of these studies using a set cadence
and power output for each participant [4,5]. While this may be necessary to maintain experimental
stringency, it is also acknowledged that, first, arm cycling may be regarded as a novel task for some
participants and, second, that by setting the cadence at 60 rpm, for example, participants may not be
cycling at a preferred cadence. Taken together, these two factors may act to alter attentional demands,
thus influencing the measures of corticospinal excitability.
     When humans engage in a novel motor task, they typically focus on how to perform the said
task, placing them in what is known as the “cognitive stage” of motor learning, according to the Fitts
and Posner model [6]. This suggests that the level of cognitive effort, and thus in all likelihood the
descending input, would be greater during this stage of learning. This is supported by work examining

Brain Sci. 2019, 9, 41; doi:10.3390/brainsci9020041                           www.mdpi.com/journal/brainsci
Brain Sci. 2019, 9, 41 2 of 10
the time course of changes in corticospinal excitability when learning a novel motor task, albeit
non-locomotor [7]. Holland et al. (2015) showed that the slope of the transcranial magnetic stimulation
(TMS) evoked input/output (I/O) curve decreased as learning progressed, with the majority of the
change occurring on the first of two training days. This suggests that as participants began the novel
task, greater cognitive effort was required thus enhancing corticospinal excitability, an effect that
decreased as the task lost its novelty.
Arm cycling is a motor task that may be considered novel and a number of studies have been
published that have examined corticospinal excitability during cycling in humans [8–14]. Work from
our lab has shown corticospinal excitability, assessed via TMS of the motor cortex projecting to the
biceps brachii, to be higher during arm cycling in humans when the elbow was flexed (bottom dead
centre) compared to an intensity- and position-matched tonic contraction [15]. This effect was due to
enhanced supraspinal excitability, as there were no differences in the measures of spinal excitability.
In that study, participants were required to maintain a pre-determined cadence (60 rpm) throughout
the trial by observing their cadence on the ergometer monitor, and it was possible that this increased
the attentional demands of the task. Research has shown that directed visual attention can induce
an increase in neural activity in the fronto-parietal network, as evidenced in functional brain imaging
studies [16]. It is thus possible that an increase in attention may increase corticospinal excitability
during arm cycling, though we hypothesized that the difference was task-dependent and not simply
due to the increased attentional demands of arm cycling [15].
Several studies have examined the influence of cycling cadence on neuromuscular activation.
Marias et al. (2004) examined the effects of a spontaneous chosen crank rate (SCCR) and crank rates
20% higher and lower than the SCCR during arm cycling on integrated electromyography (iEMG)
levels in the biceps brachii muscles in humans. The researchers concluded that there were no significant
differences in the iEMG between the crank rate conditions of the biceps brachii, suggesting that the
SCCR was not chosen to minimize the level of muscle activity and that the degree of muscle activation
was similar between the two groups [17]. This finding is supported by research that showed no
reduction in lower extremity muscle activation at a SCCR during leg cycling [18]. The iEMG assessed
in these studies is a measure of the electrical activity in the muscle, representing the overall output of
the motoneurone pool, and does not necessarily represent corticospinal excitability [8,13,14]. Therefore,
it is unknown how a self-selected cadence (SSC) during arm cycling influences corticospinal excitability
in comparison to a fixed cadence (FC).
The purpose of the current study was thus to determine if corticospinal excitability between SSC
and FC arm cycling was different. It was hypothesized that corticospinal excitability, as assessed via
the amplitude of motor evoked potentials (MEPs) elicited via TMS of the motor cortex, would not be
different between SSC and FC arm cycling.
2. Materials and Methods
2.1. Ethical Approval
Prior to the experiment all participants were informed of the experimental protocol and written
informed consent was obtained. This study was in accordance with the Helsinki declaration,
and experimental procedures were approved by the Interdisciplinary Committee on Ethics in Human
Research at the Memorial University of Newfoundland (ICEHR #20171250). All experimental
procedures were in accordance with the Tri-Council guidelines in Canada, and potential risks of
participation were disclosed to all participants.
2.2. Participants
Eleven participants (7 males and 4 females; 22 ± 2.14 years of age) were recruited from the School
of Human Kinetics and Recreation (HKR) at Memorial University using a convenience sampling
technique. Prior to testing, each participant completed a magnetic stimulation safety-checklist toBrain Sci. 2019, 9, 41 3 of 10
screen for existing contraindications to magnetic stimulation (Rossi et al., 2009). To determine hand
dominance, participants completed an Edinburgh Handedness Inventory questionnaire to ensure
that all evoked responses were recorded from the dominant arm [19]. Additionally, to screen for
existing contraindications to physical activity, each participant completed a Physical Activity Readiness
Questionnaire (PAR-Q+) [20]. Participants were excluded if they had any neurological deficits or
contraindications to magnetic stimulation or physical activity.
2.3. Experimental Set-Up
A one-group within-subjects design was used. Participants attended two lab sessions with at
least 24 h in between visits. The first visit was for a half-hour familiarization session and the second
was the testing session, lasting approximately 1 h. The experiment was completed on an arm cycle
ergometer (SCIFIT ergometer, model PRO2 Total Body) with the arm cranks set at 180 degrees out of
phase (see Figure 1). Each participant was advised to sit upright at a comfortable position from the
arm cranks to ensure that they could maintain an upright posture throughout each cycling protocol.
The seat height was adjusted to ensure the participant’s shoulders were in line with the centre of the
arm shaft. The participants were informed to lightly grip the handles with their forearms in pronation.
Each participant was required to wear wrist braces to limit wrist joint movement during cycling,
to reduce the effects of the heteronymous reflex connections that exist between the wrist flexor muscles
and the biceps brachii muscle [21].
All measurements were taken at a single position—6 o’clock relative to a clock face. This position
was relative to the participants’ dominant hand, such that the TMS would be triggered when the right
or left hand was at the 6 o’clock position for a right- or left-handed dominant individual, respectively.
We have examined this position previously [8–13,15], as it corresponds to a period of high bicep brachii
electromyography (EMG) activity during arm cycling since it occurs during mid-elbow flexion (i.e.,
movement from 3 o’clock to 9 o’clock).
The study required participants to cycle at two different cadences, both at a constant workload
of 25 W. The cadences (FC and SSC) served as the independent variables in the study. The TMS and
Erb’s point stimulation were delivered at the 6 o’clock position to elicit MEPs and maximal M-wave
(Mmax ) in the biceps brachii muscle in each condition. The MEP amplitude made relative to Mmax
and bEMG (background EMG; see below), as a measure of corticospinal excitability, served as the
dependent variable. The SSC trial was completed first, followed by the FC trial, and responses were
triggered as the arm crank of the dominant arm passed the 6 o’clock position.
2.4. Electromyography (EMG) Recordings
EMG activity was recorded from the biceps brachii and lateral head of the triceps brachii of
the dominant arm using pairs of surface electrodes (KendallTM 130 conductive adhesive electrodes,
Covidien IIC, Mansfield, MA, USA). The EMG was recorded using a bi-polar configuration with
an interelectrode distance of 2 cm. Electrodes were placed in the middle of the muscle belly of the
biceps brachii. A ground electrode was placed over the lateral epicondyle on the dominant arm.
Prior to electrode placement, the skin at the recording site was shaved to remove hair, abraded using
an abrasive pad to remove dead epithelial cells, and cleaned with an isopropyl alcohol swab to reduce
impedance for the EMG recordings. Signals were sampled online at 5 kHz using a CED 1401 interface
and Signal 5.11 software (Cambridge Electronic Design (CED) Ltd., Cambridge, UK). The EMG signals
were amplified (gain of 300) and filtered using a 3-pole Butterworth band-pass filter (10–1000 Hz)
using a CED 1902 amplifier.Brain Sci. 2019, 9, 41 4 of 10
Brain Sci. 2019, 9, x FOR PEER REVIEW 4 of 11
Figure 1. Experimental set-up. Arm cycling was performed in the forward direction, with
Figure 1. Experimental set-up. Arm cycling was performed in the forward direction, with stimulations
stimulations occurring when the dominant arm passed the 6 o’clock position (i.e., bottom dead centre)
occurringwhen
whenthe the dominant
biceps brachii wasarm passed
active. the 6iso’clock
This position denoted position (i.e.,
by the large, greybottom dead
downwards centre) when
arrow.
the biceps
TMSbrachii was magnetic
= transcranial active. stimulation;
This position is denoted
BB = biceps by= the
brachii; EMG large, grey downwards arrow.
electromyography.
TMS = transcranial magnetic stimulation; BB = biceps brachii; EMG = electromyography.
2.5. Simulation Conditions
2.5. Simulation Conditions
2.5.1. Brachial Plexus Stimulation
2.5.1. BrachialElectrical
Plexusstimulation
Stimulation
of the brachial plexus at Erb’s point was used to measure Mmax (maximal
M-wave) (DS7AH, Digitimer Ltd., Welwyn Garden City, Hertfordshire, UK). The anode was placed
Electrical
on the stimulation
acromion process of the
and brachial
the cathodeplexus at Erb’s
was placed over point
the skinwas used
in the to measure
supraclavicular Mmax
fossa. A (maximal
M-wave) pulse
(DS7AH, Digitimer
duration Ltd.,used
of 200 μs was Welwyn
and theGarden City,
stimulation Hertfordshire,
intensity was gradually UK). The anode
increased until thewas
M- placed on
wave process
the acromion amplitudeandof thethe
biceps brachii was
cathode reached a plateau,
placed over referred to asin
the skin Mmax
the. This stimulation intensity
supraclavicular fossa. A pulse
was increased by 10% and used for the remainder of the experiment to ensure maximal M-waves
duration were
of 200 µs was used and the stimulation intensity was gradually increased until the M-wave
elicited during each trial [22].
amplitude of the biceps brachii reached a plateau, referred to as Mmax . This stimulation intensity was
increased2.5.2. Transcranial
by 10% Magnetic
and used Stimulation
for the (TMS)of the experiment to ensure maximal M-waves were
remainder
elicited during eachevoked
Motor trial [22].
potentials (MEPs) were measured during both cycling trials from the biceps
brachii and served as the dependent variable in the study. TMS (Magstim 200, Dyfed, UK) was used
to elicit MEPs
2.5.2. Transcranial in the biceps
Magnetic brachii by(TMS)
Stimulation placing a circular coil (13.5 cm outside diameter) over the
Motor evoked potentials (MEPs) were measured during both cycling trials from the biceps brachii
and served as the dependent variable in the study. TMS (Magstim 200, Dyfed, UK) was used to elicit
MEPs in the biceps brachii by placing a circular coil (13.5 cm outside diameter) over the vertex. TMS is
a valid and reliable technique for eliciting MEPs, which are recorded from the muscle as a measure of
the excitability of the corticospinal tract (Rothwell et al., 1991). The vertex was located by measuring
the mid-point between the nasion and the inion and between the participant’s tragi, and marks were
placed for both measurements directly on the scalp. The intersection of the measurements was defined
as the vertex [13,15,23,24]. The same researcher held the coil for each trial and was vigilant in ensuringBrain Sci. 2019, 9, 41 5 of 10
that the coil was held parallel to the floor and remained aligned with the vertex throughout each trial.
The current preferentially activated the right or left motor cortex, depending on hand dominance.
The stimulation intensity was set during cycling (60 rpm and 25W) with MEPs evoked when the
dominant hand was at the 6 o’clock position. The stimulus intensity was measured as a percentage
of the maximum stimulator output (MSO), and the intensity was increased until the participant’s
active motor threshold (AMT) was found. The AMT was defined as the lowest stimulus intensity
required to evoke 5 clearly discernable MEPs (~200 µV) in 10 trials during cycling. Once the AMT was
found, the MSO was increased by 10% to ensure that clearly discernable MEPs were recorded, and this
stimulation intensity was then used for all trials.
2.5.3. Experimental Protocol
After the stimulation intensities were set for the TMS and Erb’s point stimulation, the cycling
trials were completed. The participant was first instructed to cycle forward at a comfortable pace,
and the monitor displaying the cycling cadence was moved out of the participant’s sight, such that
the participant was blinded to their cycling cadence. When the participant reached a steady cadence,
as observed by the researcher, the trial was started. A steady cadence was defined as a cadence that
fluctuated no more than ±1 rpm over a 5 s period. While the participant was cycling, the researcher
recorded the cadence every 5 s and calculated the average cadence over the duration of the trial.
After a 1 min break the participant was instructed to cycle forward maintaining a target cadence,
as specified by the researcher, by observing their cadence on the monitor. This target cadence (FC)
was equal to the average of the cadence over the duration of the SSC trial. During both trials the arm
ergometer was set to a fixed power output of 25 W. While cycling, each participant received 12 MEPs
and 2 M-waves per trial, which were delivered when the dominant hand passed the 6 o’clock position.
The order of the stimulations was randomized during the trial, and the stimulations were evoked every
7–8 s. To prevent anticipation of the stimulation, 2 frames without stimulation were added. The total
length of cycling was approximately 2 min per trial.
2.5.4. Data Analysis
Data were analyzed off-line using Signal 5.11 software (Cambridge Electronic Design Ltd.,
Cambridge, UK). To determine if the central motor drive projecting to the biceps brachii was similar
between the two arm cycling conditions, the mean rectified EMG 50 ms prior to the TMS stimulus
artifact was measured [15]. The peak-to-peak amplitude of all evoked responses (MEP and M-wave)
were measured from the initial deflection of the voltage trace from background EMG to the return of
the trace to the baseline level. MEP amplitudes can change as a result of changes to Mmax , thus MEPs
were normalized to Mmax evoked during the same trial to account for potential changes in peripheral
excitability. All measurements were taken from the averaged files of all 12 MEPs and 2 M-waves.
All measurements were made from the dominant arm.
2.5.5. Statistical Analysis
To compare the pre-stimulus EMG between the conditions (SSC and FC), paired-samples t-tests
were used. Additionally, paired-samples t-tests were used to assess whether statistically significant
differences in MEP amplitudes normalized to Mmax occurred between the SSC and FC conditions.
All statistics were completed on group data with a significance level of p < 0.05. All data are reported
as mean ± SE (standard error) in the figures.
3. Results
Cycling cadence. Figure 2 shows the group mean cycling cadence in revolutions per minute
(rpm) during the SSC and FC arm cycling trials. The cycling cadences for each condition were not
significantly different (mean cadence—SSC was 62 ± 6.4 rpm and FC was 63 ± 6.9 rpm; p = 0.118).Brain Sci. 2019, 9, x FOR PEER REVIEW 6 of 11
Cycling cadence. Figure 2 shows the group mean cycling cadence in revolutions per minute
(rpm)
Brain Sci. 2019, 9, 41during the SSC and FC arm cycling trials. The cycling cadences for each condition were not 6 of 10
significantly different (mean cadence—SSC was 62 ± 6.4 rpm and FC was 63 ± 6.9 rpm; p = 0.118).
Cycling Cadences
70
60
50
Cadence (rpm)
40
30
20
10
0
SSC FC
Cycling Condition
Figure 2. Mean cycling cadences for each group (SSC = black and FC = white). Data (n = 11) are shown
Figure 2. Mean cycling cadences for each group (SSC = black and FC = white). Data (n = 11) are shown
as mean ± SE (standard error).
as mean ± SE (standard error).
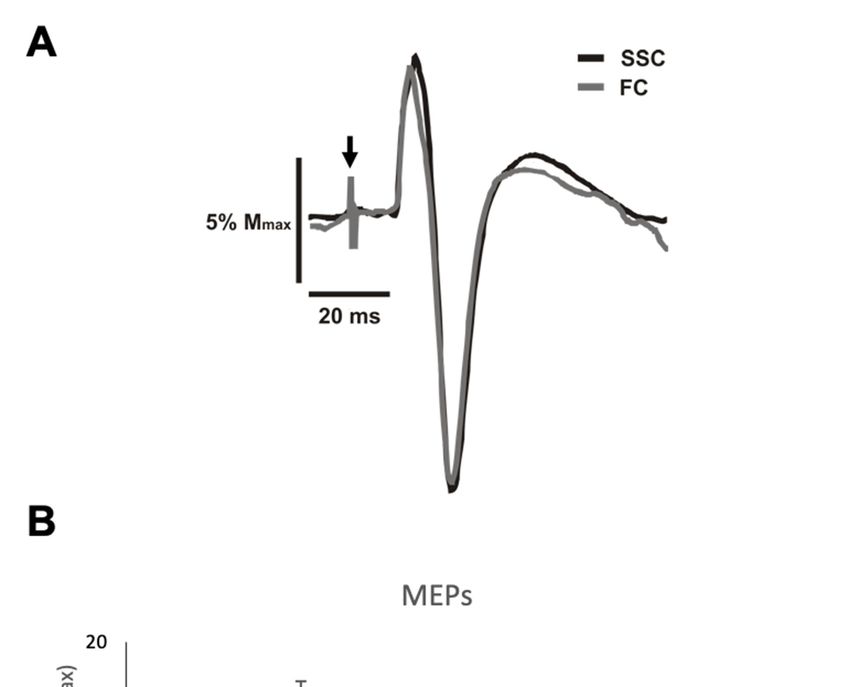
MEP amplitude.
MEP amplitude. Figure 3A 3A
Figure shows
showsrepresentative
representative data data
for for the MEP
the MEP amplitudes
amplitudes from one from one
participant for bothforthe
participant bothSSC
the and FC FC
SSC and cycling
cyclingconditions. Figure
conditions. Figure 3B shows
3B shows themean
the group group MEP mean MEP
amplitudes amplitudes
expressed expressed as a percentage
as a percentage of Mof Mmaxofof the
the biceps
bicepsbrachii during
brachii the SSC
during and
the FC arm
SSC and cycling
FC arm cycling
max
trials. The average MEP amplitude (normalized/standardized to Mmax) when cycling at a SSC and a
trials. TheFCaverage MEP amplitude (normalized/standardized to M respectively,
was 16.2% (SD (standard deviation) = 12.25) and 14.1% (SD = 11.75), max
) when cycling
with a mean
at a SSC and
a FC was 16.2% (SD
difference (standard
of 2.1%. deviation)
This difference = 12.25)
was not andsignificant
statistically 14.1% (SD (p = = 11.75), respectively, with a mean
0.146).
difference of Brain
2.1%. This
Sci. 2019, 9, xdifference was not statistically significant (p = 0.146).
FOR PEER REVIEW 7 of 11
Figure 3. (A) Representative motor evoked potential (MEP) amplitudes from one participant for
Figure 3. (A) Representative motor evoked potential (MEP) amplitudes from one participant for each
each cycling cycling
condition (SSC
condition (SSC== black and
black and FC =FC = grey).
grey). Downward Downward arrow
arrow indicates indicates
the location the location of the
of the stimulus
artifactsthat
stimulus artifacts that have
have been adjusted
been in size for
adjusted infigure
size clarity. (B) Mean
for figure transcranial
clarity. magnetictranscranial
(B) Mean stimulation magnetic
(TMS) evoked MEP amplitudes as a percentage of the maximal M-wave (Mmax) for each group (SSC
stimulation (TMS) evoked MEP amplitudes as a percentage of the maximal M-wave (Mmax) for each
= black and FC = white). Data (n = 11) are shown as mean ± SE.
group (SSC = black and FC = white). Data (n = 11) are shown as mean ± SE.
Pre-stimulus EMG of the biceps brachii for MEPs. The group mean (n = 11) pre-stimulus EMG
of the biceps brachii prior to the TMS stimulus artifact during the SSC and FC arm cycling can be
seen in Figure 4. As a group, the mean pre-stimulus EMG for the SSC and FC arm cycling trials was
30.2 ± 4.58 μV and 32.1 ± 5.82 μV, respectively. There was no significant difference between the values
(p = 0.061).Brain Sci. 2019, 9, 41 7 of 10
Pre-stimulus EMG of the biceps brachii for MEPs. The group mean (n = 11) pre-stimulus EMG
of the biceps brachii prior to the TMS stimulus artifact during the SSC and FC arm cycling can be
seen in Figure 4. As a group, the mean pre-stimulus EMG for the SSC and FC arm cycling trials was
30.2 ± 4.58
Brain 2019,and
Sci. µV 32.1
9, x FOR ± 5.82
PEER µV, respectively. There was no significant difference between 8the
REVIEW values
of 11
Brain Sci. 2019, 9, x FOR PEER REVIEW 8 of 11
(p = 0.061).
Background EMG
Background EMG
40
40
35
(µV)
35
(µV)
30
30
Emg
25
Emg
25
Background
20
Background
20
15
15
10
10
5
5
0
0 SSC FC
SSC FC
Cycling Condition
Cycling Condition
Figure 4. Mean
Figure of the
4. Mean average
of the averagerectified
rectified electromyography (EMG)
electromyography (EMG) amplitude
amplitude for biceps
for the the biceps brachii
brachii
Figure
priorprior 4. Mean of MEPs
to TMS-evoked the average rectified electromyography
forforeach (EMG) =amplitude for the biceps brachii
to TMS-evoked MEPs eachgroup
group (SSC
(SSC = blackand
= black andFCFC= white).
white). Data
Data (n =(n
11)=are
11)shown
are shown
as as
prior to TMS-evoked MEPs for each group (SSC = black and FC = white). Data (n = 11) are shown as
± SE.
meanmean ± SE.
mean ± SE.
Pre-stimulus
Pre-stimulus EMGEMG of of
thethetriceps
tricepsbrachii
brachii for MEPs.The
for MEPs. Thegroup
group mean
mean (n =(n11)
= 11) pre-stimulus
pre-stimulus EMG EMG
Pre-stimulus EMG of the triceps brachii for MEPs. The group mean (n = 11) pre-stimulus EMG
of triceps
of the the triceps brachii
brachii prior
prior totothetheTMS
TMSstimulus
stimulus artifact
artifactduring
during thethe
SSC
SSCandandFC FCarmarm
cycling can be
cycling can be
of the triceps brachii prior to the TMS stimulus artifact during the SSC and FC arm cycling can be
seen
seen seen in
in FigureFigure 5.
5. As As a group,
a group, thethe mean pre-stimulus EMG for the SSC and FC arm cycling trials was
in Figure 5. As a group, themean
meanpre-stimulus EMGfor
pre-stimulus EMG forthe
the SSC
SSC andand
FC FCarmarm cycling
cycling trialstrials
was was
8.9 ±8.9 ± 2.12
2.12 µV μV
andand
9.49.4
± ±2.68
2.68µV,
μV,respectively.
respectively. There
There was
was nonosignificant
significant difference
differencebetween
8.9 ± 2.12 μV and 9.4 ± 2.68 μV, respectively. There was no significant difference between the values
the values
between the values
(p = 0.58).
(p = 0.58).
(p = 0.58).
Background EMG
Background EMG
12
12
10
(µV)
10
(µV)
8
Emg
8
Emg
Background
6
Background
6
4
4
2
2
0
0 SSC FC
SSC FC
Cycling Condition
Cycling Condition
Figure 5. Mean of the average rectified EMG amplitude for the triceps brachii prior to TMS-evoked
MEPsFigure 5. Mean
for each of the
group (SSCaverage rectified
= black and FC EMG amplitude
= white). Datafor
(nthe triceps
= 11) brachii prior
are shown to TMS-evoked
as mean ± SE.
Figure 5. Mean of the average rectified EMG amplitude for the triceps brachii prior to TMS-evoked
MEPs for each group (SSC = black and FC = white). Data (n = 11) are shown as mean SE.
MEPs for each group (SSC = black and FC = white). Data (n = 11) are shown as mean SE.
4. Discussion
4. Discussion
4. Discussion
This is the first study to compare corticospinal excitability projecting to the biceps brachii between
This is the first study to compare corticospinal excitability projecting to the biceps brachii
self-selected
This (SSC)
is the and
first fixed
study cadence
to compare(FC) arm cycling.
corticospinal There projecting
excitability were no significant
to the bicepsdifferences
brachii in
between self-selected (SSC) and fixed cadence (FC) arm cycling. There were no significant differences
corticospinal excitability,
between self-selected as assessed
(SSC) via TMS-evoked
and fixed cadence MEP There
(FC) arm cycling. amplitudes
were norecorded
significantfrom the biceps
differences
in corticospinal excitability, as assessed via TMS-evoked MEP amplitudes recorded from the biceps
brachii, between theexcitability,
in corticospinal two arm cycling conditions.
as assessed Maintaining
via TMS-evoked a pre-determined
MEP amplitudes recordedcadence
from the(FC)
brachii, between the two arm cycling conditions. Maintaining a pre-determined cadence (FC) during
during
biceps
brachii, between the two arm cycling conditions. Maintaining a pre-determined cadence (FC) during
arm cycling does not increase corticospinal excitability, when compared to cycling at a voluntarily
arm cycling does not increase corticospinal excitability, when compared to cycling at a voluntarily
chosen cadence (SSC).
chosen cadence (SSC).Brain Sci. 2019, 9, 41 8 of 10
arm cycling does not increase corticospinal excitability, when compared to cycling at a voluntarily
chosen cadence (SSC).
A prior concern in studies from our lab and also in the work of others was that the attentional
demands of maintaining a set cadence could inadvertently alter (likely increase) the measures of
corticospinal excitability. The current finding that corticospinal excitability is not different between
SSC and FC arm cycling lends support to our previous finding that corticospinal excitability is
task-dependent and is higher during arm cycling than an intensity- and position-matched tonic
contraction [15]. In that study, the participants were required to maintain a pre-determined cadence
(60 rpm) while arm cycling rather than a voluntarily chosen cadence [15]. Thus, it was unknown
if the increase in supraspinal excitability projecting the biceps brachii at the 6 o’clock position was
due to the arm cycling task or if it resulted from a greater attentional demand to maintain the set
cadence. The results from the current study indicate that focusing on maintaining a fixed cadence
does not increase the overall excitability of the corticospinal tract, compared to arm cycling at a SSC.
Thus, the increase in corticospinal excitability during arm cycling that we reported was likely to be
task-dependent and not attributable to the fact that the participants had to focus on maintaining
a cadence of 60 rpm [15]. This is indirectly supported by prior work assessing the EMG of both arm
and leg muscles during either arm [17] or leg [18] cycling, respectively. In the aforementioned studies,
there was no influence of the SSC or the FC on EMG amplitudes, though there were no measures of
corticospinal excitability.
4.1. Attentional Focus and Corticospinal Excitability
Prior work has shown that visual attention modulates corticospinal excitability and directing
visual attention toward the specific features of an observed action facilitates corticospinal excitability
more than passive observation [25,26]. Attention can be directed to highly salient stimuli based on their
physical properties (e.g., brightness, colour, and speed) or toward stimuli that are important for one’s
current task [27]. In this study during the FC condition, participants were instructed to focus on the
monitor that displayed the cadence they were cycling at and were instructed to maintain a set cadence
and speed up or slow down based on the observed cadence. In contrast, during the SSC condition
participants were not able to see the monitor and were not instructed to focus on any particular
object in the external environment. Although participants were instructed to focus on the cadence
on the monitor throughout the FC trial, corticospinal excitability projecting to the biceps brachii was
not increased when compared to the SSC trial. A possible explanation for the lack of increase in
corticospinal excitability during the FC trial is that it is unknown if the participant maintained their
focus on the cadence displayed on the monitor throughout the entire trial, as eye tracking devices
were not used. In addition, much of the literature regarding increases in corticospinal excitability with
focused attention has been on the observation of human movement and the activity in the putative
mirror neuron system. Notably, corticospinal excitability is facilitated during action observation
and more so during goal-directed actions (e.g., grasping an object) when attention is directed to
task-relevant features of the observed action [28]. In this study, the participants were not observing
an action but were rather observing numbers on a monitor that were relevant to their behavioural
goal (maintaining a set cadence). Thus, the theory that corticospinal excitability is facilitated during
action observation due to the increased activity in the mirror neuron system may not apply in the
present study.
4.2. Methodological Considerations
Additional factors should be considered when interpreting the present results. This study assessed
MEP amplitudes and therefore conclusions can only be made regarding the overall excitability of
the corticospinal tract. In future, research assessing spinal excitability, with TMES (transmastoid
electrical stimulation) for example, to the target muscle to determine if changes in corticospinal
excitability are occurring at the spinal and/or supraspinal level may be of interest [29]. For instance,Brain Sci. 2019, 9, 41 9 of 10
it is possible that supraspinal excitability increased during the FC trial, and the increase was masked by
a reduction in spinal excitability, resulting in no change in the overall excitability of the corticospinal
tract. In order to decipher between supraspinal and spinal excitability both TMES and TMS need to
be used. The reason we chose the 6 o’clock position, however, was because in our prior work we
have shown that corticospinal excitability is higher during arm cycling than a tonic contraction at that
position while spinal excitability is not. Thus, it is unlikely that spinal excitability was different in the
present study. Additionally, some participants in this study had previous experience with arm cycling
and therefore may have required less attentional focus to execute the task. However, we purposely
included a familiarization session for all participants to minimize this threat to internal validity by
allowing participants to practice arm cycling.
5. Conclusions
The novel finding in this study is that corticospinal excitability, as assessed by changes in MEP
amplitude, projecting to the biceps brachii is not different between SSC and FC arm cycling. We can
indirectly (because attention was not directly measured) conclude that corticospinal excitability during
arm cycling is independent of attentional demands, as corticospinal excitability is not different when
focusing attention on maintaining a set cadence compared to cycling at a voluntarily chosen cadence.
Author Contributions: All authors participated in the data collection, analysis, and manuscript preparation.
All authors have approved the submitted version of this manuscript.
Funding: This research was funded by the Natural Sciences and Engineering Research Council of Canada
(NSERC), grant number (NSERC-#RGPIN-2015-05765).
Acknowledgments: This study was supported by CGS-M NSERC funding to E.J.L. as well as a NSERC Discovery
Grant to K.E.P. We would like to thank Thamir Alkanani for technical support and the participants for volunteering
their time.
Conflicts of Interest: The authors declare no conflict of interest.
References
1. Brown, T.G. The intrinsic factors in the act of progression in the mammal. Proc. R. Soc. Lond. Ser. 1911, 84,
308–319. [CrossRef]
2. Grillner, S. Control of Locomotion in Bipeds, Tetrapods, and Fish. Compr. Physiol. 2011, 2, 1179–1236.
[CrossRef]
3. Zehr, E.P.; Carroll, T.J.; Chua, R.; Collins, D.F.; Frigon, A.; Haridas, C.; Hundza, S.R.; Thompson, A.K. Possible
contributions of CPG activity to the control of rhythmic human arm movement. Can. J. Physiol. Pharmacol.
2004, 82, 556–568. [CrossRef] [PubMed]
4. Zehr, E.P.; Barss, T.S.; Dragert, K.; Frigon, A.; Vasudevan, E.V.; Haridas, C.; Hundza, S.; Kaupp, C.;
Klarner, T.; Klimstra, M.; et al. Neuromechanical interactions between the limbs during human locomotion:
An evolutionary perspective with translation to rehabilitation. Exp. Brain Res. 2016, 234, 3059–3081.
[CrossRef] [PubMed]
5. Power, K.E.; Lockyer, E.J.; Forman, D.A.; Button, D.C. Modulation of motoneurone excitability during
rhythmic motor outputs. Appl. Physiol. Nutr. Metab. 2018, 43, 1176–1185. [CrossRef] [PubMed]
6. Fitts, P.M.; Posner, M.I. Human Performance; Brooks/Cole Publishing Co.: Belmont, CA, USA, 1967.
7. Holland, L.; Murphy, B.; Passmore, S.; Yielder, P. Time course of corticospinal excitability changes following
a novel motor training task. Neurosci. Lett. 2015, 591, 81–85. [CrossRef]
8. Lockyer, E.J.; Benson, R.J.; Hynes, A.P.; Alcock, L.R.; Spence, A.J.; Button, D.C.; Power, K.E. Intensity
matters: Effects of cadence and power output on corticospinal excitability during arm cycling are phase- and
muscle-dependent. J. Neurophysiol. 2018. [CrossRef] [PubMed]
9. Forman, D.A.; Monks, M.; Power, K.E. Corticospinal excitability, assessed through stimulus response curves,
is phase-, task-, and muscle-dependent during arm cycling. Neurosci. Lett. 2018. [CrossRef] [PubMed]
10. Spence, A.J.; Alcock, L.R.; Lockyer, E.J.; Button, D.C.; Power, K.E. Phase- and Workload-Dependent Changes
in Corticospinal Excitability to the Biceps and Triceps Brachii during Arm Cycling. Brain Sci. 2016, 4, 60.
[CrossRef] [PubMed]Brain Sci. 2019, 9, 41 10 of 10
11. Forman, D.A.; Richards, M.; Forman, G.N.; Holmes, M.W.; Power, K.E. Changes in corticospinal and spinal
excitability to the biceps brachii with a neutral vs. pronated handgrip position differ between arm cycling
and tonic elbow flexion. Front. Hum. Neurosci. 2016, 10, 543. [CrossRef] [PubMed]
12. Forman, D.A.; Philpott, D.T.; Button, D.C.; Power, K.E. Differences in corticospinal excitability to the biceps
brachii between arm cycling and tonic contraction are not evident at the immediate onset of movement. Exp.
Brain Res. 2016, 234, 2339–2349. [CrossRef]
13. Forman, D.A.; Philpott, D.T.; Button, D.C.; Power, K.E. Cadence-dependent changes in corticospinal
excitability of the biceps brachii during arm cycling. J. Neurophysiol. 2015, 114, 2285–2294. [CrossRef]
[PubMed]
14. Copithorne, D.B.; Forman, D.A.; Power, K.E. Premovement changes in corticospinal excitability of the biceps
brachii are not different between arm cycling and an intensity-matched tonic contraction. Motor Control 2015,
19, 223–241. [CrossRef] [PubMed]
15. Forman, D.; Raj, A.; Button, D.C.; Power, K.E. Corticospinal excitability of the biceps brachii is higher during
arm cycling than an intensity-matched tonic contraction. J. Neurophysiol. 2014, 112, 1142–1151. [CrossRef]
16. Kastner, S.; Pinsk, M.A.; De Weerd, P.; Desimone, R.; Ungerleider, L.G. Increased activity in human visual
cortex during directed attention in the absence of visual stimulation. Neuron 1999, 22, 751–761. [CrossRef]
17. Marais, G.; Dupont, L.; Vanvelcenaher, J.; Clarys, J.P.; Pelayo, P. Effects of spontaneously chosen crank rate
variations on electromyographic responses in sub-maximal arm exercise in inexperienced subjects. Eur. J.
Appl. Physiol. 2004, 92, 598–601. [CrossRef]
18. Marsh, A.P.; Martin, P.E. The relationship between cadence and lower-extremity emg in cyclists and
noncyclists. Med. Sci. Sport Exerc. 1995, 27, 217–225. [CrossRef]
19. Oldfield, R.C. The Assessment and Analysis of Handedness: The Edinburgh Inventory. Neuropsychologia
1971, 9, 97–113. [CrossRef]
20. Bredin, S.S.D.; Gledhill, N.; Jamnik, V.K.; Warburton, D.E.R. PAR-Q plus and ePARmed-X plus New risk
stratification and physical activity clearance strategy for physicians and patients alike. Can. Fam. Physician
2013, 59, 273–277. [PubMed]
21. Manning, C.D.; Bawa, P. Heteronymous reflex connections in human upper limb muscles in response to
stretch of forearm muscles. J. Neurophysiol. 2011, 106, 1489–1499. [CrossRef]
22. Crone, C.; Johnsen, L.L.; Hultborn, H.; Orsnes, G.B. Amplitude of the maximum motor response (Mmax) in
human muscles typically decreases during the course of an experiment. Exp. Brain Res. 1999, 124, 265–270.
[CrossRef] [PubMed]
23. Pearcey, G.E.; Power, K.E.; Button, D.C. Differences in supraspinal and spinal excitability during various
force outputs of the biceps brachii in chronic- and non-resistance trained individuals. PLoS ONE 2014, 9,
e98468. [CrossRef] [PubMed]
24. Taylor, J.L.; Allen, G.M.; Butler, J.E.; Gandevia, S.C. Effect of contraction strength on responses in biceps
brachii and adductor pollicis to transcranial magnetic stimulation. Exp. Brain Res. 1997, 117, 472–478.
[CrossRef] [PubMed]
25. Puglisi, G.; Leonetti, A.; Landau, A.; Fornia, L.; Cerri, G.; Borroni, P. The role of attention in human motor
resonance. PLoS ONE 2017. [CrossRef] [PubMed]
26. Leonetti, A.; Puglisi, G.; Siugzdaite, R.; Ferrari, C.; Cerri, G.; Borroni, P. What you see is what you get: Motor
resonance in peripheral vision. Exp. Brain Res. 2015, 233, 3013–3022. [CrossRef] [PubMed]
27. Buschman, T.J.; Kastner, S. From Behavior to Neural Dynamics: An Integrated Theory of Attention. Neuron
2015, 88, 127–144. [CrossRef] [PubMed]
28. Roosink, M.; Zijdewind, I. Corticospinal excitability during observation and imagery of simple and complex
hand tasks: Implications for motor rehabilitation. Behav. Brain Res. 2010, 213, 35–41. [CrossRef] [PubMed]
29. Taylor, J.L. Stimulation at the cervicomedullary junction in human subjects. J. Electromyogr. Kinesiol. 2006, 16,
215–223. [CrossRef]
© 2019 by the authors. Licensee MDPI, Basel, Switzerland. This article is an open access
article distributed under the terms and conditions of the Creative Commons Attribution
(CC BY) license (http://creativecommons.org/licenses/by/4.0/).You can also read