The Storegga Slide tsunami-comparing field observations with numerical simulations
←
→
Page content transcription
If your browser does not render page correctly, please read the page content below
Marine and Petroleum Geology 22 (2005) 195–208
                                                                                                                  www.elsevier.com/locate/marpetgeo

                The Storegga Slide tsunami—comparing field observations
                               with numerical simulations
                         Stein Bondevika,*, Finn Løvholtb, Carl Harbitzb, Jan Mangerudc,
                                    Alastair Dawsond, John Inge Svendsenc
                                        a
                                         Department of Geology, University of Tromsø, N-9037 Tromsø, Norway
            b
             International Centre for Geohazards, Norwegian Geotechnical Institute, P.O. Box 3930 Ullevaal Stadion, N-0806 Oslo, Norway
          c
           Department of Earth Science and Bjerknes Centre for Climate Research, University of Bergen, Allégaten 41, N-5007 Bergen, Norway
                                      d
                                       Centre for Quaternary Science, Coventry University, CV1 5FB Coventry, UK

                              Received 9 October 2003; received in revised form 25 June 2004; accepted 15 October 2004

Abstract
   Deposits from the Storegga tsunami have been found in coastal areas around the Norwegian Sea and North Sea, from the northeast coast of
England to beyond the Arctic Circle in northern Norway. The tsunami deposits reach onshore elevations of 10–12 m above sea level of their
time in western Norway, 3–6 m in northeast Scotland and above 20 m on the Shetland Islands. These elevations are compared with surface
(wave) elevations derived from a numerical simulation of the Storegga slide. A good agreement is obtained for a retrogressive slide that
descends at 25–30 m/s, and that has short time lags of 15–20 s between each individual slide-block.
q 2005 Elsevier Ltd. All rights reserved.

Keywords: Tsunami deposits; Storegga Slide; Tsunami modelling

1. Introduction                                                               Smith, 2000). From the elevations of these deposits we also
                                                                              know fairly well the run-up of the tsunami in the different
   For more than a decade it has been assumed that the                        regions. The highest deposits found so far are from
Storegga slide generated a large tsunami. Traces of this                      Shetland, where sand has been traced to more than 20 m
event were independently discovered in Scotland (Dawson                       above sea level at that time. On the outer coast of western
et al., 1988; Long et al., 1989) and western Norway                           Norway, proximal to the back-wall of the slide, the waves
(Svendsen and Mangerud, 1990). A numerical simulation                         inundated lakes up to 10–12 m above sea level, but failed
of the waves generated by the ‘Storegga slides’ predicted                     to reach lakes 13 m high (Fig. 1).
that most coastlines bordering the Norwegian Sea and                             In the present paper we compare these field
North Sea could have been inundated by the tsunami                            observations with run-up heights deduced from new
(Harbitz, 1992). As a result of more systematic investi-                      numerical simulations of the slide generated water
gations in the subsequent years, deposits from the Storegga                   waves. Such a comparison is important because the
tsunami have now been identified along a considerable                         geographical pattern of run-up-heights provides a
stretch of the Norwegian coastline (Bondevik et al., 1997a;                   sensitive test to quantify some essential slide properties
Bondevik, 2003), The Faeroe Islands (Grauert et al., 2001),                   as initial acceleration, the maximum velocity, the
Shetland Islands (Bondevik et al., 2003) and Scotland                         volume of the slide and how the slide developed
(Dawson et al., 1988; Long et al., 1989; Dawson and                           (Løvholt et al., 2005). Both geotechnical and morpho-
                                                                              logical studies demonstrate that the slide retreated
 * Corresponding author.                                                      backwards (Kvalstad et al., 2005; Haflidason et al.,
   E-mail address: stein.bondevik@ig.uit.no (S. Bondevik).                    2005). The time lag between the individual blocks sliding
0264-8172/$ - see front matter q 2005 Elsevier Ltd. All rights reserved.
doi:10.1016/j.marpetgeo.2004.10.003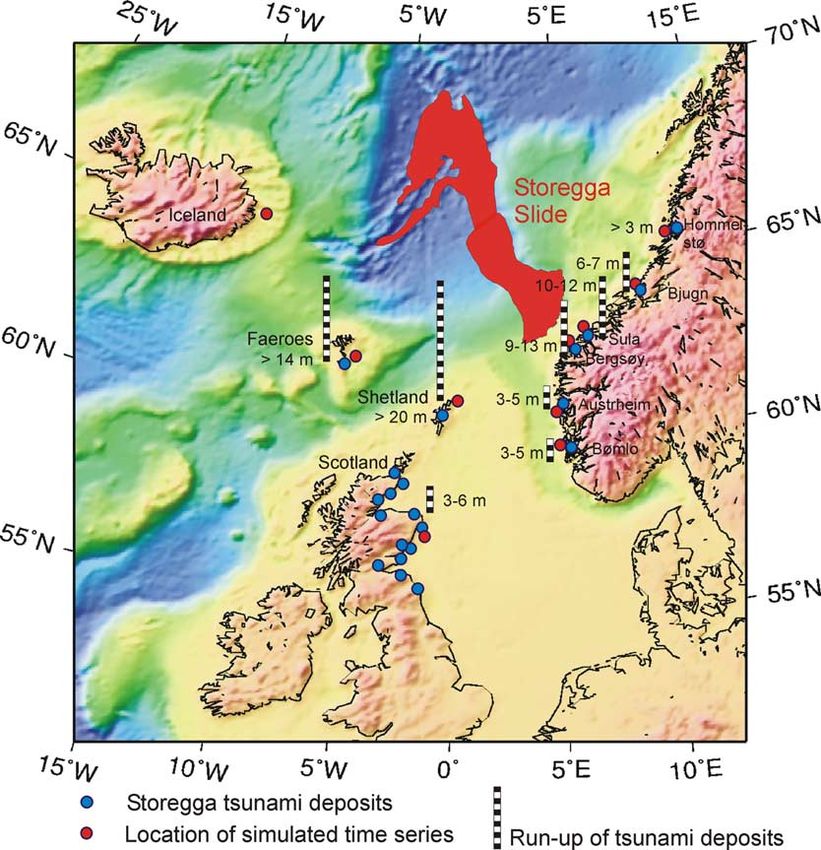
196 S. Bondevik et al. / Marine and Petroleum Geology 22 (2005) 195–208
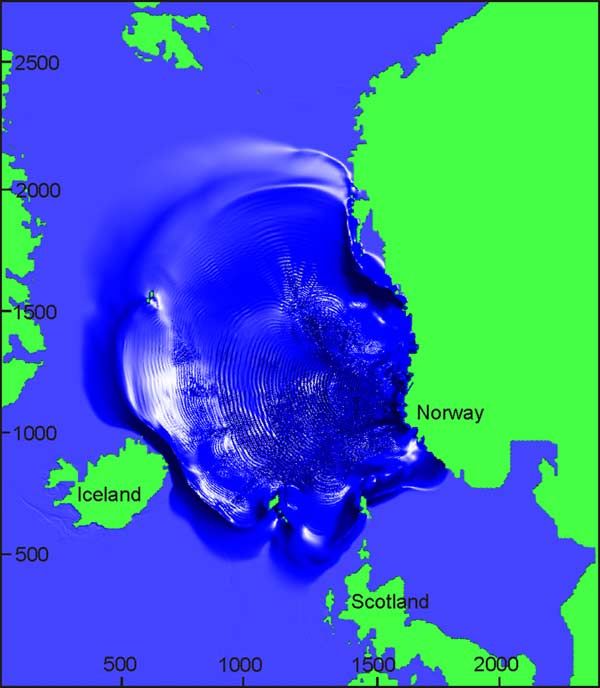
Fig. 1. Map of the Storegga Slide. Blue dots show where tsunami deposits have been studied and numbers show elevation of the deposits above the
contemporary sea level. Red dots show approximate position of the time series plotted in Fig. 2, or discussed in Table 1.
off as the slide retreated backwards is considered to be a been inferred from tsunami deposits. The best fit is
decisive factor on the magnitude and pattern of the resulting obtained for a retrogressive slide having a maximum
waves. The run-up heights can therefore be used to constrain velocity below 35 m/s, probably around 25–30 m/s. The
the time development of the slide. time lag between the individual slide blocks was not more
The shape and volume of the modelled slide used by than 15–20 s.
Harbitz (1992) have been adjusted to fit the new and
much more detailed reconstruction of the slide based on
the comprehensive marine-geological investigations 2. Methods—field observations
during the Ormen Lange project (Forsberg, 2002;
Haflidason et al., 2004). In the revised slide model the 2.1. Identification of Storegga tsunami deposits
maximum thickness (400 m) of the slide is near the upper
headwall and it becomes gradually thinner towards the The best preserved Storegga tsunami deposits are found
slide front in the offshore direction. The volume of the in near-shore coastal lake basins. Cores from such basins
slide involved in the generation of the tsunami is show that the accumulation of fine-grained organic mud
estimated to be 2400 km3. were suddenly interrupted by the flooding of the tsunami
In this paper we present time series of sea surface (Figs. 3 and 4B) that eroded and ripped up the lake floor
elevations (Fig. 2) derived from the numerical simulations and transported marine sand and gravel into the lakes.
at locations very close to the field sites where run-up has Deposits from the Storegga tsunami have now been
"
Fig. 2. Time series of sea surface elevations. Um is maximum velocity reached by the slide. The ruler indicates the field observations. Time series from the
Faeroe Islands and Shetland Islands are obtained from the coarse grid simulation at offshore locations in open water (Fig. 1), whereas the field observations are
from within the fjords. The discrepancy between the field observations and the simulated surface elevations from these areas are caused by the amplification
and focusing of the wave in the fjords. The time series from western Norway are simulated using the fine grid matrix of 0.5!0.5 km. For comparison, the first
time series from Sula shows simulations using the 0.25, 0.5 and 2.08 km grids with a maximum slide velocity of 35 m/s. For information about the other time
series, see Table 1.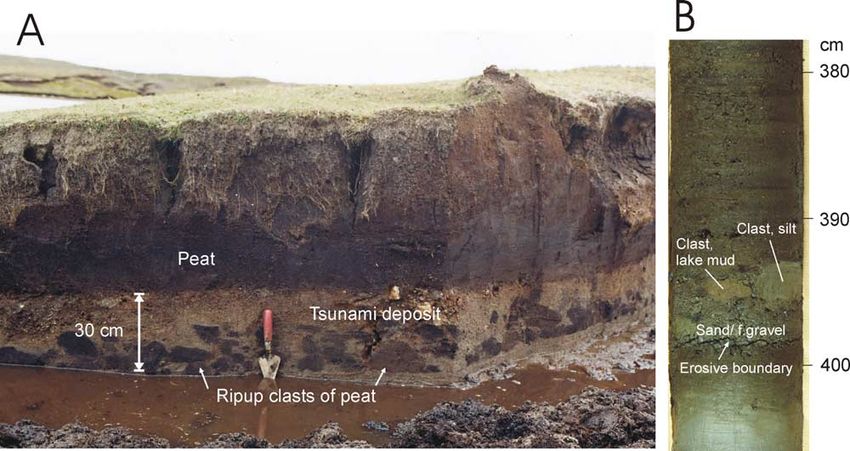
S. Bondevik et al. / Marine and Petroleum Geology 22 (2005) 195–208 197
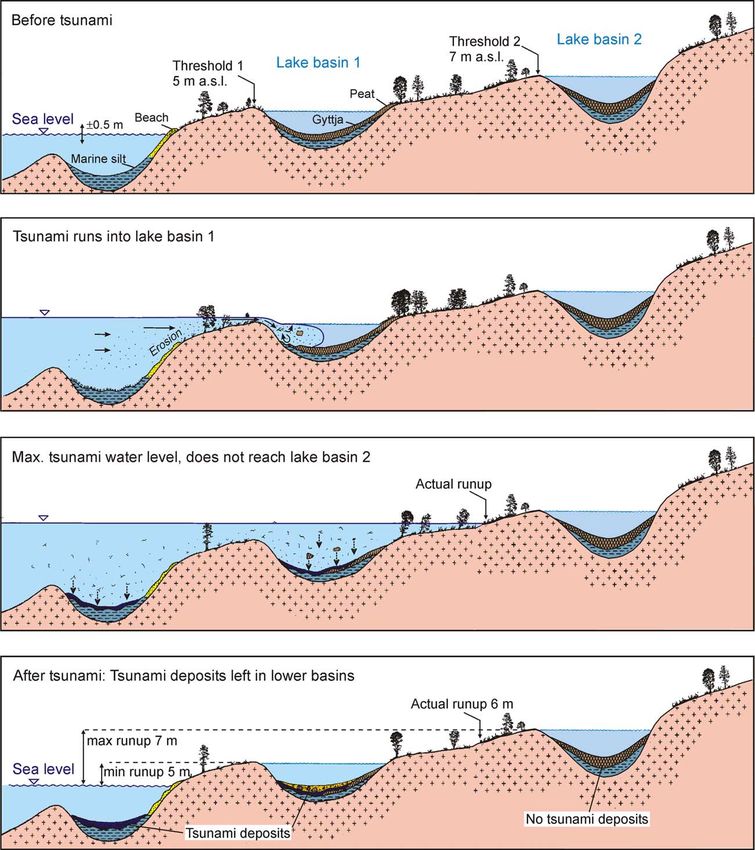
198                                      S. Bondevik et al. / Marine and Petroleum Geology 22 (2005) 195–208

Fig. 3. Illustration to show how the Storegga tsunami inundates a coastal lake and how the thresholds of the lakes are used to estimate run-up heights. The
tsunami runs across the threshold at 5 m a.s.l. but not into lake basin 2 at 7 m a.s.l. The reconstructed run-up would in this case be 5–7 m.

described from more than 20 lakes in western Norway                              meters inland in raised estuarine mudflats in Scotland
(Bondevik et al., 1997a), four lakes on the Shetland Islands                     (Dawson et al., 1988; Long et al., 1989) and in peat
(Bondevik et al., 2003; Bondevik et al., in press) and one                       outcrops in Shetland (Bondevik et al., 2003).
on the Fareoe Islands (Grauert et al., 2001). Tsunami                               The deposits show some common features that dis-
sedimentary facies in lakes are described in detail by                           tinguish them from the enclosing sediments. They rest on an
Bondevik et al. (1997b). Storegga tsunami deposits are also                      erosional unconformity that typically shows more erosion
found as a sand layer that can be traced several hundred                         towards the sea. A normal graded sand bed or a massive
S. Bondevik et al. / Marine and Petroleum Geology 22 (2005) 195–208                                                199

Fig. 4. (A) Storegga tsunami deposits in a peat outcrop in Sullom Voe, Shetland (Bondevik et al., 2003). Large rip-up clasts of peat and pieces of wood make up
a bed within the sand, with a distinct lower boundary. We interpret this as a result of at least two waves inundating the land. The first wave eroded the peat
surface and transported rip-up clasts of peat and sand. The backwash left the eroded clasts and other organic remains at the surface of the tsunami-laid sand. The
following wave buried the clasts in sand. Storegga tsunami deposits inferred to show repeated waves are also known from coastal lakes in western Norway
(Bondevik et al., 1997b) and peat in Scotland (Dawson and Shi, 2000). (B) Storegga tsunami deposits from a lake basin on Shetland (Bondevik et al., 2003).
The Storegga tsunami deposit has a sharp, erosive lower boundary at 398.5 cm that rests on late glacial silt and early Holocene lake mud. Coarse sand and fine
gravel are found on top of this boundary. The sand contains rip-up clasts of silt and lake mud. Up-core, to 311 cm, the tsunami deposit is a mixture of different
re-deposited material.

sand bed overlies the erosive boundary. The sand bed                                2.2. Reconstructing the run-up from tsunami deposits
gradually thins in the landward direction and decreases in
grain size. Very often rip-up clasts of peat, gyttja (lake mud)                        The presence of tsunami deposit in a coastal lake means
or silt (Fig. 4) are found either on top of the sand layer or                       that the tsunami overflowed the outlet threshold of the lake.
within the sand. The deposits frequently contain marine                             The elevation of the threshold relative to the sea level at
fossils, including shells and shell- fragments, foraminifera                        tsunami time shows a minimum run-up (Fig. 3). Along the
and diatoms.                                                                        Norwegian coast the tsunami deposits were traced succes-
    The primary lines of evidence that these facies were                            sively to lakes at higher elevations. The first lake basin with
deposited by a tsunami generated from the Storegga slide                            no traces of any inundation by the tsunami was taken as an
are: (1) The source of the deposit appears to be the ocean;                         indicator that the tsunami did not reach this level (Bondevik
there are marine fossils in the deposit, it shows landward                          et al., 1997a). The upper limit of the flooding is thus
fining, and the seaward side shows more signs of bed                                somewhere between the highest basin with tsunami deposits
erosion. (2) Many of the characteristics of these deposits are                      and the lowermost basin without such traces (Fig. 3). The
reported from known modern tsunami deposits; extensive                              smaller the difference in altitude between these two lakes,
erosion, rip-up clasts, decrease in thickness and grain-size                        the more precise estimate of the run-up can be obtained.
landwards, and massive or normal grading. (3) The                                   Tsunami deposits in peat have been traced to their
elevation of the deposits far exceeds any storm surge                               maximum elevations and levelled relative to the inferred
amplitude; the deposits are found from 3 to 20 m above the                          high tide when the tsunami struck.
contemporaneous high tide level. (4) The tsunami deposits                              Run-up is measured relative to the contemporary sea
and the slide have the same age. Radiocarbon dates of the                           level, which therefore has to be known. Along the
deposits show ages between 7000 and 7300 14C yr BP in all                           Norwegian coast a number of well-documented sea-level
the different areas. According to many AMS 14C dates of                             curves have been constructed (Kaland, 1984; Anundsen,
plant fragments the most accurate age for the tsunami is                            1985; Kjemperud, 1986; Svendsen and Mangerud, 1987;
7250–7350 14C yr BP (Bondevik et al., 1997a). The slide                             Bondevik et al., 1998). Because of uplift due to glacial
itself has been dated to 7250G250 14C yr BP (Haflidason                             unloading of Fennoscandia the 7300 14C yr BP shorelines
et al., 2005). (5) The waves were largest in the regions                            are tilted and found above the present sea level. This is also
adjacent to the Storegga slide. The height of tsunami                               true for Scotland. However, in both Shetland and the Faeroe
deposits along the outer coast of Norway are gradually                              Islands the shorelines of that time are submerged 10–15 m
decreasing away from the slide area (Fig. 1) (Bondevik                              below present sea level. Unfortunately, there are little data
et al., 1997a).                                                                     constraining sea level for these islands. The uncertainty of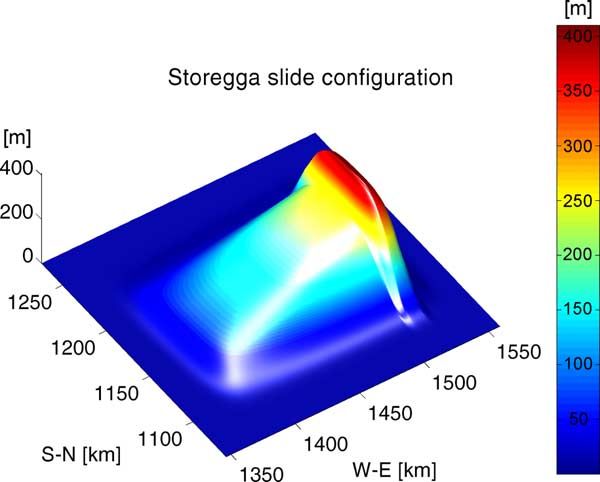
200                                       S. Bondevik et al. / Marine and Petroleum Geology 22 (2005) 195–208

Fig. 5. Cross-section showing the present sea floor in the Storegga Slide scar area, the reconstructed pre-Storegga slide sea floor (Forsberg, 2002) and the
modelled sea floor, as described by the new slide block used in the simulations. The new slide block is a close approximation to the reconstructed pre-Storegga
slide sea-floor.

the run-up estimates is therefore much larger for these areas                      3.1. Storegga slide released as one body
than for the western coast of Norway and Scotland.
   Another uncertainty in the reconstructed run-up is that                             The slide is modelled as a box that is skewed and
sediments possibly were not deposited up to the very                               smoothed to reproduce the reconstructed morphology of the
highest level of inundation. This is well known from                               Storegga slide (Forsberg, 2002; Haflidason et al., 2005).
observations of modern tsunamis (Nishimura and Miyaji,                             This gives a thicker slide near the headwall with a shorter
1995; Dawson and Shi, 2000), and tsunami deposits thus                             total length than the one used by Harbitz (1992) (Fig. 5).
only give a minimum estimate of run-up. Absence of                                 The width of the box is 100 km and the total length is
tsunami deposits within the flooding area is probably more                         150 km. The maximum thickness is slightly above 400 m
likely on a slope than in a lake basin that acts as a                              (Fig. 6).
sediment trap. Still, in some cases it may be difficult to                             The slide is released as one body that moves along the
detect tsunami deposits in lakes that were located just                            sea bed as a flexible blanket. In map view the slide moves
below the flooding limit.                                                          along a straight line, with a prescribed velocity profile.
   The reconstructed sea levels are high tide elevations. If                       We performed two simulations. In simulation 1 the slide
the tsunami struck the coast at low tide, the run-up would be                      reaches a maximum velocity Um Z35 m/s, while in
2–3 m higher than our estimates. Thus, the given heights                           simulation 2 the slide reaches UmZ20 m/s. Both simu-
should be regarded as minimum estimates of run-up because                          lations uses a run-out distance RZ150 km and an initial
the sediments only give a minimum estimate and because
they are measured from the high tide level.

3. Methods—numerical simulation

    The numerical simulations consist of two different slide
models. First we simulate the waves generated from a slide
that is very similar to the reconstructed morphology of
the Storegga Slide. This slide is released as one body that
moves along the seabed using two different maximum slide
velocities. Then we investigate the effects of a retrogressive
slide motion by simulating a uniform slide in 2-D that
is comparable in size to the Storegga Slide. This slide
consists of 167 blocks that are released one at a time. By
varying the time lag between the blocks we can study how
the retrogressive slide motion affects the resulting tsunami                       Fig. 6. A 3-D view of the slide block used in the simulations. Compared to
                                                                                   older simulations (Harbitz, 1992) this slide is thicker near the headwall and
waves.
                                                                                   has a shorter total length. The maximum thickness is slightly above 400 m.
S. Bondevik et al. / Marine and Petroleum Geology 22 (2005) 195–208 201
acceleration a0Z0.016 m/s2. For simulation 1 the accelera-
tion distance (distance covered from rest to maximum
velocity) RaZ75 km and in simulation 2 it is 24.5 km. For
further details on the slide dynamics see Løvholt et al.
(2005).
3.2. Retrogressive slide motion in 2 D
Although we model the slide as a whole block sliding
downwards, the slide developed retrogressively, i e.
the headwall retreated up-slope (Kvalstad et al., 2005;
Haflidason et al., 2005). In this way the slide would start
somewhere in the lower part of the slope sending off wedges
and blocks down-slope as it retreated up-slope. In general
this would reduce the height of the generated waves.
The retrogressive slide is two dimensional. It consists of
167 rectangular blocks that are 240 m thick and 600 m long
giving a thickness to block-length ratio of 240 m/600 mZ
0.4, which is fairly typical for retrogressive slides (Kvalstad
pers. comm. 2003). The slide is 167!600 mZ1000 km
long. The blocks are released subsequently in a uniform
water depth of 1000 m with an equal time lag (Dt) between
the individual blocks. Time lags (Dt) vary from zero to 60 s.
The maximum surface elevation of the waves (hmax) from
each time lag are then compared to the maximum surface
elevation of the fixed shaped slide (DtZ0). All the blocks
move with the same velocity profile, and the run-out
distance is 150 km. The applied model is further described
in Haugen et al. (2005); see Fig. 3 there for illustration).
3.3. Tsunami model and grid resolution
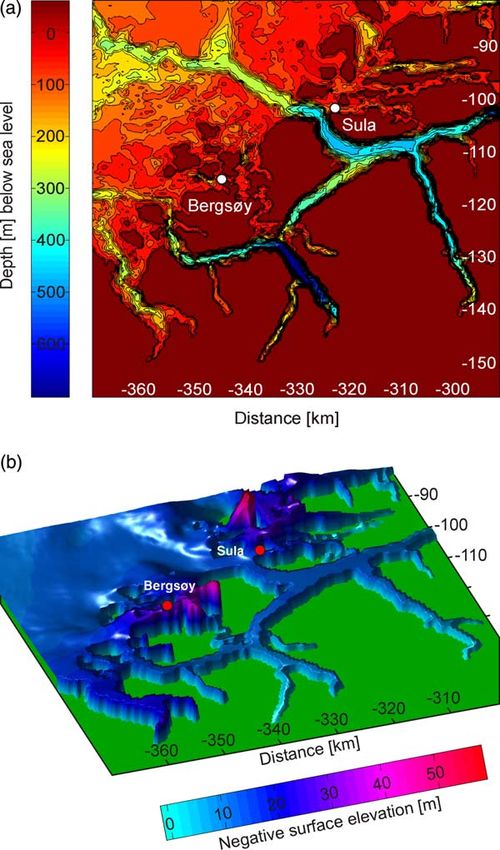
Fig. 7. (a) The 500!500 m grid from western Norway pictures a rather
The numerical tsunami model is a linear, long wave
realistic coastline with sounds, straits, islands and fjords. Here is a segment
model. For more details on the tsunami model, see Løvholt of the grid that covers Bergsøy and Sula (Fig. 1), two of our field sites where
et al. (2005) and Harbitz (1992). We have used two different runup has been inferred from tsunami deposits. Most straits and sounds
depth matrices for the bathymetry. For the western coast of adjacent to the sites are resolved with at least three or more grid points in
Norway we applied a grid matrix with a resolution of 500! the transverse direction of the incoming waves (see Fig. 7b). (b) A snapshot
of the surface elevation 1 h after the release of the Storegga slide (UmZ35
500 m which we here call the fine grid matrix. The grid
m/s) showing the same segment as in Fig. 7a. In order to illustrate the
covers an area of 765 km (west–east)!645 km (south– problem of variation in surface elevation across fjords we here show an
north) (Fig. 1 in Løvholt et al., 2005). The fine grid gives a inverted image of the first negative wave to hit Norway. Note how the wave
bathymetry with sufficient resolution of the coastline with penetrates into the fjords and sounds by a fairly uniform change in surface
fjords, islands etc (Fig. 7a). To test the model for sensitivity elevation. Across the fjords there is only minor variation in surface
elevation.
to grid spacing we also ran one simulation (with UmZ35 m/
s and RZ150 km) on a 250!250 m grid, a grid that we
produced by bilinear interpolation of the 500!500 m grid.
The solutions using both the 250 and the 500 m grids give reliable results of runup from the Storegga tsunami in
converges reasonably well (Fig. 2—Sula), hence the fine complex fjords and straits along the Norwegian coast.
grid resolves the coastline sufficiently. However, for areas outside western Norway we only had
The waves penetrate into fjords and sound by a fairly the coarse grid matrix that was used by Harbitz (1992) with
uniform increase in surface elevation with only minor a resolution of 12.5!12.5 km. We refined the grid by
variation in the transverse direction across the fjords bilinear interpolation to a resolution of 2.08 km!2.08 km.
(Fig. 7b). Due to the large wave length of about 600– The grid covers 2387.5 km!2485.5 km; including
800 km for the Storegga tsunami, and the relatively steep the Norwegian coast, Iceland, Greenland and Scotland
slopes along the Norwegian coast, the waves will be rather (Fig. 8). However, the coarse grid is far too coarse to resolve
insensitive to local run-up effects (Pedersen et al., 1995). the complex geometry of the coastal areas with fjords
Based on the above arguments the 500!500 m grid should and islands. Thus, simulations of run-up in narrow fjords202 S. Bondevik et al. / Marine and Petroleum Geology 22 (2005) 195–208
Faeroe Islands, Shetland and Scotland. After 1.5 h the wave
reached Shetland and the Faeroe Islands.
The time series (Fig. 2) also suggest that the coastlines
would experience several subsequent waves. This is evident
at many of the field sites. The Norwegian lakes close to the
sea level at the time of the tsunami often show several sand
layers alternating with organic layers. The sand layers were
inferred to represent pulses of water (wave fronts) entering
the basins while the organic layers represents the period
between the waves when suspended material settled on the
lake floor (Bondevik et al., 1997b). In Scotland the
occurrence of several subunits within the larger sand body
of the tsunami deposit are believed to reflect different waves
running up the coast (Dawson and Shi, 2000). Fig. 4A shows
evidence of at least two waves that hit Sullom Voe in
Shetland (Bondevik et al., 2003).
The simulations based on the new slide configuration,
with a finer grid of 500 m!500 m, and more of the material
placed in the upper slope, all return somewhat higher waves
than the previous simulations carried out by Harbitz (1992).
An interesting feature when applying the finer grid is that
the sea level at the western coast of Norway (Sula) may have
Fig. 8. Perspective view of sea-surface elevation 2 h after the release of
dropped to a level of K20 m in the period between the two
the slide. The wave front, ca 3 m high has reached the Faeroe Islands and
the Shetland Islands and approaches Greenland, Iceland and Scotland. The first waves which imply that the total amplitude was nearly
small ripples behind the wave front are caused by numerical noise. This 40 m (Fig. 2).
noise does not affect the maximum surface elevations.
4.1. Western Norway
at the coast using this grid are likely to be underestimated
(Fig. 2). The most accurate run-up estimates from field obser-
Because of this we have adjusted the run-up heights vations are from the Norwegian coast. Here the estimate at
analytically for sites located within fjords on the Faeroe each site is based on several lake basins at different
Islands and Shetland. The amplification is estimated using elevations (Table 1; Bondevik et al., 1997a). Furthermore,
Green’s law, taking the incoming surface elevation derived the contemporary high tide sea level is known with an
from the numerical simulation, fjord narrowing and depth uncertainty less than 1 m for all of the sites, except for
reduction into account. The amplification factor for the Brønnøysund–Hommelstø.
surface elevation from an offshore location to a fjord Tsunami deposits are described from Bømlo in the south
location is analytically given as (wo/wf)1/2$(ho/hf)1/4. Here w to Hommelstø in the north (Fig. 1). The highest estimate is
and h are the fjord width and depth, respectively, and the from Sula on the northwest coast where the run-up is
subscripts’ o 0 and f 0 indicates the offshore and fjord constrained to 10–12 m. From this area the run-up decreases
locations. Green’s law does not consider boundary reflec- to the north (Bjugn, 6–8 m) and south (Austrheim, 3–5 m)
tions. These estimates have a higher uncertainty than results and this observation was used as an argument that the source
from numerical simulations that uses a grid to resolve the for the tsunami was the Storegga Slide (Bondevik et al.,
local bathymetry. For details on Green’s law, see for 1997a)
instance Mei (1989). Surface elevations have been calculated at Bergsøy, Sula,
Bjugn and Brønnøysund (Fig. 1, Table 1) using both grid
resolutions. The gauges on the coarse grid are slightly off-
shore compared to the corresponding locations on the fine
4. Results grid (Table 1) because the finer grid extends farther into the
coastal areas where the field sites are located. For the two
The Storegga tsunami propagated outwards in all sites proximal to the slide area, Bergsøy and Sula (Figs. 1
directions from the Storegga Slide (Fig. 8). On the and 7a and b), the simulations using the fine grid give almost
Norwegian coast, the tsunami began as a withdrawal of twice as high surface elevations as the coarse grid (Fig. 2;
the sea. Here time series (Fig. 2) show a sea level drop of Table 1). The reason for this is local effects, which the
20 m around 30 min after the slide was released (Fig. 2). coarse grid cannot resolve. A snapshot of the wave after
At the same time a positive wave with a maximum height of reaching the outer coast illustrates that the wave penetrates
ca. 3 m in the open ocean propagated towards Iceland, into the fjords and sounds by a fairly uniform increase inTable 1
Surface displacements derived from numerical simulations compared to field observations of maximum elevation of tsunami deposits
Locations Numerical simulation of max. Surface elevation (m) Field observations Comments
Area Site/position Latitude Longitude Water depth (UmaxZ35 m/s) (UmaxZ20 m/s) Sites with Runup (m)
(m) tsunami
coarse grid fine grid coarse grid fine grid deposits
0 a 0
N. Norway Brønnøysund 65826 N 12802 E 34 30.2 17.1 20.3 17.9 Modelled site on the outer coast,
65827 0 N 12802 0 E 50 while field obs. from Hommelstø,
located inland in fjord
N. Norway Hommelstø 65823 0 N 12835 0 E 3 Lake O3 All studied basins below sea level at
basins tsunami time, terrestrial plants and
peat clasts within tsunami dep.
S. Bondevik et al. / Marine and Petroleum Geology 22 (2005) 195–208
indicate runup O 3 m
W. Norway Bjugn 63858 0 Na 9848 0 E 110 14.3 11.6 7.1 7.2
63852 0 Nb 9849 0 E 61
W. Norway Bjugn 63850 0 N 9850 0 E 3 Lake 6–8 Sea level 35–36 m a.s.l. Tsunami
basins wave overflowed lake threshold at
42 m a.s.l. but not lake at 44 m a.s.l.
(Bondevik et al., 1997a,b)
W. Norway Sula 62835 0 Na 5851 0 E 43 12.7 22.9 11.8 13.5
62827 0 Nb 6805 0 E 100
W. Norway Sula 62826 0 N 6814 0 E 6 Lake 10–12 Sea level 10–11 m a.s.l. Tsunami
basins barely inundated lake at 21.5 m a.s.l.
but not lake at 22 m a.s.l. (Bondevik
et al., 1997a)
W. Norway Bergsøy 62824 0 Na 5835 0 E 33 13.4 20.2 9.5 17.4
62818 0 Nb 5843 0 E 50
W. Norway Bergsøy/ 62820 0 N 5839 0 E 4 Lake 9–13 Lake 8–9 m above sea level at
Leinøy basins tsunami time show large erosion
from tsunami. Two lakes 12–13 m
above sea level at that time show no
sign of tsunami deposits. (Bondevik
et al., 1997a)
W. Norway Austrheim 60840 0 N 4842 0 E 65 6.9 3.9
W. Norway Austrheim 60847 0 N 4856 0 E 5 Lake 3–5 Sea level 10–11 m a.s.l. Tsunami
basins clearly inundated lake at 14 m a.s.l.
but not lake at 15 m a.s.l. (Bondevik
et al., 1997a)
W. Norway Bømlo 5985 0 N 5805 0 E 36 6.6 3.4
W. Norway Bømlo 59845 0 N 5820 0 E 2 Lake 3–5 Sea level ca 12 m a.s.l. Tsunami
basins deposits in lake at 15 m a.s.l. but not
in bog at ca 16 m a.s.l. (Bondevik
et al., 1997a)
Scotland Scotland-E 57857 0 N 1858 0 W 76 5.9 4.2
(continued on next page)
203204
Table 1 (continued)
Locations Numerical simulation of max. Surface elevation (m) Field observations Comments
Area Site/position Latitude Longitude Water depth (UmaxZ35 m/s) (UmaxZ20 m/s) Sites with Runup (m)
(m) tsunami
coarse grid fine grid coarse grid fine grid deposits
Scotland Scotland- 55840 0 N - 1840 0 W - Numerous 3–6 All sites occur within estuarine
mainland 58840 0 N 4830 0 W sites sequences where tsunami deposits
S. Bondevik et al. / Marine and Petroleum Geology 22 (2005) 195–208
coastline are enclosed with a) pre-existing
estuarine silts and clays and b)
within peat. At each site the tsunami
deposit can be traced landward
where it becomes thinner and
increases in elevation. The range of
runup estimates are between 3 and
6 m, but it is possible that individual
sites may have experienced runup in
excess of this range (Dawson, 1999;
Dawson and Smith, 2000)
Shetland Shetland-NE 60847 0 N 0848 0 W 43 8.0 – 7.1 –
Shetland NE-coast 60816 0 N 1809 0 W 4 Lake O 12 Lakes located 0.5–3 m above present
basins high tide level. Sea level probably
10–15 m below present sea level.
(Bondevik et al., submitted)
Shetland Sullom Voe 60828 0 N 1820 0 W Outcrop in O 20 Sand layer in peat traced to 9.2 m
peat above high tide. Sea level probably
10–15 m below present sea level.
(Bondevik et al., 2003)
Faeroe Suderøy-E 61828 0 N 6833 0 W 122 7.2 – 5.7 – Modelled site is in open water E of
Islands field obs
Faeroe Suderøy, Vagur 61820 0 N 6815 0 W 1 Lake O 15–20 Field obs. at the head of 5 km long
Islands basin fjord 4 m a.s.l. Sea level probably 10
m below present sea level. (Grauert
et al., 2001)
Iceland Iceland-E 65812 0 N 12854 0 W 157 6.3 – 4.7 – No field observations from Iceland
Sites using the coarser grid are in open water outside field site.
Sites using the finer grid are closer to the field sites.
a
Site coordinates refer to coarse grid.
b
Site coordinates refer to fine grid.S. Bondevik et al. / Marine and Petroleum Geology 22 (2005) 195–208 205
lake, we think the runup in this area may have been as high
as 20 m.
The numerical simulation of the wave in open water just
to the east of Suderøy Island (Fig. 2, Table 1) show
maximum surface elevations of between 5.7 and 7.2 m, well
below the field observations. The field observation site is
located at the head of a fjord. The fine grid simulations from
western Norway show that the bathymetry near the coast is
of importance for the surface elevation. We have thus
calculated the wave propagation into the fjord using Greens
law. This calculation shows that the wave height increases
to 19 m using simulation 2 and 22 m using simulation 1 at a
water depth of 45 m in the fjord, 6–7 km from the field site.
However, the uncertainties in these analytical estimates are
Fig. 9. Maximum surface elevation for sites in western Norway as a
higher than for the results from the numerical model.
function of maximum slide velocity, calculated using the fine grid
bathymetry. The field observations (horizontal bars) indicate a slide
velocity less than 20 m/s. Note that all field observations are measured 4.3. The Shetland Islands
relative to high tide. If the tsunami occurred at low tide, the wave elevation
would increase with about 2–3 m. Storegga tsunami deposits are present both in lakes and
in peat outcrops (Bondevik et al., 2003). The sites are
located in the northern and eastern part of Shetland. In a
surface elevation, with only minor surface variation across fjord/inlet called Sullom Voe, the Storegga sand layer could
the fjords (Fig. 7b). Hence the simulations using the fine be traced in peat up to 9.2 m above present high tide. The
grid is regarded to give the representative surface elevations thresholds of the studied lakes are all found a couple of
comparable to the field observations. This result is meters above the present sea level.
important because the sites in Scotland, Shetland, and the Sea level at the time of the Storegga tsunami was much
Faeroe Islands are only computed using the coarse grid. lower than today. Dated submerged peat (Hoppe, 1965) and a
Surface elevations computed using a maximum slide modelled sea level curve (Lambeck, 1993) suggest the sea
velocity of 20 m/s fit the field observation data reasonably level to be more than 10–15 m lower than today at this time.
well (Table 1, Fig. 9), while the results with a maximum This suggests a vertical run-up of at least 20–25 m for the
slide velocity of 35 m/s returns surface elevations that are up Sullum Voe area. For the lakes that were located a couple of
to two times times higher than the field observations for meters above sea level on the eastern and northern coast the
many of the locations in western Norway. run-up may have been less than the 20–25 m found for the
Sullom Voe area, but still larger than 12–15 m (Bondevik
et al., in press)
4.2. The Faeroe Islands
The surface elevations generated by the Storegga
tsunami have been calculated just to the north of Shetland
Storegga tsunami deposits have so far only been
giving values of 7.1–8.0 m (Fig. 1, Table 1). The time series
described from one lake basin situated 4 m a s.l. (meters
is used as a basis for estimating the maximum surface
above sea level) at the Faeroe Islands (Grauert et al., 2001).
elevation near the field site Sullom Voe. Using the
This lake is situated on the southernmost island, Suderøy, at analytical method as for the Faeroe Islands we obtained
the head of a 5 km long fjord that opens towards the east. surface elevations of 19–21 m at a present water depth of
The tsunami scoured the lake floor down to bedrock and 48 m, about 3 km north of the field location.
then deposited sand containing marine fossils and rip-up
clasts of lake mud. The large erosion suggests very strong 4.4. Scotland
currents through the basin and indicates that the waves
extended to a much greater height than 4 m a.s.l., probably On mainland Scotland the tsunami deposit occur as a
at least 10 m a.s.l. Also, based on the tsunami deposits, sand layer found within estuarine clay and silt and continue
Grauert et al. (2001) concluded that at least two large waves into terrestrial peat. At each site the sand layer can be traced
inundated the basin. landward where it becomes thinner and increases in
Sea level has been below present day sea level on the elevation. The range of run-up estimates is between 3 and
Faroe Islands during the last 10,000 years. Grauert et al. 6 m above the high water mark (Dawson, 1999; Dawson and
(2001) estimated that sea level when the tsunami happened Smith, 2000). The sites in Scotland are similar to the
was at least 10 m below present day sea level. This gives a Shetland sites in that the deposits are found within peat, but
minimum runup of 14 m. Considering that the wave was differ from them in that here they can be traced seawards
probably reaching many meters above the above mentioned into former estuarine sediments and that the latter can be206 S. Bondevik et al. / Marine and Petroleum Geology 22 (2005) 195–208
used to define the position of the high tide when the tsunami 5. Discussion
struck.
The numerical simulation from the east coast of Scotland Deposits from the Storegga tsunami are found from
(Fig. 1) shows maximum surface elevations of 4.2–5.9 m. Northern England to Northern Norway. Sites in Shetland
The field observations along the Scottish coast are located in and on the Faeroe Islands show a large run-up, more than
sheltered estuaries rather than deep fjords and thus the 15–20 m at the head of small fjords. The run-up estimates
simulated surface elevations near Scotland are probably not from deposits along the outer coast of Norway show run-up
amplified to the same extent as close to the field sites at the of 9–13 m near the slide area, decreasing away from the
Faeroe Islands and Shetland. slide. These large waves extending over such a vast area
indicate that most of the volume of the slide was involved in
4.5. Simulation of retrogressive slides the generation of the tsunami.
According to both morphological and geotechnical
According to both morphological and geotechnical studies the Storegga slide developed retrogressively. This
studies the Storegga slide developed retrogressively. This means that the slide started somewhere in the lower part of
means that the slide started somewhere in the lower part of the slope releasing blocks and wedges as it retreated up-
the slope releasing blocks and wedges as it retreated up- slope. If the slide developed with very short time lags
slope. Obviously this effect had some impact on the surface between the blocks it can be regarded as one block sliding
elevations. Fig. 10 shows that the effect of the time lag on downwards as we have done in our model. A slide velocity
the generated maximum surface elevation varies for below 20 m/s gives the best fit to the field observations in
different maximum slide velocities for a slide similar in western Norway. Both Bjugn and Sula show a good fit for a
size to the Storegga slide (see Section 3 for further details). maximum velocity around 15 m/s, while Bergsøy indicate a
The simulations also show that the effect is directional, i.e. maximum velocity below 10 m/s (Fig. 9). The more distal
that the maximum surface elevation is reduced more as a sites Scotland, Shetland and the Faroe Islands also fit to a
function of the time lag at front of the slide than at the rear. maximum velocity of 20 m/s (Fig. 2, Table 1).
Even small time lags reduce the maximum surface elevation For larger maximum velocities the model does not
in the front, while the maximum surface elevation at the rear match the field observations (Fig. 9) without involving
is increased for time lags less than 10–12 s. For the waves a retrogressive motion of the slide that significantly reduces
propagating sideways, one should expect a mean value of the wave heights. A maximum velocity of 35 m/s without a
the front and rear correction to the maximum surface retrogressive slide motion agrees well to the sites in
elevation generated by a fixed shaped slide. Shetland and the Faeroe Islands (Fig. 2, Table 1), when
Fig. 10. Maximum surface elevation (hmax) as a function of time lag (Dt) between rectangular sliding blocks in a 2-D slide model. The 2-D model is comparable
in size to the Storegga slide. It consists of 167 blocks, each being 240 m thick and 600 m wide, that are released with an equal time lag (Dt) between the
individual blocks in a basin with a uniform water depth of 1000 m (see Haugen et al. (2005) for more details on the model). The values on the y-axis are the
maximum surface elevation hmax for DtR0 divided by the maximum surface elevation hmax for a fixed shaped slide (DtZ0). This illustrates the change in
maximum surface elevation due to the retrogressive nature of the slide. A time lag of 15–20 s between the individual blocks would reduce the surface elevation
with a factor of 0.75.S. Bondevik et al. / Marine and Petroleum Geology 22 (2005) 195–208 207
fjord amplification is taken into account, but does not fit any Acknowledgements
of the sites in western Norway (Fig. 2, Table 1). Largest
deviation is seen for Bergsøy and Sula where the simulated Funding came from Norsk Hydro. Jim Rose and George
waves reach heights of 20 and 23 m which is twice the Priest reviewed the manuscript carefully, and together with
elevations from the field observations. Bretwood Higman they suggested several changes that
A maximum velocity between 25 and 30 m/s with a improved the final version of the paper. This is the
retrogressive reduction of the surface elevation with a factor International Centre for Geohazards (ICG) contribution
of 0.75 would make the best match to the field observations No. 49.
(Fig. 10; Table 1). According to our retrogressive slide
model such a reduction is obtained with a very little time
lag, about 15–20 s between the sliding blocks. Velocities of References
25–30 m/s are also supported by De Blasio et al. (2005),
who finds mean (centre of mass) slide velocities of Anundsen, K., 1985. Changes in shore-level and ice-front position in Late
25–35 m/s in their run-out studies of the Storegga slide. Weichsel and Holocene, southern Norway. Norsk Geografisk Tidsskrift
To make the 35 m/s-velocity simulations fit the field 39, 205–225.
Bondevik, S., 2003. Storegga tsunami sand in peat below the Tapes beach
observations in western Norway a time lag of about 30 s
ridge at Harøy, western Norway, and its possible relation to an early
must be applied. However, such a large reduction does not Stone Age settlement. Boreas 32, 476–483.
match the field observations in the coastal areas to the west Bondevik, S., Svendsen, J.I., Johnsen, G., Mangerud, J., Kaland, P.E.,
of the Storegga slide. 1997a. The Storegga tsunami along the Norwegian coast, its age and
run-up. Boreas 26, 29–53.
Bondevik, S., Svendsen, J.I., Mangerud, J., 1997b. Tsunami sedimentary
facies deposited by the Storegga tsunami in shallow marine basins and
coastal lakes, western Norway. Sedimentology 44, 1115–1131.
6. Conclusions Bondevik, S., Svendsen, J.I., Mangerud, J., 1998. Distinction between the
Storegga tsunami and the Holocene marine transgression in coastal
basin deposits of western Norway. Journal of Quaternary Science 13,
(1) The Storegga slide generated exceptionally large waves
529–537.
that inundated most coastlines around the North Bondevik, S., Mangerud, J., Dawson, S., Dawson, A., Lohne, Ø., 2003.
Sea/Norwegian Sea. Deposits are found from northern Record-breaking height for 8000-year-old tsunami in the North
England to northern Norway. In fjords in Shetland and Atlantic. EOS 84, 289, 293.
the Faeroe Islands deposits show that the waves reached Bondevik, S., Mangerud, J., Dawson, S., Dawson, A., Lohne, Ø., in press.
Evidence for three north sea tsunamis at the Shetland Islands between
elevations to at least 20 m above the contemporary sea 8000 and 1500 years ago. Quaternary Science Reviews, in press.
level. These large waves, which extended over such a Dawson, S., 1999. Flandrian relative sea level changes in northern
large area, show that most of the volume of the slide was Scotland. Unpublished PhD Thesis, Coventry University, 360pp.
involved in the generation of the tsunami. Dawson, A.G., Shi, S., 2000. Tsunami deposits. Pure and Applied
(2) The numerical simulation is based on a slide model that Geophysics 157, 875–897.
Dawson, S., Smith, D.E., 2000. The sedimentology of mid-Holocene
fits the new reconstructions of the Storegga slide. In this tsunami facies in northern Scotland. Marine Geology 170, 69–79.
model a larger portion of the slide occurs in the upper Dawson, A.G., Long, D., Smith, D.E., 1988. The Storegga Slides:
part of the slope where it is 400 m thick. Because of this, evidence from eastern Scotland for a possible tsunami. Marine Geology
the simulations of tsunami run-up at the Norwegian 82, 271–276.
coast are much more sensitive to changes in the De Blasio, F., Elverhøi, A., Issler, D., Harbitz, C.B., Bryn, P., Lien, R.,
2005. On the dynamics of subaqueous clay rich gravity mass flows—the
parameters describing the slide than areas to the west giant Storegga Slide, Norway. Marine and Petroleum Geology, this
of the slide. issue, doi: 10.1016/j.marpetgeo.2004.10.008.
(3) The time series derived from the numerical simulations Forsberg, C.F., 2002. Reconstruction of the pre-Storegga slide stratigaphy,
are compared to field observations of tsunami run-up Norsk Hydro Report 37-00NH-X15-00040.
from western Norway, Scotland, Shetland and the Grauert, M., Björck, S., Bondevik, S., 2001. Storegga tsunami deposits in a
coastal lake on Suderøy, the Faroe Islands. Boreas 30, 263–271.
Faeroe Islands. (a) If the slide developed as one block Haflidason, H., Lien, R., Sejrup, H.P., Forsberg, C.F., Bryn, P., 2005. The
sliding downwards, or with very short time lags (less dating and morphometry of the Storegga Slide. Marine and Petroleum
than 5 s) between the individual blocks, a slide with a Geology.
maximum velocity of 20 m/s fits the field observations Harbitz, C.B., 1992. Model simulation of tsunamis generated by the
best. (b) However, if the slide developed with a larger Storegga Slides. Marine Geology 105, 1–21.
Haugen, K.B., Løvholt, F., Harbitz, C.B., 2005. Fundamental mechanisms
time lag between the blocks a maximum velocity in the for tsunami generation by submarine mass flows in idealised
range of 25–30 m/s with a time lag of 15–20 s gives the geometries. Marine and Petroleum Geology, this issue, doi:
best agreement with the field observations. (c) A time 10.1016/j.marpetgeo.2004.10.016.
lag O30–40 s between the individual blocks will Hoppe, G., 1965. Submarine peat in the Shetland Islands. Geografiska
generate waves that are too small to match the field Annaler 47A 1965;, 195–203.
Kaland, P.E., 1984. Holocene shore displacement and shorelines in
observations. Hordaland, western Norway. Boreas 13, 203–242.208 S. Bondevik et al. / Marine and Petroleum Geology 22 (2005) 195–208 Kjemperud, A., 1986. Late Weichselian and Holocene shoreline Mei, C.C., 1989. The applied dynamics of ocean surface waves, displacement in the Trondheimsfjord area, central Norway. Boreas Advanced Series on Ocean Engineering, vol. 1. World Scientific, 15, 61–82. London p. 740. Kvalstad, T.J. Andresen, L., Forsberg, C.F., Berg, K., Bryn, P., Wangen, Nishimura, Y., Miyaji, N., 1995. Tsunami deposits from the 1993 Hokkaido M., 2005. The Storegga Slide: evaluation of triggering sources and slide earthquake and the 1640 Hokkaido Komagatake eruption, northern mechanics. Marine and Petroleum Geology, this issue, doi: Japan. Pure and Applied Geophysics 144, 719–733. 10.1016/j.marpetgeo.2004.10.019. Pedersen, G., Gjevik, B., Harbitz, C.B., Dybesland, E., Johnsgard, H., Langtangen, Lambeck, K., 1993. Glacial rebound of the British Isles-I. Preliminary H.P., (1995). Tsunami case studies and model analysis; Final GITEC report. model results. Geophysical Journal International 115, 941–959. Preprint Series. Dept. of Mathematics, University of Oslo, No. 4. Long, D., Smith, D.E., Dawson, A.G., 1989. A Holocene tsunami deposit in Svendsen, J.I., Mangerud, J., 1987. Late Weichselian and Holocene sea- eastern Scotland. Journal of Quaternary Science 4, 61–66. level history for a cross-section of western Norway. Journal of Løvholt, F., Harbitz, C.B., Braaten-Haugen, K., 2005. A parametric study of Quaternary Science 2, 113–132. tsunamis generated by submarine slides in the Ormen Lange/Storegga area Svendsen, J.I., Mangerud, J., 1990. Sea-level changes and pollen stratigrapy off western Norway. Marine and Petroleum Geology, this issue, doi: on the outer coast of Sunnmøre, western Norway. Norsk Geologisk 10.1016/j.marpetgeo.2004.10.017. Tidsskrift 70, 111–134.
You can also read