The increase of electric vehicle usage in Norway-incentives and adverse effects
←
→
Page content transcription
If your browser does not render page correctly, please read the page content below
Eur. Transp. Res. Rev. (2015) 7: 34
DOI 10.1007/s12544-015-0182-4

    ORIGINAL PAPER

The increase of electric vehicle usage in Norway—incentives
and adverse effects
Marie Aarestrup Aasness 1,2 & James Odeck 1

Received: 30 December 2014 / Accepted: 22 September 2015 / Published online: 8 October 2015
# The Author(s) 2015. This article is published with open access at SpringerLink.com

Abstract                                                                     road use is approximately the same as that for a conventional
Purpose Norway has been named the Bcapital^ of Electric                      vehicle.
Vehicles (EVs) because the purchase and use of EVs in                        Conclusions The incentives for EVs should consider the ad-
Norway has increased tremendously over the last few years.                   verse effects and how electricity is produced; the Norwegian
Currently, the fleet of EVs in Norway is the largest per capita              approach should not be followed by other countries without
in the world. From a transportation research perspective, the                due consideration of these factors.
questions immediately asked are (i) what economic incentives
make the purchase and use of EVs in Norway so attractive to                  Keywords Electric vehicle . Norway . Incentives . Adverse
road users; (ii) do these incentives have any adverse effects                effects
and, if so, how large are they; and (iii) how does the marginal
external cost of EVs compare to that of conventional vehicles.
Method We explore the above questions using available data,                  1 Introduction
the literature and personal observations while relating to the
city of Oslo as a case study.                                                Governments throughout the western world are currently con-
Results We find that the tremendous increase in the use of                   cerned with how to motivate people to start using electric
EVs is the result of multiple economic incentives, such as                   vehicles (EVs). EVs can deliver a more environmentally
exemption from toll charges, exemption from purchase duties                  friendly form of transport while simultaneously reducing de-
and permission to use transit lanes that induce road users to                pendence on oil. Emissions, e.g., CO2, NOx, or particulate
purchase and use EVs. The increase in EVs has led to a re-                   matter, can be reduced locally and overall if the efficiency of
duction in CO2 emissions. However, some of the EV incen-                     power generating plants is improved. In addition, the use of
tives have adverse effects, the most serious of which is the                 EVs may lead to a reduction in noise exposure compared to
exemption from toll charges, which has led to a sizable loss of              traditional vehicles. While EVs offer benefits to society, their
toll revenue. We find that the marginal external cost of EVs’                restrictions, such as a limited travel range or higher prices,
                                                                             have not been accepted by consumers in different parts of
                                                                             the world; thus, their sales volume has been very low.
This article is part of the Topical Collection on Driving Societal Changes       In Norway, however, the situation with regards to the pur-
towards an Electro-mobility Future                                           chase and use of EVs is quite different from that observed
                                                                             elsewhere in the world. In fact, there is currently EV Bfever^
* Marie Aarestrup Aasness                                                    in Norway. Tesla S and Nissan Leaf, both EVs, are at the top
  marie.aasness@vegvesen.no                                                  of car sales statistics in Norway. Figure 1 gives an overview of
     James Odeck                                                             developments in the purchase of EVs in Norway. As it is clear
     James.odeck@vegvesen.no                                                 from the figure, the purchase of EVs has almost doubled an-
1
     Department of Civil Engineering and Transport, The Norwegian            nually since 2012, and this trend is expected to continue, since
     University of Science and Technology, 7491 Trondheim, Norway            the government still encourages the use of EVs. It is these
2
     SVV-Region Øst, Østensjøveien 34, 0667 Oslo, Norway                     observations that have given Norway its status as the capital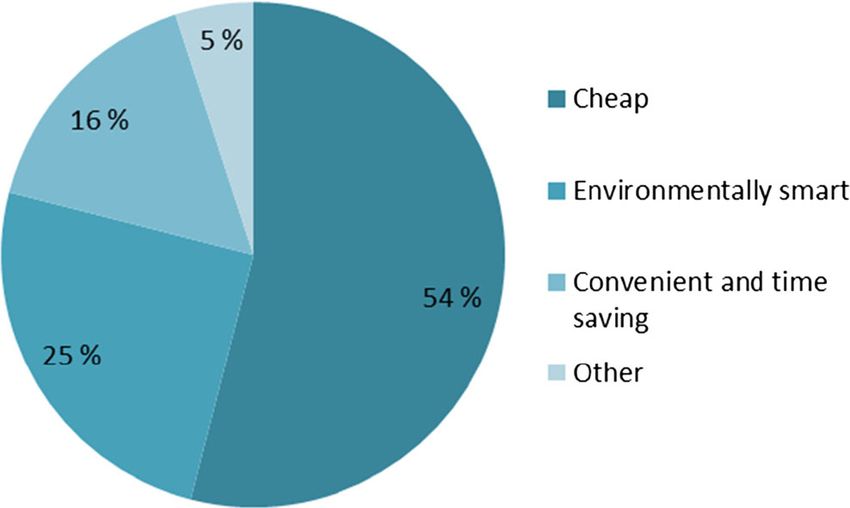
34 Page 2 of 8                                                                                     Eur. Transp. Res. Rev. (2015) 7: 34

Fig. 1 Registered EVs in
Norway. Source. http://www.
gronnbil.no/statistikk?lang=en_
US). ^Estimated for 2015

of EVs and that demonstrate the need for further study into the   population. These authors observed that the EV technology
drivers behind this increase, which we investigate in this        was good enough and that a set of incentives was necessary to
paper.                                                            achieving successful expansion of EV usage. Figenbaum and
   These formidable increases in the purchase and use of EVs      Kolbenstvedt [2] in their research report considered electro-
have been prevalent in the city of Oslo to such an extent that    mobility with regards to the experience in Norway. Their ma-
Oslo has been named the electric vehicle capital of the world     jor finding was that the Norwegian EV policy, with its many
[1]. This is particularly interesting because Oslo has a cordon   incentives and the establishment of Transnova (a body giving
toll system, where motorists pay tolls yet the impact of in-      financial support to charging facilities), has reduced the bar-
creasing EV usage given that one incentive for purchase is        riers for E-mobility, i.e., the purchase and use of EVs. They
exempting EVs from tolls has not been previously studied in       further observed that EV users are typically men in multi-car
the literature. From a transportation research perspective, the   households located in the largest city suburbs. In addition to
prevailing situation in Norway, and in Oslo in particular, with   these studies, there are a plethora of websites that both monitor
regards to the purchase and use of EVs raises several questions   and encourage the use of EVs in Norway and abroad; hence
e.g., whether the incentives to EV purchase and use are eco-      they often produce short articles about EVs in Norway; see,
nomically effective and efficient. In this paper we examine       for instance, Gronnbil.no; elbil.no and; Eurocitie.eu.
such questions as follows: we (1) address the incentives be-         Another interesting issue in the literature is a disagreement
hind the observed developments and how these have been            on whether Norwegian EV policy works as intended.
received by travelers in Oslo case study and, (2) examine         Holtsmark [5] addresses this question. He concludes that EV
and broadly assess the adverse effects caused by the incentives   owners should not be exempted from paying for road use,
in the case of the Oslo toll ring.                                parking fees and the energy they use and that it is difficult to
   The rest of the paper is organized as follows. Section 2 is    see why EVs should have access to bus lanes. Figenbaum and
brief literature review of EV policy in Norway. Section 3 gives   Kolbenstvedt [2], however, disagrees with Holtsmark [5] and
a short description of the methodology and data used.             concludes that the Norwegian EV policy does work as
Section 4 presents EV incentives and how they have worked         intended. In another critical study of Norwegian EV policy,
in Norway. Section 5 discusses the adverse effects of the in-     Holtsmark and Skonhoft [6] investigated the Norwegian sup-
centives. Concluding remarks are given in Section 6.              port and subsidy policy for EVs. They found that the usage of
                                                                  EVs implies very low costs to users on the margin and that it
                                                                  leads more driving at the expense of public transport and cy-
2 Literature review                                               cling. Moreover, because most EVs have a short driving
                                                                  range, the policy gives households incentives to purchase a
There are several reports and seminar papers in the literature    second car, again stimulating the use of private cars instead of
that have addressed EV policy in Norway. Hannisdahl et al.        public transport and cycling. Their conclusion is that the
[4] addressed the future of EVs in Norway and lessons learnt      Norwegian EV policy should be terminated as soon as possi-
to date. They observed that it is not the car producing nations   ble and that this policy should not be implemented by other
such as Sweden and Germany that have engaged aggressively         countries. Others dispute these conclusions from the perspec-
with EVs. Instead, Norway has led the rest of the pack in terms   tive of reaching climatic goals. For instance, Figenbaum and
of both implementing policy incentives and increasing the         Kolbenstvedt [2] find that not only Norwegian but also
number of EVs on the road compared to its total car               European climatic goals for average emissions from new cars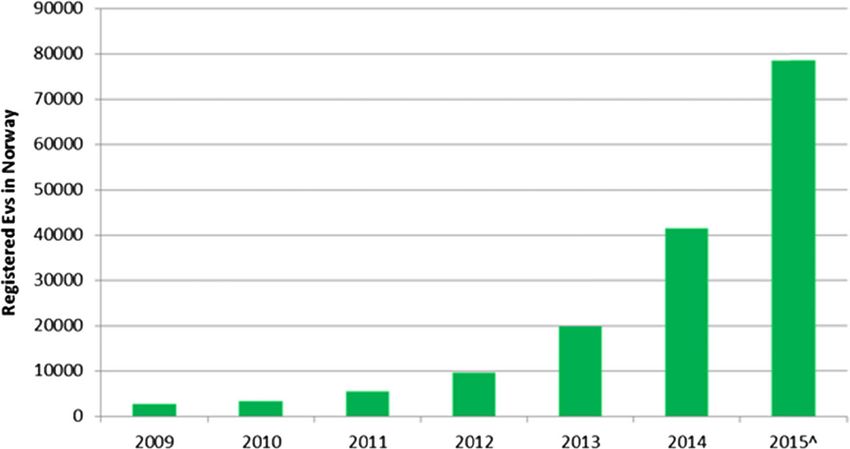
Eur. Transp. Res. Rev. (2015) 7: 34                                                                                          Page 3 of 8 34

can be reached with increased electro-mobility i.e., extensive       Incenves for EV’s purchase and use
use of EVs. The dispute among these Norwegian authors can                   (elbil.no; Figenbaum and
                                                                               Kolbenstvedt, 2013)
be further explored by examining the international literature
addressing similar situations in countries comparable to
Norway such as Sweden. Hultkratz and Liu [7] make a be-
fore–after comparison that indicates that the impact of the road                           Reducon of CO2                External Costs
toll in Stockholm on traffic volumes was smaller when the                                     emissions                     (NPRA's
                                                                                                                             handbook)
system was re-opened in 2007 compared to the effect during
the trial period in 2006. They found that the growth in the
share of exempted Bgreen^ cars and the decision to make                                      Reducon of                   EV and non
charges deductible from income taxes would considerably re-                                  drivers costs                   EV costs
duce the positive welfare effect of the toll at the time when the                                                          (gronbil.no)
Bgreen^ car exemption was abolished. What can be deduced
from the literature is that socio-economically, Norway’s EV                          ADVERSE EFFECTS
policy is not optimal, but may be the way forward to meet
                                                                                              Loss of
climate change.                                                                              Revenues

3 Methodology and data
                                                                                           Congeson on
The nature of this study implies a methodological approach                                  transit lanes
that combines the analysis of source data and the inherent
incentives in the Norwegian EV policy, and relatively simple
statistical procedures to examine the adverse effects of those
                                                                    Fig. 2 Illustrating the effects of EV incentives and their data sources
incentives with respect to the Oslo toll ring case study.
Figure 2 illustrates the effects of those incentives and their
                                                                    4 Benefits of incentives to purchase and use EVs
data sources.
                                                                    in Norway
   To describe the incentives behind the observed increase in
the purchase and use of EVs, we simply use information avail-
                                                                    The Norwegian EV incentive scheme has gradually developed
able on Norwegian EV organizations’ websites such as the
                                                                    over the years and dates back to 1990, when the government
Norwegian Electric Vehicle Association (elbil.no) and the
                                                                    exempted EVs from import and value added tax on a trial
Norwegian Green Vehicle organization (gronnbil.no).
                                                                    basis. This exemption became permanent in 1996. In the fol-
Further, we supplement this information with previous studies
                                                                    lowing year, 1997, EVs were exempted from road tolls in
such as Figenbaum and Kolbenstvedt [2].
                                                                    Norway. From this point on, a host of incentives have been
   To examine the adverse effects of the EV policy and to
                                                                    implemented including exemption from using transit lanes,
estimate the external costs to society in the case of Oslo,
                                                                    reduced company car tax, and exemption from car ferry fares.
we use relatively simple statistical procedures. For in-
                                                                    The overall goal of these EV incentives has been to bring the
stance, to calculate the revenue loss for the Oslo toll ring,
                                                                    purchase and use of EVs up to or beyond par with that for
we multiply the number of EVs crossing the toll by the
                                                                    similar conventional vehicles in Norway. An objective of the
toll rates they would have paid. Furthermore much of the
                                                                    government has been to achieve a proportion for the EV fleet
message that this paper conveys is obtained by comparing
                                                                    in the Norwegian road network of approximately 10 % by
data on costs between conventional vehicles and EVs that
                                                                    2020. A list of the incentives in place to meet these govern-
is readily available from the Norwegian Electric Vehicles
                                                                    ment objectives and the time that they became permanent is
Association (Elbil.no).
                                                                    shown in Table 1 below.
   Data on traffic were mainly gathered from the Oslo toll
ring company. The data included toll rates and the number
of vehicles crossing the tolls divided by different vehicle         4.1 Savings for EV users
categories, e.g., EVs, non-EVs, heavy passenger vehicles,
etc. Data on congestion costs was taken from Rekdahl                To understand how powerful the above incentives are, consid-
et al. [11]. These costs were then multiplied by the num-           er first the exemption from taxes. Conventional vehicles are
ber of EVs in the toll ring to derive the external cost of          heavily taxed in Norway compared other comparable
EVs. Data on CO2 emissions were taken from the                      European countries. Import duties on vehicles are charged
NPRA’s handbook for impact assessment.                              according to their weight, CO2 emissions, motor effects and
34 Page 4 of 8 Eur. Transp. Res. Rev. (2015) 7: 34
Table 1 The implemented EV incentives
Incentive Trial-period Permanent year
Temporary Exemption from on-off registration tax 1990–1995 1996
Exemption from annual vehicle tax – 1996
Exemption from road tolls – 1997
Exemption from parking fees on municipal owned parking facilties – 1999
Reduced company car tax – 2000
Exemption from VAT 2001
Temporary use of transit lanes 2003–2005 2005
Parmanent use of transit lanes – 2005
Further reduction in company car tax 2009
Exemptionion from paying car ferry fees – 2009
NOx emissions. In addition, there is an additional Valued parking spaces, and (4) in municipality owned parking spaces,
Added Tax (VAT) of 25 % of the purchase value. EVs are battery charging is free.
completely exempted from these import duties (taxes) and From the discussion above, it is quite clear that the sole
the VAT; see Table 1. The impact of these tax exemptions is incentive behind the formidable increase in the purchase and
that the total cost of vehicle ownership for EVs generally use of EVs in Norway is economic motivations, whereby EV
compares favorably with that of conventional vehicles. road transport users (EV car users) obtain financial gains that
According to the government program, the current tax ben- would not be possible with the use of a conventional vehicle.
efits for the purchase and use of EVs will be sustained until the This is confirmed by a comparison between users’ attitudes
year 2017, as long as the number of EVs in road traffic does towards purchasing an EV in Norway with Sweden and
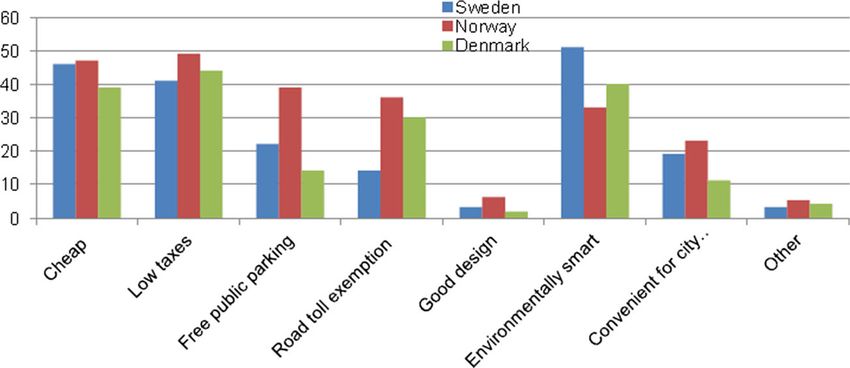
not exceed 50 000 vehicles. Perhaps because of this limit, the Denmark, where such benefits are not available. Figure 3,
last 3 years have seen an explosion in the purchase and use of shows results from a survey by Michelin [9], asking about
EVs in Norway, as observed in Fig. 1; consumers are striving the main reasons for buying an electric car including the price
to enjoy the tax benefits of EVs while they still can, and they of EVs compared to conventional vehicles, differences in tax-
are not necessarily being environmentally friendly. With the es, whether or not free parking was available for EVs, etc.
entry of Tesla in the EV market and the emerging battery The responses are revealing and are in accordance with the
technology that allows EVs to continually cover longer dis- EV incentives in Norway: Norwegian respondents would,
tances, the total cost of owning an EV is also becoming favor- more than their Scandinavian counterparts, consider purchas-
able in terms of distance covered compared to conventional ing an EV because overall costs such as purchase price, taxes,
vehicles. parking, and tolls are low or equal to zero. This enforces our
Yet another powerful EV incentive shown in Table 1 is earlier observation that EVs are purchased and used because
related to cities and thus may be another factor in Oslo’s status of the incentives put in place by the government and economic
as the capital city of EVs. EVs are allowed to access transit motivations.
lanes and, in addition, are exempted from paying road tolls, To underline the observations above with regards to the
which are very common in the larger cities of Norway. The available EV incentives in Norway, the operational cost of
use of transit lanes is convenient and readily converts to time using an EV is compared to that of using a conventional ve-
savings, especially during rush hour. Because time saved is hicle through a 5-year period in Table 2.
equivalent to money, this too is an economic benefit. Adding Based on Table 2, consider a Norwegian vehicle user as a
these benefits to the exemption of road tolls, the economic rational consumer who wants to save on the operational costs
benefits of owning and using EVs represents a formidable cost of using his vehicle. Per year, the EV user saves 3 275 euros:
savings that further induces the purchase and use of EVs in 273 euros monthly and 16 375 over a 5-year period. This is a
cities. large amount of savings that certainly encourages Norwegians
There are other additional powerful economic incentives to buy and use in EVs, especially in cities with scarce parking
reported in Table 1 that encourage the purchase and use of spaces and costly road tolls. Finally, consider a Norwegian
EVs within and outside of cities in Norway. These are as study conducted in July 2014 to infer why Norwegians buy
follows: (1) EVs are exempted from paying the numerous EVs. Figure 4 summarizes the results of that study.
car ferry fares on the national road network, (2) EVs have only Figure 4 confirms the results in Table 2 to the extent that the
a 50 % taxable benefit if used as a company car, (3) EVs are main reason for buying EVs is that they are cheaper to pur-
exempted from parking fees in all municipality-owned chase and use compared to conventional vehicles. From theseEur. Transp. Res. Rev. (2015) 7: 34 Page 5 of 8 34
Fig. 3 Reasons for wanting to
buy an electric car at next vehicle
purchase in Sweden, Denmark
and Norway. Source: Michelin [9]
results, we conclude that economic incentives have led to the The last column of Table 3 shows the estimated annual sav-
observed explosion of EV purchase and use in Norway. ings for 2015.
A caution is now necessary with regards to the potential
reduction in CO2 emissions by EVs. This reduction depends
4.2 External cost reductions on how the electricity used in EVs is generated. In areas where
coal dominates in the production of electricity, such as China,
Incentives to use EV can have also a positive effect in terms of EVs perform more poorly than the most fuel-efficient gasoline
greenhouse gas emissions. By considering the CO2 emission cars; see, for instance, Ji et al. [8] and Holtsmark [5].
by type of vehicle multiplied by the cost of CO2 per ton Therefore, the Norwegian strategy for EVs should not be im-
emitted according the Norwegian Handbook for impact as- plemented by other countries without considering the main
sessment, the gains of changing from a conventional vehicle source of electricity production. For Norway, the strategy is
to an EV can be derived. Table 3 provides such a calculation; reasonable in this respect because electricity is produced
data for emissions by different vehicles were obtained from through hydropower.
ofvas.no. Marginal external costs—or the negative externalities of
As is evident from Table 3, moving from a conventional road transport—refer to the costs that vehicles inflict on other
vehicle to an EV represents an average cost savings in terms of agents or on the environment. Typically, such external costs
CO2 emissions. Note the low cost savings from moving from include air pollution, noise, congestion, accidents, infrastruc-
an Opel Ampera to an EV (Nissan Leaf); this is because Opel ture damage (wear), operations and, of course, CO2 or green-
Ampera is plug-in hybrid and thus does not emit as much as a house emissions.
conventional vehicle such as the Volvo V60. Further note that It is often difficult to quantify all of the elements of
these costs are per km; to derive the cost per year for each car, marginal external costs for vehicles because such costs
the figures must be multiplied by the average distance cov- vary by, e.g., vehicle type, where the transportation oc-
ered, which is assumed to be 13,300 per year. For instance, the curs, and the geographic position of vehicles. However, in
per year CO2 cost for Volvo V40 is 13,300*0.0024 = 32 Euro. many European countries, attempts are often made to
Table 2 Comparing the
operational cost of an EV and a Values in Euros (1 Euro = 8.8 NOK 2015)
conventional vehicle through a 5-
year period (source gronnbil.no Cost Nissan LEAF VAT share Conventional vehicle VAT share Difference
period)
Loss of value 12 516 0 13 091 2 618 −575
Financing 3 830 0 5 182 0 −1 351
Annual tax 230 0 1 639 0 −1 409
Maintenance 2 273 455 2 614 523 −341
Energy 1 705 341 8 949 1 790 −7 244
Parking 0 0 1 364 2 727 −1 364
Road tolls 0 0 4 091 0 −4 091
Sum 20 554 795 36 929 7 658 −16 375
Per year 4 111 159 7 386 1 532 −3 275
Per month 343 13 615 128 −27334 Page 6 of 8 Eur. Transp. Res. Rev. (2015) 7: 34
5 The adverse effects of EV incentives
The Norwegian EV incentive was initiated to promote the use
of alternative fuels and more environmentally friendly tech-
nology. To this end, the incentives must be regarded as highly
successful in the sense that they have led to the increased
purchase and use of EVs in Norway and hence have led to a
reduction in greenhouse gas emissions. From this and strictly
speaking, the only economically efficient incentive to achieve
greenhouse gas reduction should be the gasoline tax, which is
presumably set to account for emissions ([10]:8). However,
Fig. 4 Main reasons for buying an EV. Source: elbil.no because EVs do not consume gasoline and hence are already
exempted from gasoline taxes, exemptions from purchase
duties may be regarded as just enough to induce their use.
derive such marginal external costs per kilometer driven All other forms of incentives, such as in the Norwegian case,
and by vehicle type. In the case of Norway, such deriva- have severe adverse effects as follows:
tion was recently made by Thune-Larsen et al. [13]. In
that report, however, EVs were not included because the & Exemption from tolls. Tolls are meant to finance road in-
calculation of the marginal cost of CO2 was not possible frastructure, which is needed by all types of vehicles in-
at the time. The report concluded that the marginal exter- cluding EVs. Exempting EVs from tolls has an adverse
nal cost for EVs would not be too different from that for effect because it reduces toll income, leading to the insuf-
conventional vehicles because the marginal external cost ficient and untimely supply of road infrastructure; it is
of CO2 is expected to be small. In Table 4, we report the counter-intuitive. The same argument can be used against
results from Thune-Larsen et al. [13]. exemptions from paying for ferry services.
As the table shows, most of these marginal external & Exemption from parking fees. Parking fees are meant to
costs will also be caused by EVs. For instance, accidents reflect the alternative cost of parking spaces. EVs occupy
are by far the largest component of marginal external parking spaces just like any other vehicle and, hence,
costs, and there is no reason to believe that EVs are less should pay for their use of the parking space. Free parking
prone to accidents compared to their conventional coun- for EVs amounts to economic loss; the incentive is hence
terparts. In fact, due to the noiseless characteristic of an an adverse effect.
EV, some believe that EVs are more prone to accidents & Use of transit lanes. Transit lanes are reserved for public
involving pedestrians and especially those who are blind, transport in urban areas as a means of encouraging the use
visually and hearing impaired. Therefore, we believe that of this transport. All other users of transit lanes, especially
the marginal external costs of EVs are almost the same as during rush hour, will lead to adverse effects in terms of
those of conventional vehicles; our calculation for CO2 congesting transit lanes, incurring additional travel costs
cost per km gave a value of 0.0024 Euro, which should for public transport users.
be added in the table above for the conventional vehicle.
However, this is a small value and barely has an effect on Below, we illustrate the magnitudes of some of these ad-
the sum of the marginal external costs. verse effects.
5.1 The study case of Oslo toll ring
Table 3 Marginal external cost per km with regards to CO2. Source:
ofvas.no and SINTEF [12]. (1Euro = 8.8NOK 2015) The adverse effects of EV incentives discussed above can be
elaborated by using observations from the Oslo toll ring.
g/km Cost/km Average cost Annual savings Consider, first, the use of transit lanes by EVs. Figure 5 shows
per car per year 2015a
the percentage delay in travel time on transit lanes by week of
Nissan Leaf 0 0 0 0 the year and number of EVs on two road segments along route
Opel Ampera 27 0.0006 9 671,682 E18 in the Oslo region. It is clear from the figure that the travel
Volvo V40 101 0.0024 32 2,512,587 time on transit lanes has increased and is proportional to the
VW Golf 114 0.0027 36 2,835,989
increase in EVs using transit lanes; in week 10, the travel time
Volvo V60 118 0.0028 37 2,935,497
in transit increased by a formidable 15 and 30 %, respectively,
for the two road segments from 2013 to 2015. For the 90th
a
Estimated number of EVs percentiles, i.e., the point below which 90 % of theEur. Transp. Res. Rev. (2015) 7: 34 Page 7 of 8 34
Table 4 Marginal external costs
(Euro) in Norway without CO2 Air pollution Noise Congestion Accidents Infstrastructure damage Operations Sum
(source: Thune-Larsen et al. [13])
(1Euro = 8,8NOK 2015) Petrol 0.01 0.00 0.01 0.04 0.00 0.01 0.06
Diesel 0.02 0.00 0.01 0.06 0.01 0.01 0.11
LPG 0.01 0.00 0.01 0.04 0.00 0.01 0.07
CNG 0.07 0.01 0.04 0.04 0.03 0.01 0.19
observations fall, the travel time delay is even higher, as it has less than double because we expect the government to remove
increased by 40 and 50 %, respectively, in week 10 from 2013 some of the adverse incentives in 2017, leading to fewer peo-
to 2015. ple being willing to purchase EVs. Revenue loss in year t (RLt)
This clearly illustrates that allowing EVs to use transit lanes is calculated by multiplying the number of EVs (EVt) with the
has an adverse effect on road-based public transport. toll price (pt):
Next, consider the loss of toll revenues as a result of
RLt ¼ EV t pt ð1Þ
EVs being exempted from road tolls in the case of Oslo.
The current Oslo toll ring system was implemented in Using the current toll price of 30 NOK, the calculated rev-
1990 to generate funds for road investments in the larger enue loss in the year 2012 was
Oslo area. Currently, approximately 60 % of toll income
is being used for investments and for the maintenance of RL2012 ¼ EV 2012 *p2012 ¼ 814047*30 ¼ 24 421 410 NOK ¼ 2775160 Euro
public transport. The use of a large share of toll income ð2Þ
on public transport may be seen as strategy to induce
people to use public transport. It follows then that if Table 5 shows the annual revenue loss for the period 2012–
EVs are exempted from paying tolls, toll revenue from 2013 and the annual expected revenue loss for the period
the toll ring will decrease. 2014–2020. It is clear from the table that exempting EVs from
We estimated the expected revenue loss for the 2012–2020 paying tolls leads to large revenue losses, which for the year
period. We assumed that the number of EVs passing toll 2012 was at 2,7 million Euro and which is expected to be a
points will continue to double, i.e., increase by 100 % annu- formidable 95 million Euro for the year 2020; based on the
ally until 2017. After this point, the increase is expected to be assumptions discussed above.
Development in travel me versus number of EVs on transit lanes
60 % 1600
1500
50 %
1400
Change in travel Time
40 %
1300
30 % 1200 Number of EVs
1100
20 %
1000
10 %
900
0% 800
10 21 39 10 21 39 10
2 0 13 2 0 14 2 015
Number of Evs 971 1067 1173 1289 1413 1465 1516
Avg. travel me(Ikea slependen - Oksenøyveien) 0% 9.8 % 3.1 % 5.5 % 7.3 % 17.6 % 20.7 %
90 percenl 0% 14.2 % 5.2 % 18.5 % 29.6 % 53.6 % 50.1 %
Avg. travel me(Holmen -Øksenøyveien) 0% 5.8 % 8.4 % 11.1 % 18.5 % 30.4 % 36.8 %
90 percenl 0% 3.4 % 11.2 % 13.2 % 13.9 % 46.9 % 43.6 %
Week of Year
Fig. 5 The adverse effect of EV incentives on travel time in transit lanes (source: Unpublished traffic counts, Norwegian Public Roads Administration
(This data is available on request to the authors.) (vegvesen.no))34 Page 8 of 8 Eur. Transp. Res. Rev. (2015) 7: 34
Table 5 Revenue loss not be copied by other countries; it also matters how electric-
and expected revenue Euro in Mill
ity, which is fuel for EVs, is produced—only hydropower
loss. (1Euro = 8.8NOK
2015) Annual revenue loss 2012–2013 produced electricity, as in Norway, offers a positive impact
2012 2,7 on greenhouse gas emissions.
2013 5,7
Annual expected revenue loss 2014–2020 Acknowledgments We thank Professor Pierluigi Coppola at the Uni-
versity of Rome Tor Vergata for very useful comments while writing this
2014 11,3 paper. Any shortcomings are however, ours. We also thank the Norwe-
2015 22,6 gian Public Roads Administration for sponsoring this study.
2016 45,2
Open Access This article is distributed under the terms of the
2017 90,5
Creative Commons Attribution 4.0 International License (http://
2020 95 creativecommons.org/licenses/by/4.0/), which permits unrestricted use,
distribution, and reproduction in any medium, provided you give appro-
priate credit to the original author(s) and the source, provide a link to the
It should be here noted that we are not the first to note the Creative Commons license, and indicate if changes were made.
danger of these incentives. For instance, Halvorsen and
Frøyen [3] noted that there is good reason to question whether
maintaining these incentives in the form they have today is References
desirable for the urban transport situation and land use in the
long term. To this, we add that the adverse effects of the 1. Euro Cities (2014) Oslo, electric vehicle capital of the world. http://
wsdomino.eurocities.eu/eurocities/news/Oslo-electric-vehicle-
Norwegian EV incentives are so many and so large that any
capital-of-the-world-WSPO-9R6ECM
country wishing to encourage the use of EVs should not fol- 2. Figenbaum E, Kolbenstvedt M (2013) Electromobility in Norway-
low them without care. experiences and opportunities with Electric vehicles. Institute of
Transport Economics, Norway. Report No. 1281/2013
3. Halvorsen B, Frøyen Y (2009) Trafikk i kollektivfelt. Kapasitet og
avvikling. Elbilens rolle. Rapport fra Asplan Viak
6 Concluding remarks 4. Hannisdahl OH, Malvik HV, Wensaas GB (2013) The future is
electric! The EV revolution in Norway–explanations and lessons
The objective of this paper has been to explore the reasons learned. In: EVS27 International Battery, Hybrid and Fuel Cell
Electric Vehicle Symposium. Barcelona
behind the tremendous increase of EVs in Norway that has led
5. Holtsmark (2012) Elbilpolitikken – virker den etter hensikten?
Norway to be the number 1 country for EVs. We find that the Samfunnsokonomen nr 5 2012
Norwegian government has used a wide range of economic 6. Holtsmark B, Skonhoft A (2014) The Norwegian support and sub-
incentives that have made EVs much cheaper to purchase and sidy policy of electric cars. Should it be adopted by other countries?
use. Among the incentives are exemptions from taxes, toll Working paper series No. 2/2014. Norwegian University of Science
and Technology
charges, parking fees and access to transit lanes. Translated 7. Hultkratz L, Liu X (2012) Green cars sterilize congestion charges: a
into money, these incentives are a huge savings and naturally model analysis of the reduced impact of Stockholm road tolls.
have induced Norwegians to buy and use EVs in large num- Elsevier
bers. We also find that many of these incentives have some 8. Ji S, Cherry CR, Bechle MJ, Wu Y, Marshall JD (2012) Electric
vehicles in China: emissions and health impacts. Environ Sci
unintended effects. For instance, exemption from toll pay- Technol 46:2018–2024
ments has resulted in a reduction in toll revenues, and access 9. Michelin (2013) Intervjuundersøkelse om dekk og bilbruk.
to transit lanes has resulted in congestion on those lanes, lead- Datautskrifter fra PFM Research. Michelin Nordic, Oslo
ing to increased travel time for public transport users. We note 10. NOU (2007:8) En vurdering av særavgiftene. Report appointed by
the Ministry of Finance in Norway
and illustrate why such types of incentives should not be given 11. Rekdal J, Larsen OI, Steinsland C, Zhang W (2012) Eksempler på
to EV users. Furthermore, the ability of EVs to reduce green- analyser av køprising med TRAMOD_BY, rapport 1208.
house gas emissions depends on how electricity is produced. Møreforskning Møre AS
Our conclusions are therefore that the incentives have helped 12. SINTEF (2011) Dokumentasjon av modul og beregning av
energibruk og klimagassutslipp i EFFEKT.
increase the number of EVs and, as a consequence, reduced 13. Thune-Larsen H, Veisten K, Rødseth KL, Klæboe R (2014)
greenhouse gas emissions. However, we warn that the Marginal external cost of road transport. Institute of Transport
Norwegian incentives have led to adverse effects and should Economics, Norway. Report 1307/2014You can also read