Effect of reducing the posted speed limit to 30 km per hour on pedestrian motor vehicle collisions in Toronto, Canada - a quasi experimental ...
←
→
Page content transcription
If your browser does not render page correctly, please read the page content below
Fridman et al. BMC Public Health     (2020) 20:56
https://doi.org/10.1186/s12889-019-8139-5

 RESEARCH ARTICLE                                                                                                                                 Open Access

Effect of reducing the posted speed limit to
30 km per hour on pedestrian motor
vehicle collisions in Toronto, Canada - a
quasi experimental, pre-post study
Liraz Fridman1,2,3,4,5* , Rebecca Ling4, Linda Rothman6, Marie Soleil Cloutier7, Colin Macarthur4,
Brent Hagel1,2,3,8 and Andrew Howard4

  Abstract
  Background: Pedestrian related deaths have recently been on the rise in Canada. The effect of changing posted
  speeds on the frequency and severity of pedestrian motor vehicle collisions (PMVC) is not well studied using
  controlled quasi-experimental designs. The objective of this study was to examine the effect of lowering speed
  limits from 40 km/h to 30 km/h on PMVC on local roads in Toronto, Canada.
  Methods: A 30 km/h speed limit on local roads in Toronto was implemented between January 2015 and December
  2016. Streets that remained at a 40 km/h speed limit throughout the study period were selected as comparators. A
  quasi-experimental, pre-post study with a comparator group was used to evaluate the effect of the intervention on
  PMVC rates before and after the speed limit change using repeated measures Poisson regression. PMVC data were
  obtained from police reports for a minimum of two years pre- and post-intervention (2013 to 2018).
  Results: Speed limit reductions from 40 km/h to 30 km/h were associated with a 28% decrease in the PMVC incidence
  rate in the City of Toronto (IRR = 0.72, 95% CI: 0.58–0.89). A non-significant 7% decrease in PMVC incidence rates were
  observed on comparator streets that remained at 40 km/h speed limits (IRR = 0.93, 95% CI: 0.70–1.25). Speed limit
  reduction also influenced injury severity, with a significant 67% decrease in major and fatal injuries in the post
  intervention period on streets with speed limit reductions (IRR = 0.33, 95% CI: 0.13–0.85) compared with a 31% not
  statistically significant decrease in major and fatal injuries on comparator streets (IRR = 0.69, 95% CI: 0.37–1.31). The
  interaction term for group and pre-post comparisons was not statistically significant (p = 0.14) indicating that there was
  no evidence to suggest a pre-post difference in IRRs between the intervention and comparator streets.
  Conclusions: Declines in the rate of PMVC were observed on roads with posted speed limit reductions from 40 km/h
  to 30 km/h, although this effect was not statistically greater than reductions on comparator streets.
  Keywords: Speed limit, Pedestrian motor vehicle collision (PMVC)

* Correspondence: liraz.fridman@gmail.com
1
 Departments of Paediatrics and Community Health Sciences, Cumming
School of Medicine University of Calgary, Calgary, Alberta, Canada
2
 Alberta Children’s Hospital Research Institute, Calgary, Alberta, Canada
Full list of author information is available at the end of the article

                                         © The Author(s). 2020 Open Access This article is distributed under the terms of the Creative Commons Attribution 4.0
                                         International License (http://creativecommons.org/licenses/by/4.0/), which permits unrestricted use, distribution, and
                                         reproduction in any medium, provided you give appropriate credit to the original author(s) and the source, provide a link to
                                         the Creative Commons license, and indicate if changes were made. The Creative Commons Public Domain Dedication waiver
                                         (http://creativecommons.org/publicdomain/zero/1.0/) applies to the data made available in this article, unless otherwise stated.
Fridman et al. BMC Public Health (2020) 20:56 Page 2 of 8
Background posted speed limit from 40 km/h to 30 km/h on all local
In 2015, pedestrians accounted for 15% of all road traffic- roads within 12 Municipal Wards in the Toronto and
related deaths in Canada [1]. In addition, a 2011 OECD re- East York District (see Fig. 1) [13]. The location of
port noted that Canada was one of only seven industrialized streets with speed limit reductions and the dates of im-
nations where pedestrian-related deaths had increased over plementation of the intervention were obtained from the
time [2, 3]. In the City of Toronto, over the 12-year period City of Toronto, Transportation Services Division. Street
2005 to 2016, inclusive, 2172 pedestrians were killed or ser- names were used to identify street segments within a
iously injured after being struck by a motor vehicle [4]. map of the Toronto road network, (using ArcMap 10.5.1)
Lower speed roads are associated with a reduced risk to determine the number and length of street segments
of pedestrian motor vehicle collision (PMVC) as well as that had posted speed limit reductions.
less severe PMVC injuries [5]. A comprehensive litera-
ture review that examined pedestrian fatality risk as a Comparator streets
function of car impact speed showed that for every 1.6 Comparator streets were selected in the Scarborough Dis-
km/h reduction in speed, PMVC frequency was reduced trict where local roads with posted speed limits of 40 km/
by 5% [6]. The chance of surviving a collision with a h remained unchanged throughout the study period, be-
motor vehicle traveling at 50 km/h is less than 20%; tween January 2013 and December 2018 (see Fig. 1). Data
whereas, survival increases to 50% at 40–45 km/h and on posted speed limits in the City of Toronto were ob-
90% at 30 km/h [1]. Globally, studies in South Africa, tained from a publicly available database [14]. Comparator
New Zealand, Europe, and North America have shown streets were included if the speed was marked as “con-
that average vehicle speeds are reduced by 8–40% after firmed” and “no change” in the dataset. Last, a data quality
speed limits are lowered from 60 km/h to 50 km/h [7]. A check was performed on 20% of the streets to confirm that
meta-analysis of impact speed and pedestrian fatality risk streets had a 40 km/h posted speed limit throughout the
supports setting speed limits of 30–40 km/h for high entire study period. This was completed using Google
pedestrian activity areas as the risk of a fatality reaches Street View, which provided historical data from 2013 to
5% at an estimated impact speed of 30 km/h [8]. Al- 2018 to verify 40 km/h posted speed limit signs.
though many studies report a reduction in severe PMVC
injuries and crash risk after lowering speed limits, speed Outcome data
limit reductions have not been well studied using con- Toronto Police Service data were used to identify all
trolled quasi experimental designs [5, 9, 10]. PMVC from January 2013 to December 2018. If there
Reasons for the increased likelihood of a crash at was insufficient information in the police report to con-
higher speeds include a reduced field of vision, shorter firm where the collision occurred, the PMVC was ex-
reaction time, and increased stopping distance once the cluded from the analysis. All PMVC were then mapped
brakes are engaged. At lower speeds, pedestrians can and assigned to either a “speed limit reduced street seg-
make more effective decisions about when to cross the ment” or “comparator street segment”. PMVC that oc-
road and drivers have sufficient time to stop [11]. Tor- curred within an intersection (+/− a 25-m zone
onto’s Vision Zero Road Safety Plan has proposed posted surrounding the intersection) were included if: [1] the
speed limit reductions from 40 km/h to 30 km/h on local direction of travel; and/or [2] the road classification on
roadways in an effort to reduce severe and fatal PMVC the police report indicated that the PMVC occurred on
injuries [4, 12]. However, there are few pre-post studies a speed limit reduced street or comparator street. Since
that examine the effect of such speed limit reductions speed limit reductions occurred in 2015 and 2016,
on PMVC. The aim of this study was to examine the ef- PMVC data on speed limit reduced street segments were
fect of reducing posted speed limits from 40 km/h to 30 available for a minimum of 2-years pre-, and 2-years
km/h on incident rates of PMVC in Toronto, Canada. post-implementation of the intervention. For compara-
tor streets, PMVC data were available for 3 years pre-
Methods and post- based on the midpoint of the study period.
Study design For descriptive purposes and stratified analyses, add-
A quasi-experimental, pre-post study design with a com- itional information on the police reports that were ob-
parator group was used. Ethical approval of the study tained included: pedestrian age, injury severity, and
was obtained from the Hospital for Sick Children Re- collision location (intersection or midblock), as well as
search Ethics Board (REB#: 1000059622). environmental conditions (traffic control devices, visibil-
ity, lighting, and road surface). Pedestrian age was cate-
Intervention gorized as child (0 to 15 years), adult (16 to 59 years)
Between January 2015 and December 2016, [12] the City and older adult (60 years and over). Injury severity was
of Toronto used a blanket approach and reduced the classified in the police reports as: no injury, minimalFridman et al. BMC Public Health (2020) 20:56 Page 3 of 8
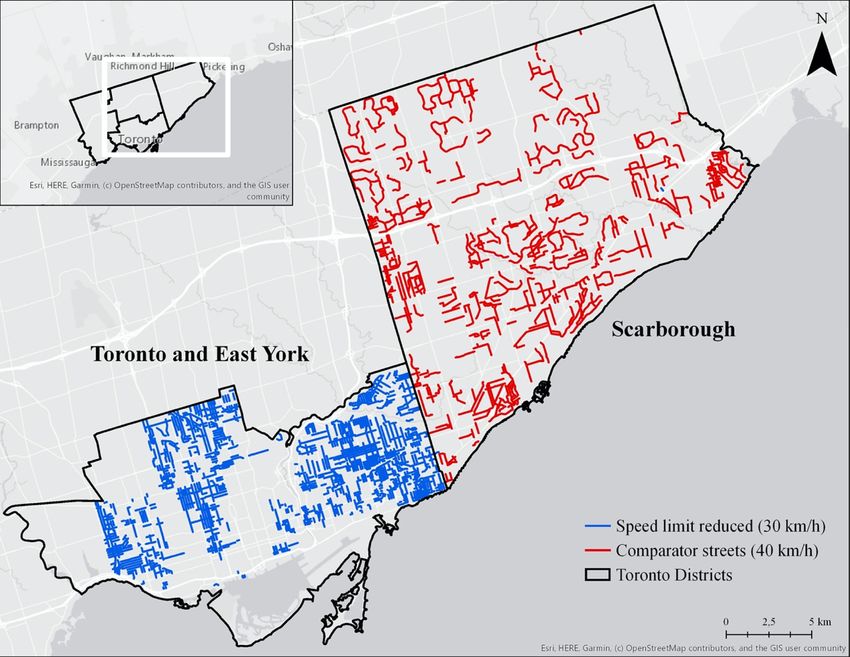
Fig. 1 Map of 30 km/h Speed Limit Reduced Streets and 40 km/h Comparator Streets in Toronto. Intervention streets with speed limit reductions
from 40 km/h to 30 km/h are shown in blue and are mainly located in the Toronto and East York District. Comparator streets that remained at a
40 km/h posted speed limit are shown in red and were selected from the Scarborough District. Speed limit reductions were applied to all
neighborhood roads in Toronto and East York district, irrespective of the actual collision frequency
injury (no medical attention); minor injury (seen in an pavement markings, flashing beacons, school signage,
emergency department); major injury (hospital admis- and zebra crosswalks). Spatial coordinates of the co-
sion); and fatal injury. For this study, minimal and minor intervention locations were obtained from the City of
injuries were combined into a single category as these Toronto Open Data Catalogue [15]. ArcGIS, was used to
types of injuries are commonly misclassified in police re- identify the number of speed limit reduced and com-
ports. Major and fatal injuries were also combined into parator street segments that had senior safety zones,
one category because of the small numbers in each cat- flex-post signs, red light cameras, and watch your speed
egory. Environmental conditions were classified as: traf- boards, as well as those within 250-m of schools with
fic control devices (none or any), visibility (clear or implemented safety zone interventions.
other), lighting conditions (daylight or other), and road
surface conditions (dry or other). Statistical analyses
All statistical analyses were conducted using SAS V.9.4.
Co-interventions To evaluate the effect of reducing posted speeds from
Information on other speed-related co-interventions on 40 km/h to 30 km/h on PMVC rates, we compared the
local roads was also gathered to account for potential rate of PMVC on street segments before and after the
bias. This included information on senior safety zones, intervention (and against comparator streets where
flex-post signs, red light cameras, watch your speed posted speed limits remained at 40 km/h) using repeated
boards, and school safety zone interventions (such as measures Poisson regression. A similar statisticalFridman et al. BMC Public Health (2020) 20:56 Page 4 of 8
approach has previously been used to study the effects 230 were fatal. From 2013 to 2018, on average, the an-
of other traffic safety interventions such as street car nual incidence of PMVC decreased by approximately 1%
right of way, crossing guards, pedestrian countdown sig- (1731 to 1718, respectively). During the time period of
nals, and speed humps [16–19]. Generalized estimating study, there were 382 PMVC that occurred on 850 speed
equations with an autoregressive correlation structure limit reduced roadway segments and 292 PMVC that oc-
were used to fit the models to account for repeated ob- curred on 390 comparator street segments.
servations of the roadway segments. PMVC rates were Table 1 shows the frequency of PMVC by implemen-
calculated as the number of collision events per 100 km tation of the intervention (pre, post) and by season
per month. A pre-post predictor variable was created to (summer, winter) along with IRRs and 95% CIs for inter-
categorize collisions that occurred before the installation vention and comparator streets. Table 2 shows PMVC
date (pre) and after the installation date (post). Colli- frequency, by age, injury severity, location, and environ-
sions that occurred on the same day of the installation mental conditions along with IRRs and 95% CIs for
were excluded because installing new speed limit signs intervention and comparator streets.
may have affected vehicle travel speeds and PMVC risk. As shown in Table 1, the PMVC per 100 km per
For comparator streets, since there was no reduction in month was 1.99, pre-intervention (i.e. at posted max-
posted speed limits, we used the midpoint date of the imum speeds of 40 km/h) and 1.43, post intervention
study period (i.e. January 1, 2016) to define the pre and (i.e. at posted maximum speeds of 30 km/h). This repre-
post period for the analysis. To take into account sea- sents a statistically significant 28% decrease in the
sonal effects which have been reported in other studies PMVC rate following implementation of the interven-
[18, 19], the model included season of collision, catego- tion, after adjusting for season (IRR post- versus pre-:
rized as summer (April to September) and winter (Octo- 0.72, 95% CI: 0.58–0.89). There was no material differ-
ber to March). We ran stratified models for speed limit ence in PMVC rate between summer (1.77/100 km/
reduced streets (Model 1) and comparator streets month) and winter (1.72/100 km/month); IRR winter
(Model 2) to evaluate separate pre-post comparisons in versus summer (0.98, 95% CI: 0.79–1.21). For compara-
each group. Additional analysis of PMVC by age, injury tor streets (i.e. streets that remained at 40 km/h speed
severity, location, traffic control devices, visibility, light- limits throughout the period of study), the PMVC per
ing, and road surface conditions were examined using 100 km per month was 1.45 in the pre-period and 1.35
similar stratified models for both intervention and com- in the post period. This represents a 7% decrease in
parator groups. A model including all intervention and PMVC rate after adjusting for season; however, this de-
comparator streets together was estimated including an crease was not statistically significant (IRR post- versus
interaction term for the pre vs post and intervention vs. pre-: 0.93, 95% CI: 0.70–1.25). There was a significant
comparator group comparisons. Lastly, sensitivity ana- difference in PMVC rate between summer (1.06/100 km/
lyses which excluded streets with co-interventions were month) and winter (1.74/100 km/month). The PMVC
performed for both intervention and comparator groups. rate significantly increased by 64% in the winter months
Incidence rate ratios (IRRs) – adjusted for season - were (October to March) (IRR winter versus summer: 1.64,
reported with 95% confidence intervals (CIs). Statistical 95% CI: 1.27–2.12).
significance was set a priori at 0.05. For both intervention and comparator streets, the ma-
jority of PMVC involved adults between the age of 16
Results and 59 years (61.5% vs. 64.0%) and minimal and minor
Intervention and comparator streets injuries (86.4% vs. 81.5%). Similarly, the majority of colli-
In 2015 and 2016, posted speed limits were reduced sions occurred at an intersection (81.2% vs. 87.3%), in
from 40 km/h to 30 km/h on a total of 850 roadway seg- areas where a traffic control device was present (55.0%
ments comprising 303.8 km in the City of Toronto. The vs. 75.0%), in clear conditions (83.5% vs. 88%), in day-
majority of roads received the intervention in 2016 light (67.5% vs. 62.0%) and on dry roads (74.9% vs. 80%).
(68%) and between September and November (72%). As shown in Table 2, following implementation of the
A total of 390 roadway segments in the Scarborough intervention, decreases in PMVC rates on speed limit re-
District were included as comparator streets. These duced streets remained apparent in different collision
comparator streets remained at a posted speed limit of sub-groups, with observed PMVC rate reductions by
40 km/h during the entire study period and spanned 29% among adults (IRR: 0.71, 95% CI: 0.55–0.92), and
289.5 km in the City of Toronto. 38% at intersections (IRR: 0.62, 95% CI: 0.48–0.79). Like-
wise, PMVC rates significantly declined (post- versus
Pedestrian-motor vehicle collisions pre-) in clear conditions, in daylight, and on dry roads.
From January 2013 to December 2018, a total of 10,624 Most notably, there was a 67% decline in major and fatal
PMVC were reported in the City of Toronto of which, injury frequency post- versus pre-implementation (IRR:Fridman et al. BMC Public Health (2020) 20:56 Page 5 of 8
Table 1 Frequency and incidence rate ratios of PMVC for intervention and comparator groups
Models Covariate PMVC Total Km-Month PMVC per 100 Km-Month Adjusted IRRa
(95% CI)
Model 1 Intervention Streets Pre-Speed Limit Reduction 245 12,286 1.99 1
Post-Speed Limit Reduction 137 9600 1.43 0.72 (0.58–0.89)
Summer 194 10,970 1.77 1
Winter 188 10,915 1.72 0.98 (0.79–1.21)
Model 2 Comparator Streets Pre-Speed Limit Reduction 151 10,428 1.45 1
Post-Speed Limit Reduction 141 10,437 1.35 0.93 (0.70–1.25)
Summer 111 10,456 1.06 1
Winter 181 10,409 1.74 1.64 (1.27–2.12)
a
based on full model, with pre-post and season covariates
Table 2 PMVC Incidence Rate Ratios (IRR) and 95% Confidence Intervals for Intervention and Comparator Streets, Stratified by
Collision Characteristics
Characteristics Intervention Streets Comparator Streets
(n = 382 PMVC) (n = 292 PMVC)
Total n (%) IRRa (95% CI) Total n (%) IRRa (95% CI)
Ages
Child (0 to 15) 50 (13.1%) 0.72 (0.41–1.29) 43 (14.7%) 0.79 (0.40–1.57)
Adult (16 to 59) 235 (61.5%) 0.71 (0.55–0.92) 187 (64.0%) 0.99 (0.71–1.38)
Older Adult (Over 60) 89 (23.3%) 0.79 (0.51–1.23) 60 (20.5%) 0.87 (0.51–1.49)
Unknown 8 (2.1%) – 2 (0.68%) –
Injury Severity
None 18 (4.7%) 0.51 (0.18–1.45) 10 (3.4%) 0.25 (0.05–1.32)
Minimal and Minor 330 (86.4%) 0.78 (0.62–0.98) 238 (81.5%) 1.03 (0.75–1.42)
Major and Fatal 34 (8.9%) 0.33 (0.13–0.85) 44 (15.1%) 0.69 (0.37–1.31)
Location
Intersection 310 (81.2%) 0.62 (0.48–0.79) 255 (87.3%) 0.92 (0.68–1.24)
Midblock 64 (16.7%) 1.01 (0.64–1.60) 31 (10.6%) 0.72 (0.33–1.59)
Other 8 (2.1%) – 6 (2.1%) –
Traffic Controls
No Control 171 (44.8%) 0.63 (0.45–0.87) 73 (25.0%) 0.87 (0.49–1.54)
Any Traffic Controls 210 (55.0%) 0.78 (0.60–1.03) 219 (75.0%) 0.95 (0.67–1.33)
Unknown 1 (0.2%) –
Visibility
Clear 319 (83.5%) 0.69 (0.54–0.87) 257 (88.0%) 0.98 (0.71–1.34)
Rain, Snow or Other 63 (16.5%) 0.88 (0.54–1.41) 35 (12.0%) 0.66 (0.33–1.36)
Lighting
Daylight 258 (67.5%) 0.69 (0.53–0.90) 181 (62.0%) 0.83 (0.57–1.21)
Dawn, Dusk & Dark 124 (32.5%) 0.77 (0.53–1.12) 111 (38.0%) 1.13 (0.74–1.72)
Road Surface
Dry 286 (74.9%) 0.73 (0.56–0.94) 233 (80.0%) 1.01 (0.72–1.40)
Other 96 (25.1%) 0.68 (0.46–1.00) 59 (20.0%) 0.68 (0.40–1.16)
a
adjusted for season
IRR and 95% CI significant at 0.05 are boldedFridman et al. BMC Public Health (2020) 20:56 Page 6 of 8
0.33, 95% CI: 0.13–0.85), which was statistically signifi- 59 years of age and at intersections on speed limit re-
cant. Among comparator streets, although no significant duced streets. Speed limit reduction also had a strong
changes were observed, the largest decreases in PMVC impact on PMVC injury severity: the percentage of
rates were seen in children (IRR = 0.79, 95% CI: 0.40– major and fatal PMVC injuries decreased significantly by
1.57), no injuries (IRR = 1.03, 95%CI: 0.75–1.42), in mid- 67% in the post-intervention period.
block locations (IRR = 0.72, 95% CI: 0.33–1.59), collisions The intervention to reduce posted speed limits to 30
with no traffic controls (IRR = 0.87, 95% CI:0.49–1.54), km/h in the City of Toronto was implemented on all 40
conditions with unclear visibility (i.e. rain, snow or other) km/h local roads in the Toronto and East York Districts,
(IRR = 0.66, 95% CI: 0.33–1.36), in daylight conditions and was not based on historical PMVC frequency [12].
(IRR = 0.83, 95% CI: 0.57–1.21) and on wet or other road Therefore, “regression-to-the-mean” is an unlikely ex-
surface conditions (IRR = 0.68, 95% CI: 0.40–1.16). planation for the effect noted. The effectiveness of
When estimating a model including the interaction posted speed limit reduction on PMVC risk and PMVC
term for group and pre-post comparisons, the inter- injury severity found in this study is similar to previously
action term was not statistically significant (p = 0.14) in- reported studies [20–23].
dicating that there was no evidence to suggest a pre-post The interaction term between group and pre vs post
difference in IRRs between the intervention and com- comparison was not statistically significant, indicating
parator streets. From that model, the IRR for the post- no statistical evidence for effect measure modification of
pre comparison for the comparator group was 0.93 (95% the pre-post comparison by group. However, the magni-
CI: 0.70–1.25) and for the intervention group it was 0.71 tude of the reduction in the PMVC rate was greater in
(95% CI: 0.57–0.88). the intervention group and the confidence limits did not
include the null value. Interaction tests can be under-
Sensitivity analyses powered and this is what may have influenced our re-
To consider potential bias of other co-related speed in- sults. In any case, the pre-post comparison for the
terventions implemented in the City of Toronto on intervention group is in line with the effect estimates
PMVC rates, sensitivity analyses were performed on from other investigations of reduced speed limits [21].
roadway segments with no identified co-interventions.
For speed limit reduced streets, co-interventions were Crash risk reduction and injury severity
found on 2.4% of segments (n = 21) including school Higher vehicle speeds increase the likelihood of PMVC
safety zone interventions (n = 11), watch your speed and serious injury [24]. Pedestrians struck by a motor
boards (n = 9), senior safety zones (n = 2), and red-light vehicle travelling at 50 km/h are 8 times more likely to
cameras (n = 1). Two street segments were found to have die, compared with pedestrians struck by vehicles travel-
more than one of the identified co-interventions; all ing at 30 km/h [25]. A systematic review on the relation-
other street segments contained only one co- ship between impact speed and the probability of
intervention. After excluding the 21 street segments with pedestrian fatality during a vehicle-pedestrian crash
co-interventions, results of the sensitivity analysis were found that on average, when the estimated impact speed
comparable to the main analysis, with a similar IRR for increases by 1 km/h, the odds of a pedestrian fatality in-
PMVC following speed limit reductions (IRR post- ver- creases by 11% [26]. In the UK, a 20-year time-series
sus pre-: 0.70, 95% CI: 0.56–0.87). study showed that 20 mph (32 km/h) zones were associ-
For comparator streets, co-interventions were located ated with a 42% reduction in road casualties [20]. A
on 4.1% of comparator segments (n = 16) which con- study that examined lowering speed limits from 90 km/h
sisted of school safety zone interventions (n = 10), red- to 70 km/h on highways in Belgium found a 5% decrease
light cameras (n = 3), flex-post signs (n = 2) and watch in crash rates and a 33% decrease in serious injuries and
your speed boards (n = 1). Findings from the sensitivity fatalities when speed limits were reduced [21]. A 2018
analysis which excluded the 16 comparator segments study from Edmonton, Canada found a 45% reduction in
with co-interventions were congruent with the main fatal and severe injury collisions when speed limits were
analysis (IRR post- versus pre-: 0.91, 95% CI: 0.66–1.23). reduced from 50 km/h to 30 km/h in school zones [27].
In addition, injuries to vulnerable road users (pedestrians
Discussion and cyclists) were reduced by over half (55%) [27]. An-
A reduction in the posted speed limit from 40 km/h to other study from New York City reported that road cas-
30 km/h was associated with a 28% decrease in PMVC ualties dropped by 8.74% after implementation of
incidence rates in the City of Toronto between 2013 and neighborhood slow zones (20 mph speed limit areas) in
2018, while there was a non-significant 7% decrease in 2011 [9]. This study also found a cost-savings of $15
PMVC on streets with unchanged 40 km/h speed limits. USD per resident to the healthcare system when slow
This protective effect was significant among adults 16 to zones were in place. Although all of these studiesFridman et al. BMC Public Health (2020) 20:56 Page 7 of 8
reported a decrease in PMVC following speed limit re- For this study the post-intervention period consisted of
ductions, these streets were not compared to other at least 2 years of data; therefore, longer-term effects of
streets where the limits remained unchanged. The find- posted speed limit reductions could not be determined.
ings in this study were consistent with other jurisdic- The short-term effect of a speed reduction may be en-
tions and further add to the literature by demonstrating hanced due to novelty and/or enforcement. Although
a larger significant reduction of PMVC on speed limit speed limit reduction showed an overall effect on all
reduced streets compared to a small non-significant de- PMVC, the study had low statistical power to detect dif-
crease on comparator streets. ferences by specific collision characteristics, e.g., age, in-
jury severity because of small sample sizes within stratified
Strengths groups. Last, the frequency of PMVC differs by road type.
A major strength of this study is the controlled pre-post A report published by the City of Toronto, Transportation
design, which compared PMVC rates on the same streets Services found that only 8% of collisions in the Toronto
where speed limits were decreased from 40 km/h to 30 and East York District occurred on local roads, compared
km/h to the PMVC rates on comparator streets. The large with 63% on major arterials and 24% on minor arterials
magnitude of the effect on treated streets (28%) compared from 2009 to 2013 [13]. Therefore, the findings from this
with the small, not statistically significant decrease in ped- study should be generalized only to local roads with speed
estrian collisions on comparator streets (7%) suggests that reductions from 40 km/h to 30 km/h.
the effect is likely due to the intervention.
Additionally, the pre-post design of this study allowed for Conclusions
comparison of the intervention (40 to 30 km/h speed limit In Toronto, important declines in the rate of PMVC
reductions) while controlling for other features within the were observed on roads with posted speed limit reduc-
built environment. In addition, other speed reduction co- tions from 40 km/h to 30 km/h, although this effect was
interventions such as senior safety zones, flex-post signs, red not statistically greater than reductions on comparator
light cameras, watch your speed boards, and school safety streets. Longer-term outcomes of posted speed limit re-
zone interventions (pavement markings, flashing beacons, ductions in Toronto need to be further studied.
school signage, and zebra crosswalks) were considered in the
analysis and were congruent with the main analysis for both Abbreviations
intervention and comparator streets. CIs: Confidence i`ntervals; IRRs: Incidence rate ratios; PMVC: Pedestrian motor
vehicle collision
Limitations Acknowledgements
The largest limitation of this study is the lack of vehicle We thank the City of Toronto, Transportation Services team for access to
and pedestrian volume (exposure) data. The City of To- their data and Gaetan Dussault and Mathieu Rancourt at the Institut National
de la Recherche Scientifique who helped map the speed limit reduced street
ronto does not regularly collect pedestrian counts (ex- data for analysis.
posure data) or traffic volumes on local streets. Reduced
vehicle speeds may increase pedestrian volume, but Authors' contributions
would be unlikely to decrease pedestrian volume and so LF, BH, and AH were responsible for the conceptualization of the study. LF was
further responsible for the interpretation of the findings and the writing and
the local safety effect is likely conservatively estimated. If editing of the manuscript. RL was responsible for analysis and modeling of the
vehicles are displaced to neighboring roads due to speed data. LR, CM and MSC revised the manuscript prior to submission and provided
reductions, then area wide effects may occur that would critical feedback. All authors read and approved the final manuscript.
be inapparent in our study design.
Funding
Public health officials and other municipal stake-
Liraz Fridman was funded by the Canadian Institutes of Health Research
holders should consider collecting pedestrian and vehicle (CIHR), the Restracomp Fellowship at the Hospital for Sick Children and the
volume data in the future to strengthen our understand- Alberta Children’s Hospital Research Institute/O’Brien Institute for Public
Health. Andrew Howard was funded by the Pediatric Orthopaedic Society of
ing of reductions in PMVC rates.
North America (POSNA) Huene Award.
A second significant limitation is the suitability of the
comparator group of streets. The intervention was not Availability of data and materials
designed as an experiment, and the intervention was ap- The data that support the findings of this study are available from the City of
plied across an entire area of the city which is not identi- Toronto, Transportation Services but restrictions apply to the availability of
these data, which were used under license for the current study, and so are
cal geographically or socially to any other area. While not publicly available. Data are however available from the authors upon
the presence of a group for comparison is a relative reasonable request and with permission of the City of Toronto.
strength of the study, the only way to ensure compar-
ability of intervention and comparator streets is through Ethics approval and consent to participate
Ethical approval of the study was obtained from the Hospital for Sick
prospective experimental design which is rare in traffic Children Research Ethics Board (REB#: 1000059622). Informed consent was
injury research. waived due to the nature of the study.Fridman et al. BMC Public Health (2020) 20:56 Page 8 of 8
Consent for publication 18. Richmond SA, Willan AR, Rothman L, Camden A, Buliung R, Macarthur C,
Not applicable. et al. The impact of pedestrian countdown signals on pedestrian-motor
vehicle collisions: a reanalysis of data from a quasi-experimental study. Inj
Competing interests Prev. 2014;20(3):155–8.
The authors declare that they have no competing interests. 19. Rothman L, Macpherson A, Buliung R, Macarthur C, To T, Larsen K, et al.
Installation of speed humps and pedestrian-motor vehicle collisions in Toronto,
Author details Canada: a quasi-experimental study. BMC Public Health. 2015;15(1):1–7.
1
Departments of Paediatrics and Community Health Sciences, Cumming 20. Grundy C, Steinbach R, Edwards P, Green J, Armstrong B, Wilkinson P. Effect
School of Medicine University of Calgary, Calgary, Alberta, Canada. 2Alberta of 20 mph traffic speed zones on road injuries in London, 1986-2006:
Children’s Hospital Research Institute, Calgary, Alberta, Canada. 3O’Brien controlled interrupted time series analysis. BMJ. 2009;339(7736):31.
Institute for Public Health, Calgary, Alberta, Canada. 4Hospital for Sick 21. De Pauw E, Daniels S, Thierie M, Brijs T. Safety effects of reducing the speed
Children Research Institute, Toronto, Ontario, Canada. 5Hospital for Sick limit from 90 km/h to 70 km/h. Accid Anal Prev. 2014;62:426–31.
Children, Peter Gilgan Centre for Research and Learning, 686 Bay St, Toronto, 22. Heydari S, Miranda-Moreno LF, Liping F. Speed limit reduction in urban
ON M5G0A4, Canada. 6School of Occupational and Public Health, Ryerson areas: a before-after study using Bayesian generalized mixed linear models.
University, Toronto, Ontario, Canada. 7Institut national de la recherche Accid Anal Prev. 2014;73:252–61.
scientifique, Montreal, Quebec, Canada. 8Sport Injury Prevention Research 23. Hu W, Cicchino JB. Lowering the speed limit from 30 mph to 25 mph in
Centre, Faculty of Kinesiology, Calgary, Alberta, Canada. Boston: effects on vehicle speeds. Inj Prev 2019;0:1–4. https://doi.org/10.
1136/injuryprev-2018-043025.
Received: 3 September 2019 Accepted: 30 December 2019 24. Retting R, Ferguson S, McCartt A. A review of evidence-based traffic
engineering measures designed to reduce pedestrian-motor vehicle
crashes. Accid Anal Prev. 2003;93(9):1456–63.
25. World Health Organization (WHO). World report on road traffic injury
References prevention. 2004; Available from: http://www.who.int/violence_injury_
1. World Health Organization (WHO). Global Status Report on Road Safety prevention/publications/road_traffic/world_report/en/
[Internet]. 2018. Available from: https://www.who.int/violence_injury_ 26. Hussain Q, Feng H, Grzebieta R, Brijs T, Olivier J. The relationship between
prevention/road_safety_status/2018/en/ impact speed and the probability of pedestrian fatality during a vehicle-
2. Enright M. Drivers are killing more pedestrians in Canada every year. Here’s pedestrian crash : a systematic review and meta- analysis. Accid Anal Prev.
why: Michael’s essay [Internet]. 2019 [cited 2019 Feb 4]. Available from: 2019;129(June):241–9.
https://www.cbc.ca/radio/thesundayedition/the-sunday-edition-for- 27. Sun D, El-basyouny K, Ibrahim S, Kim AM. Are school zones effective in
february-3-2019-1.4997146/drivers-are-killing-more-pedestrians-in-canada- reducing speeds and improving safety ? Can J Civ Eng. 2018;45:1084–92.
every-year-here-s-why-michael-s-essay-1.4998615
3. OECD. International Transport Forum. Available from: https://www.itf-oecd.
org/sites/default/files/docs/key-transport-statistics-2018.pdf Publisher’s Note
4. City of Toronto. 2017–2021 | Toronto’s Road Safety Plan. 2017; Available Springer Nature remains neutral with regard to jurisdictional claims in
from: https://www.toronto.ca/wp-content/uploads/2017/11/990f-2017- published maps and institutional affiliations.
Vision-Zero-Road-Safety-Plan_June1.pdf
5. Prato CG, Kaplan S, Patrier A, Rasmussen TK. Considering built environment
and spatial correlation in modeling pedestrian injury severity. Traffic Inj Prev.
2018;19(1):88–93.
6. Rosén E, Stigson H, Sander U. Literature review of pedestrian fatality risk as
a function of car impact speed. Accid Anal Prev. 2011;43(1):25–33.
7. Anderson RW, McLean A, Farmer MJ, Lee B, Brooks C. Vehicle travel speeds and the
incidence of fatal pedestrian crashes. Accid Anal Prev. 1997;29(5):667–74.
8. Hussain Q, Feng H, Grzebieta R, Brijs T, Olivier J. The relationship between impact
speed and the probability of pedestrian fatality during a vehicle-pedestrian crash : a
systematic review and meta- analysis. Accid anal Prev [internet]. 2019;129(June):241–
249. Available from: https://doi.org/https://doi.org/10.1016/j.aap.2019.05.033.
9. Jiao B, Kim S, Hagen J. Muennig PA. Cost-effectiveness Neighbourhood
Slow Zones N Y City. 2019:98–103.
10. Martin JL, Wu D. Pedestrian fatality and impact speed squared: Cloglog
modeling from French national data. Traffic Inj Prev [Internet]. 2018;19(1):94–
101 Available from: https://hal.archives-ouvertes.fr/hal-01557978/document.
11. Canadian Council of Motor Transport Administrators (CCMTA).
Countermeasures to improve pedestrian safety in Canada [Internet]. 2013.
Available from: http://ccmta.ca/images/publications/pdf//CCMTA_
Pedestrian_Report_Eng_FINAL.pdf
12. Levinson King R. Speed limits on Toronto streets reduced starting today.
Toronto Star [Internet]. 2015; Available from: https://www.thestar.com/news/
gta/2015/09/14/speed-limits-on-toronto-streets-reduced-starting-today.html
13. Toronto C of. 30 km / h Speed Limit on Local Roads in the Toronto and
East York Community Council Area. 2015;1–22.
14. City of Toronto. Posted Speed Limits [Internet]. Available from: https://github.com/
CityofToronto/vz_challenge/tree/master/transportation/posted_speed_limits
15. City of Toronto. Open Data Catalogue [Internet]. Available from: https://
www.toronto.ca/city-government/data-research-maps/open-data/
16. Richmond SA, Rothman L, Buliung R, Schwartz N, Larsen K, Howard A. Exploring the
impact of a dedicated streetcar right-of-way on pedestrian motor vehicle collisions:
a quasi experimental design. Accid Anal Prev. 2014;71:222–7.
17. Rothman L, Perry D, Buliung R, Macarthur C, To T, Macpherson A, et al. Do
school crossing guards make crossing roads safer? A quasi-experimental
study of pedestrian-motor vehicle collisions in Toronto. Canada BMC Public
Health. 2015;15(1):1–7.You can also read