Automotive Industry Outlook: Staying Ahead of the Curve in a Rapidly Changing Landscape - Butzel Long
←
→
Page content transcription
If your browser does not render page correctly, please read the page content below

Automotive Industry
                       Outlook:
                       Staying Ahead of the Curve in a Rapidly
                       Changing Landscape
                       March 2021

                       Mike Wall
                       Executive Director, Automotive Analysis
                       +1 248 728 8400 Direct
                       +1 616 446 6885 Mobile
                       Mike.Wall@ihsmarkit.com

© 2021 IHS Markit. All Rights Reserved.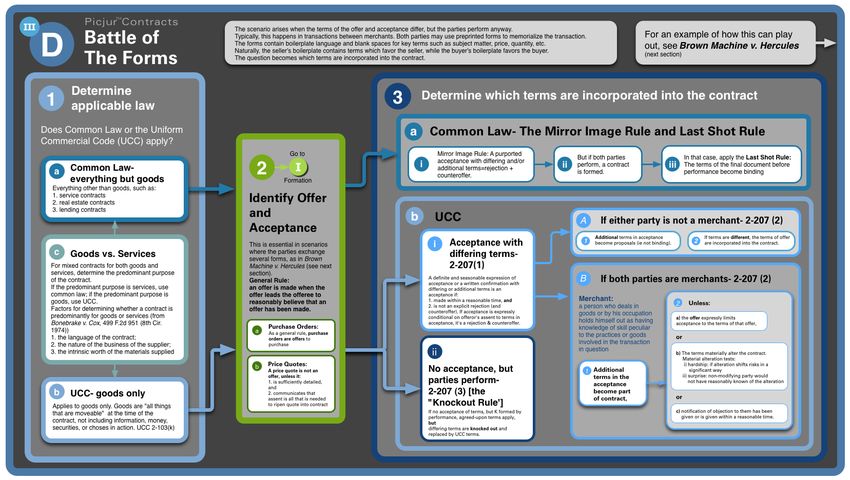
2

A World Leader in Critical Information, Analytics and Solutions
Addressing Strategic Challenges with Interconnected Capabilities
                                                                                             Energy

                                                                                                              Financial
                                                                     Agribusiness
                                                                                                              Services

   50,000+                                80%                 Climate &                                                   Economics &
   customers in over                      of the Fortune   Sustainability                                                 Country Risk
   140 countries                          Global 500

                                                                                                                           Engineering &
                                                            Life Sciences
                                                                                                                           Product Design

   94/100                                 $4B
                                          annual revenue                                                           Telecoms &
   largest US corporates                                           Chemical                                        Technology
                                          NYSE: INFO

                                                                                    Maritime &   Automotive
                                                                                      Trade

© 2021 IHS Markit. All Rights Reserved.
3

World Economic Growth
Global Growth Improved in February; World Real GDP is Projected to Increase 5.1% in 2021

                         10.0                              2018     2019     2020   2021    2022      2023-2028
                                   World Average
                          8.0      2021 = +5.1%
Annual Real GDP Growth

                          6.0
                          4.0
      (in percent)

                          2.0
                          0.0
                         -2.0
                         -4.0
                         -6.0
                         -8.0
                    -10.0
                                     World                 United    Japan   Eurozone   Brazil     Russia    India     China
                                                           States                                                    (mainland)
                         Source: IHS Markit Data Insight

© 2021 IHS Markit. All Rights Reserved.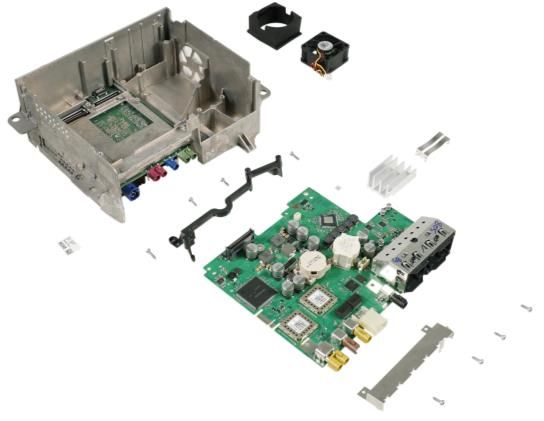
4

  Introduction to Automotive Semiconductor: From Silicon to Cars
                                                                                                                                          Car
Silicon Ingots and                                                                                                                  • 1,000 – 1,400
                                                                            Packaged and       Electronics Control Units*
                                            Processed wafers                                                                          chips / car
Raw silicon wafers                                                           tested chips                (ECU)                      • $427 chip value
                                                                                                                                      / car in 2020

                                            Manufacturing cycle time: Months                              Days                           Hours
                                                       Semiconductor Suppliers
                                               NXP, Infineon, Renesas, Texas Instruments,
   Material suppliers:                       STMicroelectronics, ON Semi, Micron, Samsung...                Tier 1:                      OEMs:
   Shin-Etsu, Siltronics,                                                                       Bosch, Continental, Aptiv, Valeo,   VW, Toyota, Toyota,
          Soitec                                                                                 Harman, BorgWarner, Denso…            GM, RNM…
                                            Foundries (front end):
                                                                         Packaging & Test
                                              TSMC, Samsung,
                                                                           (back-end)
* Picture from IHS Markit Teardown of       GlobalFoundries, UMC,
Harman – Mercedes TTG9 Head-Unit                                         Amkor, ASE, UTAC
                                            Tower, DB Hitek, SMIC
  © 2021 IHS Markit. All Rights Reserved.                  Service providers
5

Global Light Vehicle Sales
COVID-19 Impacts the Near-Term Outlook; Aftermath Resets Expectations Longer-Term
                                                                                                                                                                                         100
                                             100                                                                                                                                                  12.0%
     Annual light vehicle sales (millions)

                                                                                                                                 94 94
                                             95                                                                           92
                                                                                                                                                                                                  8.0%
                                             90                                                                      88                    90

                                                                                                                                                                                                           Annual growth (%)
                                             85                                 Average growth 3.6%                                                    84                                         4.0%

                                             80                                                                                                 77                                                0.0%
                                             75
                                                                                                                                                                                                  -4.0%
                                             70
                                             65                                                                                                                                                   -8.0%
                                             60
                                                                                                                                                                                                  -12.0%
                                             55
                                             50                                                                                                                                                   -16.0%

                                                                                                                                                                       2024
                                                    2002

                                                              2004

                                                                         2006

                                                                                    2008

                                                                                                2010

                                                                                                       2012

                                                                                                              2014

                                                                                                                          2016

                                                                                                                                    2018

                                                                                                                                                2020

                                                                                                                                                            2022

                                                                                                                                                                                 2026

                                                                                                                                                                                           2028
                                             Source: IHS Markit Light Vehicle Sales Forecasts                                                                      MaaS: Mobility as a Service

© 2021 IHS Markit. All Rights Reserved.
6

Global Light Vehicle Production Overview
First Quarter 2021 Outlook Dominated by Semiconductor Shortages; Lost Volume Increases Over Prior
Outlook as Severe Weather Effects and Japanese Earthquake Compound Challenges
                                            Global Production
             100                                                                       25%    ▲   South Asia raised largely on improved Indian outlook;
                    94.2                                               91.7     93.7
  Millions

                                     89.0                     89.6                                possibly reflecting links to Japanese and South Korea
              90                                     84.1                              20%        supply chains – strong local sales are supportive
                                                                                              ▲   MEA is boosted again on stronger Iranian outlook
              80                            74.6                                       15%    ▲   Current disruption does nothing to alleviate upside
                                                                                                  pressure from inventory requirements in H2
              70
                                                     13%                               10%
                                                                                              ▼   March update takes 500,000 units from 2021 outlook as
              60                                                                                  disruption intensifies in Europe, China, Americas and
                                                                                       5%
                                                               7%                                 Japan/Korea
              50                                                                              ▼   Challenges beyond semiconductors, plastics shortages an
                                                                        2%      2%     0%         emerging short-term factor, following bad sever weather
              40
                     -1%                                                                          impacts in North America
                                                                                       -5%    ▼   Many regions experiencing secondary waves of COVID-
              30
                                     -6%                                                          19 infections and disruptive effects could emerge quickly,
              20                                                                       -10%       lockdown measures tightening again in many markets,
                                                                                              ▼   Downside risk remains in the near-term given volatility of
              10                                                                       -15%       the situation and potential for shortages to extend deeper
                                                                                                  into the second quarter. Expect OEMs will continue to
               0                            -16%                                       -20%       prioritize production of higher margin vehicles at the
                    2018            2019    2020     2021     2022     2023     2024              expense of less important offerings

                                 Global Production          Year over Year Change
                                                                                                                                          Source: IHS Markit
© 2021 IHS Markit. All Rights Reserved.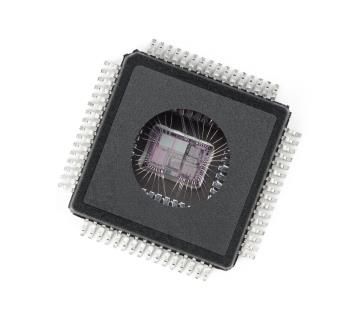
7

 Global Light Vehicle Production
 Semiconductor and Other Supply Chain Pressures Present Near-Term Production Challenges

Global Light Vehicle Production: 1Q 2021 – Mar 2021 vs. Dec 2020                                           •   Globally nearly 1.2M units estimated to be lost
                                                                                                               from 1Q due to semiconductor shortages
                  0                                                                                        •   Biggest disruptions:
    Thousands

                                                                                                               •   Mainland China: 350,000 units
                -100                                                                                           •   Europe: 282,000 units
                                                                                                               •   North America: 264,000 units
                -200
                                                                                                           •   Semiconductor shortages are not the only
                                                                                                               influence on Q1 developments:
                -300
                                                                                                               •   Upside in China from Lunar New Year
                                                                                                               •   North America and Europe compounded by
                -400                                                                                               weather and ongoing public health and lockdown
                                                                                                                   measures
                -500                                                                                           •   Port congestion/disruptions impacting product flow
                                                                                                           •   Extent of disruption and long lead for
                -600                                                                                           semiconductors pointing to more protracted
                        North               Europe      Mainland   Japan      South     South
                                                                                                               vehicle production constraints
                       America                           China               America    Korea
                                                                                                           •   Recovery opportunities dissipating
                                           Net change      Semiconductor impact
                                                                                                           •   Risk in North America for trucks and utility
Source: IHS Markit                                                                     © 2021 IHS Markit
                                                                                                               vehicles amid low inventory levels
 © 2021 IHS Markit. All Rights Reserved.
8

Mainland China Production Overview
Despite Strong Q1, Full-year Outlook is Reduced on Payback Particularly with Light Commercial
Vehicles and Semiconductor Concerns
                                          Yearly Production                                                             Monthly Production Evolution
                                                                          28.23                        3,000       407%                                                      500%
            30                                                                    8.0%

                                                                                           Thousands
                  26.61                                   26.01 26.98
 Millions

                           24.42 23.35 24.66                                      6.0%                 2,500                                                                 400%
            25
                                                           5.5%                   4.0%
                                                   5.6%                   4.7%                         2,000                                                                 300%
            20                                                                    2.0%
                                                                   3.7%
                                                                                  0.0%                 1,500                                                                 200%
            15                                                                                                          58%
                                                                                  -2.0%
                                                                                                       1,000                                                                 100%
            10                                                                    -4.0%                        31%            4%
                  -4.0%                   -4.4%                                   -6.0%                 500                                                                  0%
             5                                                                                                                     -1% -7%-10% - -5% -5% -9%-4%
                                                                                  -8.0%
                                                                                                           0                                                    -100%
             0             -8.2%                                                  -10.0%
                                                                                                              Jan Feb Mar Apr May Jun Jul Aug Sep Oct Nov Dec
                  2018     2019           2020    2021    2022    2023    2024
                                                                                                           YoY Evolution        2020                   2021 Estimates
                  Mainland China Production                   Year over Year Change                        2021 Forecast        2022 Forecast
▲           The economic development has been upgraded again by increasing GDP             ▼            The semiconductor shortage brings risks of plant shutdowns could further
            growth prediction to 7.8% in 2021.                                                          deteriorate in Q2 2021. The impact started to expand from JV brands to
▲           Strong demand in Q1 2021 ahead of Lunar New Year holiday.                                   Chinese domestic brands.
▲           Additional incentives have been released during National Congresses in         ▼            The polyamide (PA66) shortage owing to the snowstorm in US, would be
            March, further motivating the output and sales in following months.                         another interruption in H1 2021.
▲           Commercial vehicle sector responds to infrastructure investment                ▼            Some fluctuations in the stock market could bring uncertainties to
                                                                                                        potential demand.
© 2021 IHS Markit. All Rights Reserved.                                                                                                                        Source: IHS Markit
9
Europe* (excluding CIS) Production Overview
Lockdowns Still Hammering Demand, Semiconductor Shortage Limiting Inventory Rebuild
Yearly Production Monthly Production Evolution
25 14.5% 20.0%
Millions
15.0% 2,000 2022% 2500%
20.08 19.20
Thousands
20 18.23 18.53 18.55 10.0% 2000%
17.00
14.85 5.0% 1,500
15 7.3% 1500%
0.0%
1.7% 0.1% 1,000 26% 1000%
-5.0%
10 -2.5%
-4.3% -10.0% 42% 108% 500%
500 3% -2% 4%
5 -15.0% 0%
-20.0% -18%-18% -2% -1% -6%
-22.7% 0 -500%
0 -25.0% Jan Feb Mar Apr May Jun Jul Aug Sep Oct Nov Dec
2018 2019 2020 2021 2022 2023 2024
YoY Evolution 2020 2021 Estimates
EU (excluding CIS) Year over Year Change 2021 Forecast 2022 Forecast
▲ CY 2022 production revised up, catching-up for 2021 production losses ▼ 1H 2021 production revised down over 140,000 units, with marginal
▲ Inventories remain at very low level as we enter Q2 2021. recovery through 2H 2021.
▲ Government incentives support LEV sales in Western Europe ▼ Semiconductor shortage impacting virtually all operations while
▲ Ongoing demand recovery in Turkey and in key export markets lockdown measures still impact vehicle retail in parts of Europe
▼ Other supply shortages potentially disrupting production (plastics, steel)
▼ CAFE compliance remains an important challenge with risks of OEM
forcing overall volume reductions
Note: *Europe = EU27 + UK, Turkey and Serbia. Not including Commonwealth of Independent States Source: IHS Markit
© 2021 IHS Markit. All Rights Reserved.10
US: Light Vehicle Sales Outlook
Shifting from a COVID Contraction to a Post-COVID Recovery
US Light Vehicle Sales Economic issues
• US consumer outlook to improve, though
20.0 20%
Millions
recovery skewed
18.0 15%
• Risk for additional COVID-19 related
16.0 10% lockdowns diminishing
14.0 5% • Longer term pressure on OEM profitability
12.0
0% • Opportunities to find right customer based
10.0
-5% on vehicle age and scrappage
8.0
-10% • Launches to accelerate, mix increasingly
6.0 attractive
4.0 -15%
• Vehicle development costs rising
2.0 -20% • Regulatory compliance
0.0 -25% • Consumer contenting
2000 2005 2010 2015 2020 2025 • Market attractive from consumer
%∆ Y/Y Base (50%) Optimistic (25%) Pessimistic (25%) perspective, risk shifting to lenders
• Low interest rate environment
Source: IHS Markit © 2021 IHS Markit
© 2021 IHS Markit. All Rights Reserved.11
Semiconductor Shortages
Short-Term Issue with Lasting Implications
North America Light Vehicle Production: 2021 Impact and issues:
1.8 200 • Short lead time notice
2H: +349K
Millions
Thousands
• Who and when remains a question
1.6 150
• Downtime
1.4 100 • Reduced work schedules
50 • Cancelled overtime
1.2
0 • Production rationalization efforts
1.0
-50 • First-half 2021:
0.8 • Semiconductor shortage impact
-100
-400K • End of legacy models
0.6
-150 • Slower ramp-ups
0.4 15.8M
-200 • Annual comparisons masks issue
1H: -754K
0.2 -250 • Second-half 2021:
• Volume recovery beginning to look grim
0.0 -300
bolstering outlook for 2022
Jan Feb Mar Apr May Jun Jul Aug Sep Oct Nov Dec
• Summer shutdowns are a wild card
Y/Y ∆ Mar-21 Dec-20
Source: IHS Markit © 2021 IHS Markit
© 2021 IHS Markit. All Rights Reserved.12
North American Light Vehicle Production
Deep COVID-Related Cut for 2020 but a Quicker Snapback than the Great Recession*
North American Light Vehicle Production Short-term
20.0 ▪ COVID-19 implications
Millions
▪ -3.3M units or -20% in 2020
18.0 ▪ Program delays or timing slippage
17.8
16.0 17.1 17.0
16.3
15.8
16.8 16.6 16.5 16.5 16.5 16.6 16.8
*▪Component shortages, labor availability,
raw material pricing, etc. result in near-
14.0
term downside risk
12.0 13.0
▪ Inventory depletion and restocking
10.0 Long-term
8.0 ▪ Capacity: How to get to 17M units?
6.0 ▪ Expansion and maximization
▪ BEV implications; demand, redundancy, policy
4.0 actions
▪ Growth in regionalization
2.0
▪ Phase two Mexico developments
0.0 ▪ Life-cycle pressures
2016 2018 2020 2022 2024 2026 2028
▪ USMCA and trade implications
Source: IHS Markit © 2021 IHS Markit
© 2021 IHS Markit. All Rights Reserved.13
North America Light Vehicle Production
2021 vs. 2020
2021F 2020F ∆ Units • Production growth as demand
OEM %∆
(000s) (000s) (000s) recovers from COVID-19 impact
GM 2,764 2,388 15.7% 376 and inventories are restocked
Ford 2,562 1.985 29.1% 577
Stellantis
• GM – Hummer EV, Bolt EUV,
2,232 1,808 23.5% 424
BrightDrop EV600
Detroit 3 7,558 6,181 22.3% 1,377
Toyota 1,968 1,600 23.0% 368 • Ford – Bronco and Maverick
Honda 1,582 1,451 9.0% 131
Renault/Nissan 1,238 953 29.9% 285
• Stellantis – Grand Cherokee and
Wagoneer/Grand Wagoneer
Hyundai 878 698 25.8% 180
Asian 4 5,666 4,702 20.5% 964 • Key New Domestic launches
VW 680 551 23.4% 129 include BMW 2-Series, Honda
BMW 476 417 14.1% 59 Civic; Hyundai Tucson; Lordstown
Daimler 352 334 5.4% 18 Endurance; Lucid Air; Nissan
German 3 1,508 1,302 15.8% 206 Frontier & Pathfinder; Rivian R1S
Others 1,030 839 22.8% 191
& R1T; Tesla Cybertruck, Model S
Total 15,762 13,024 21.0% 2,738
& X; Toyota Corolla Cross &
Tundra; Audi Q5 Sportback, etc.
Source: IHS Markit Light Vehicle Production Forecast
© 2021 IHS Markit. All Rights Reserved.14
Production Outlook
North American Light Vehicle Production by Country
20 Mexico Canada US Change 50% 2019 – 2028
18 17.0 40%
16.8 16.8
16.2 16.3 16.5
15.4 15.8
16 30%
3.9 3.8 3.5 3.6 3.9 76,000
2.9 2.9 3.9
Output (millions)
14
Y-O-Y % Change
12.6 13.0 20% CAGR = 0.2%
11.9
12 2.4 2.0 1.9 1.6 1.3 1.5
2.1
2.4 3.0 1.5 10%
2.2
10
2.0 1.4
2.1 0%
8 -449,000
11.6 -10% CAGR = -3.0%
11.1 10.8 11.3 11.4
6 10.9 10.6 8.6
10.1
4 8.5 -20%
7.6
2 -30%
+851,000
0 -40% CAGR = 0.9%
Source: IHS Markit Light Vehicle Production Forecast
© 2021 IHS Markit. All Rights Reserved.15
North American Light Vehicle Production
COVID-19 Impacts Everyone, yet Customer Mix Continues to Shift
North America Light Vehicle Production Divergent trajectories – 2019 to 2028
20.0 ▪ Domestics
Millions
18.0 ▪ -107K units or -2.7%
8.5 ▪ Offshoring to China
16.0 8.4 8.1 8.1 7.9 8.1 8.1 8.2 8.2 8.3
8.0 ▪ Increasing shift to trucks
14.0 7.7
▪ More closely tied to US sales
12.0 6.5 ▪ Build where you sell
10.0 ▪ Transplants
8.0 9.2
8.6 8.6 ▪ +300K units or +3.1%
6.0
8.0 7.6 8.0 7.9 7.7 7.7 7.6 7.8 7.9 ▪ Localization
6.2 ▪ Capacity expansion
4.0
▪ Global sourcing and increasing exports
2.0
▪ Start-ups
0.0
▪ +286K units or +73.6%
2016 2018 2020 2022 2024 2026 2028
▪ Tesla largest component, although
Detroit 3 Start-ups Transplants offshoring is slowing growth
Source: IHS Markit © 2021 IHS Markit ▪ Monitoring other start-ups
© 2021 IHS Markit. All Rights Reserved.16
Start-ups
Risk vs. Reward from A to Z Amid Speculative Investment
North America Production • Arrival
• Bus and van markets
140
• Low volume micro-factories
Thousands
120 • Canoo
• Subscription based business model
100
• MPV, sedan, pickup, van
80 • Lordstown Motors
• Pickup and van with commercial focus
60
• Lucid Motors
40 • Luxury, performance focus
20 • Expansive product plans to 2020
• Rivian
0
2016 2018 2020 2022 2024 2026 2028 • Premium, off-road focus
• Partnerships: Amazon, Ford
Rivian Lucid Canoo Lordstown Arrival Zoox
• Zoox
Source: IHS Markit © 2021 IHS Markit
• Company ecosystem with L5 EV/AV
© 2021 IHS Markit. All Rights Reserved.17
North America Light Vehicle Production Launches by Vehicle Type
Capital Needs Intensify with New Launch Activity; Timing Delays Due to COVID-19
North America Light Vehicle Production Launches Volatility Extends to Launch Timings
▪ Launches in late 2021, 2022 and 2023 can be
45 Watch for delays,
restructuring or cancellation subject to further delay, reprioritization, rescoping
40 of future programs or even cancellation
36
35 34 ▪ If possible, OEMs will review portfolios to extend
31 current vehicles – potentially integrating new
28 29 29
30 minor/moderate facelifts to extend the lifecycles
26 25
25 22 23 23 ▪ Utility vehicle expansion continues
25 ▪ Competition weighs on leaders
20 25 14
20 15 18 ▪ Splintering segmentation with pricing/margin/
14
18 12 volume pressure
15 15 18
3
4 ▪ BEV activity
10 5 4
7 6 3 6 ▪ 55 all-new nameplates
5 1 12 ▪ 13% or 2.2 million units of North American
9 4 2
7 6 5 6 7 5 production by 2028
4 3 3
0 ▪ Product redundancy: ICE to BEV
2018 2019 2020 2021 2022 2023 2024 2025 2026 2027 2028 ▪ Over 100 more BEVs as import or part of
multi-energy nameplates
Car Pickup Utility
Source: IHS Markit © 2021 IHS Markit ▪ Legacy programs as a hedge
© 2021 IHS Markit. All Rights Reserved.18
North American Production
Tail Wagging the Dog, More BEVs than Consumers to Start
Battery Electric Vehicle Production and Model Count BEV Share of Production and Volume per Nameplate
2,500 90 70 14%
Thousands
Thousands
80
60 12%
2,000 70
50 10%
BEV Model Count
60
1,500
50 40 8%
40 30 6%
1,000
30
20 4%
500 20
10 2%
10
7 9 18 32 49 61 70 76 80 81
0 0 0 0%
2019 2021 2023 2025 2027 2019 2021 2023 2025 2027
# of BEV models BEV volume % BEV production in NA Vol. per BEV nameplate
Source: IHS Markit © 2021 IHS Markit Source: IHS Markit © 2021 IHS Markit
© 2021 IHS Markit. All Rights Reserved.19
Powertrain Technology Outlook
Regional Preferences and Incentives Result in a Varied Propulsion Mix; Watch the Model Count!
North America Europe Greater China
3% 3% 9% 4% 7% 18% 5% 3%
3% 8% 19%
4%
8%
35% 32%
9%
CY20 41%
CY25 CY20 11% CY25 14% CY20 CY25 11%
62% 12%
50%
4% 16%
29% 49% 39%
70% 22%
17%
31%
14% 11% 28%
12% 3% 11%
53% CY30 CY30 CY30
12% 36% 16% 36%
6% 14%
• SAFE rule = 1.5% stringency rate increase/yr • Propulsion forecast largely unchanged as little • Extended NEV subsidies/exemptions weaken
vs. ~5%/yr for CAFE; Biden changes coming. relief expected for CO2 compliance. pre-buy in 2020 & boost demand in 2021-22.
• PHEV and HEV production mix reduced post • Target reduction of 15%/37.5% in 2025/2030 • NEV subsidies will come under increasing
2022, improved outlook for BEV. from 2021 level, potential for tougher targets. pressure; China to focus on tightening regs.
© 2021 IHS Markit. All Rights Reserved.20
Thank You!
Mike Wall
Executive Director, Automotive Analysis
mike.wall@ihsmarkit.com
+1 248 728 8400 Direct
+1 616 446 6885 Mobile
IHS Markit Customer Care
CustomerCare@ihsmarkit.com
Americas: +1 800 IHS CARE (+1 800 447 2273)
Europe, Middle East, and Africa: +44 (0) 1344 328 300
Asia and the Pacific Rim: +604 291 3600
Disclaimer
The information contained in this presentation is confidential. Any unauthorized use, disclosure, reproduction, or dissemination, in full or in part, in any media or by any means, without the prior written permission
of IHS Markit Ltd. or any of its affiliates ("IHS Markit") is strictly prohibited. IHS Markit owns all IHS Markit logos and trade names contained in this presentation that are subject to license. Opinions, statements,
estimates, and projections in this presentation (including other media) are solely those of the individual author(s) at the time of writing and do not necessarily reflect the opinions of IHS Markit. Neither IHS Markit
nor the author(s) has any obligation to update this presentation in the event that any content, opinion, statement, estimate, or projection (collectively, "information") changes or subsequently becomes inaccurate.
IHS Markit makes no warranty, expressed or implied, as to the accuracy, completeness, or timeliness of any information in this presentation, and shall not in any way be liable to any recipient for any
inaccuracies or omissions. Without limiting the foregoing, IHS Markit shall have no liability whatsoever to any recipient, whether in contract, in tort (including negligence), under warranty, under statute or
otherwise, in respect of any loss or damage suffered by any recipient as a result of or in connection with any information provided, or any course of action determined, by it or any third party, whether or not based
on any information provided. The inclusion of a link to an external website by IHS Markit should not be understood to be an endorsement of that website or the site's owners (or their products/services). IHS
Markit is not responsible for either the content or output of external websites. Copyright © 2018, IHS MarkitTM. All rights reserved and all intellectual property rights are retained by IHS Markit.
© 2021 IHS Markit. All Rights Reserved.Seeing through the Fog of the
Battle of the Forms
Sheldon Klein | Butzel Long | klein@butzel.comThe Battle of the Forms
[a/k/a, I Agreed to What???]
© Butzel Long 2021Goals for the Presentation
• Understand the basics of contract formation.
• Understand what is the “Battle of the Forms”.
• Learn the basics of how to engage in the “Battle of the
Forms”
• Understand the contract terms that are not in either side’s
form
© Butzel Long 2021Contract Formation
Law School, Contracts, Day 1: “Mirror Image Rule”
•“Offer” → “I Accept Your Offer.” → CONTRACT
•If Acceptance ≠ Offer, no Contract (Counter-offer).
Real World
•Form language exchanged without ever resolving, or even
paying attention to, the differences
•Ignores reality to say “no contract” when parties are doing
business and think there is a contract.
“Battle of the Forms”
Legal rules for (trying to) sorting out the mess
© Butzel Long 2021Do I have a Contract?
§ 2-204. Formation in General.
• (1) A contract for sale of goods may be made in any manner
sufficient to show agreement, including conduct by both parties
which recognizes the existence of such a contract.
• (2) An agreement sufficient to constitute a contract for sale may be
found even though the moment of its making is undetermined.
• (3) Even though one or more terms are left open a contract for
sale does not fail for indefiniteness if the parties have intended to
make a contract and there is a reasonably certain basis for giving an
appropriate remedy.
© Butzel Long 2020Rule 1: Lawyers are Good.
An Actual Agreement is Better.
“There is no language that a lawyer can put on
a form that will always assure his client of
forming a contract on his client's own terms. . . .
If one must have a term, that party should
bargain with the other party for that term; a
client should not get it by his lawyer's sleight of
hand. If a seller must have the term to reduce
liability but cannot strike a bargain for it, his
only answer may be to raise his price, buy
insurance, or—as a last resort—have an extra
martini every evening and do not capitalize
the corporation too heavily.”
© Butzel Long 2021In a Nutshell
“Everything in war is
very simple. But the
simplest thing is
difficult.”
Carl von Clausewitz
© Butzel Long 2021Goods or Services?
• Battle of the Form rules are different for Goods and Services.
• Goods if you are buying raw parts and then selling the finished parts
• Services if you are paid a fee for finishing your customer’s parts
• If mix, “predominant purpose” of the transaction.
© Butzel Long 2021Offer or Acceptance?
• Fundamental to contract formation and battle of the forms analysis, but application is slippery
• “An offer is the manifestation of willingness to enter into a bargain, so made as to justify
another person in understanding that his assent to that bargain is invited and will conclude it.”
[R2k 24]
• “Acceptance of an offer is a manifestation of assent to the terms thereof made by the offeree
in a manner invited or required by the offer.” [R2k 50]
• Is an RFP or ITB an offer or nothing?
Is Bid or Proposal an offer, an acceptance, a counter-offer or nothing?
Is PO issued after Bid or Proposal an offer, an acceptance, a counter-offer or nothing?
© Butzel Long 2021If You Sell Services
© Butzel Long 2021If You Sell Goods
© Butzel Long 2021Seller’s Quotation Best Practices
• Designate it as an “offer.”
• Have Terms and Conditions of Sale
• Incorporate them in your Offer, your Acceptances and your Invoices.
• Always use clear and precise language.
• Do not refer to a RFQ or other external documents in general but only to the
necessary specific provisions (e.g., Buyer’s technical specifications).
• Object to any additional or different terms in prior or subsequent documents.
• Get in the last word.
© Butzel Long 2021Sample Quotation
Possible Language for Quotation forms
This is an offer. This quotation and any resulting contract are subject
to the Seller’s General Terms and Conditions of Sale placed on the
reverse side, elsewhere in this quotation or Seller’s website, and
available by written request. Notice is hereby given of objection to
any additional or different terms in any acceptance or other
response.
© Butzel Long 2021What Documents Count?
• Some of the documents that could constitute the “Theatre of the Battle” are:
• RFQs and Quotations
• Sourcing Letter
• Purchase Order
• Buyer’s and Seller’s Standard Terms and Conditions
• Documents incorporated in the contract by reference
(e.g., drawings, specifications, standards, and quality manuals.)
• Invoice
• Correspondence and E-mails
© Butzel Long 2021Beyond the Four Corners
• The law can supply “gap fillers” for missing terms (especially for Goods):
• Price (reasonable);
• Number of Deliveries (one delivery);
• Place of Delivery (Seller’s place of business);
• Time of Delivery (reasonable);
• Length of Contract (reasonable);
• Time of Payment (due at the time and place of the Buyer’s receipt of the goods); and
• Risk of Loss (passes on the Buyer’s receipt of the goods).
• Warranties (implied good title, non-infringement, marketability, and possibly fitness for
particular purpose).
© Butzel Long 2021Other Sources of Contract Terms
• The course of dealing between the parties in other contracts.
• The course of performance by the parties in the same contract.
• Industry Standards (“Usage of Trade”).
• Documents referenced in the contract (e.g., quality manuals).
• So where do we look for contract terms:
• Mutually agreed.
• GAP fillers.
• Four sources above.
• Winners in the Battle of the Forms.
© Butzel Long 2021Take Aways
• The Battle of the Forms is a last • You cannot control the terms if you
resort. Whenever possible, don’t have them. Have and use
negotiate a written agreement that well-written Terms of Sale
includes your “must haves.”
• Do not blame the law. You
• However, this is not always possible. volunteer for battle by beginning
Therefore, it is important for you, performance without a clear,
and your people in the trenches, to acceptable agreement.
understand the “rules of
engagement.” “The events which can not be
• Well written agreements are a cost-
prevented, must be directed.”
effective risk management tool.
Klemens von Metternich
© Butzel Long 2021Beth Gotthelf Sheldon Klein Mike Wall
Butzel Long Butzel Long IHS Markit
248.258.1303 248.258.1414 248.728.8400
gotthelf@butzel.com klein@butzel.com mike.wall@ihsmarkit.com
QUESTIONS?
© Butzel Long 2020DISCLAIMER
These materials and presentations are intended and
designed for informational purposes only – they do not
provide legal advice and no attorney-client
relationship is created. No liability is assumed in
connection with the use of these materials. Legal
counsel should be consulted regarding how
applicable law impacts specific situations.
© Butzel Long 2021You can also read