Orca Exploration Group Inc - Drive to value creation and liquidity for shareholders - Orca ...
←
→
Page content transcription
If your browser does not render page correctly, please read the page content below
Orca Exploration Group Inc
Drive to value creation and liquidity for
shareholders
Disclaimer

     The information in this presentation (the "Presentation") is provided as of 17 June, 2019 for informational purposes only, is not complete, is based (in part) on
     information prepared for internal evaluation purposes only and does not contain all material information about Orca Exploration Group Inc. ("Orca" or the
     "Company"), including important disclosures and risk factors associated with the Company's business. This Presentation does not take into account the
     particular investment objectives or financial circumstances of any specific person who may receive it and does not constitute an offer to sell or a solicitation of
     an offer to buy any security in Canada, the United States or any other jurisdiction. The contents of this Presentation have not been approved or disapproved
     by any securities commission or regulatory authority in Canada, the United Sates or any other jurisdiction, and Orca expressly disclaims any obligation to
     make disclosure or any filings with any securities commission or regulatory authority, beyond that imposed by applicable laws. See "Advisories" beginning on
     slide 18 and other important disclosures regarding forward-looking information, financial outlook and other financial matters, oil and gas information, non-
     GAAP measures and other important information.

     Certain other information contained in this Presentation has been prepared by third-party sources, which information has not been independently audited or
     verified by Orca. No representation or warranty, express or implied, is made by Orca as to the accuracy or completeness of the information contained in this
     Presentation, and nothing contained in this Presentation is, or shall be relied upon as, a promise or representation by Orca.

Orca Exploration Group                                                          June 2019                                                                           Slide 2
                                                                                 AN 2019
Orca overview

         • Significant management experience developing and operating an integrated gas project.
           Continuous reliable gas production in Tanzania since 2004

         • 2019 gas production guidance of 60 – 75 MMscfd (10.0 – 12.5 Mboepd)

         • Strong balance sheet with cash and investments in bonds of US$141 million (net cash US$83
           million)1

         • Dividend of CDN$0.05/share paid in April 2019 for A and B shares on record at 31 March
           2019. Dividend of CDN$0.06/share to be paid in July 2019 for A and B shares on record at 30
           June 2019. Moving forward the Board expects to evaluate the appropriateness of declaring
           and paying cash dividends on a quarterly basis. NCIB initiated on June 14, 2019

         • Gross 2P conventional natural gas reserves of 293 Bcf (49 MMboe) as at 31 December 2018

         • Continuation of strategy to maximise the value of the Tanzanian asset, diversify risk and
           increase liquidity for shareholders.

1.     The financial information is as at 31 March 2019. Net cash is a non-GAAP measure that does not have any standardized meaning under IFRS and therefore may not be
       comparable to similar measures presented by other entities. Please see "Non-GAAP Measures" in this Presentation
     Orca Exploration Group                                                        June 2019                                                                         Slide 3
                                                                                    AN 2019
Orca snapshot
                          Listed on the TSXV as ORC.A and ORC.B.
 Market                     • 35.3 million shares issued (1.8 million Class A common shares and 33.5 million Class B subordinated shares)
                            • Market capitalization on 15 June 2019 based on CDN$6.30 per share: US$167 million
 status                     • Shaymar Limited holds 20.7% of the equity and controls 59.2% of the total votes of the Company. David Ross is the
                              protector of the trust and an Orca Board director

                           Operator of the Songo Songo integrated gas project in Tanzania since 2004
                            • Under the terms of the Production Sharing Agreement (“PSA”), Orca is entitled to produce and sell all Additional Gas
                              (“AG”). AG is the gas in the field that is in excess of Protected Gas (“PG”). PG is a maximum of 45 MMscfd and Orca is
Operations                    obligated to make it available for the Songas power plant and a cement facility in Dar es Salaam through to July 2024
                            • January to May 2019 AG sales averaged 60 MMscfd (40 MMscfd for the year ended 31 December 2018). New Gas
                              Sales Agreement signed May 2019 through to October 2026 with the Tananzian Production and Development
                              Company (“TPDC”) utilizing National Natural Gas Infrastructure (“NNGI”)
                            • PSA licence expires in October 2026 with possibility to extend

                          Key financial parameters for the three months ended 31 March 2019 (US$ million)
  Current
                               Net cash flows from operating activities                13
 financial                     Net income                                               3

                          2P conventional natural gas reserves as at 31 December 2018 (Bcf)
Reserves                       Gross 2P conventional natural gas reserves:            293

 Orca Exploration Group                                                   June 2019                                                            Slide 4
                                                                           AN 2019
Tanzania in a nutshell
                 Management assesses that there is significant spare production and infrastructure capacity to process and transport
                                              gas from Songo Songo Island (“SSI”) to Dar es Salaam
               350

               300

               250

               200
MMscfd

               150

               100

                 50

                  0
                         Deliverability from 7 producing   Gas processing      Pipeline capacity - SSI                                                                               Current gas markets in Dar es
                           wells (after refrigeration) 1   capacity on SSI        to Dar es Salaam                                                                                        Salaam for SSI gas
                      SS-4     SS-7       SS-9    SS-5   National Natural Gas Infrastructure ("NNGI")                                                                              PG - Power                       PG - Industrial
                      SS-10           SS-11            SS-12                           Songas Facilities                                                                           AG - Power                       AG - Industrial

         1.    Compression and potentially the drilling of SS North will be required to sustain this level of deliverability through to 2026. Before refrigeration is installed, production is capped at circa 130 MMscfd

              Orca Exploration Group                                                                                 June 2019                                                                                              Slide 5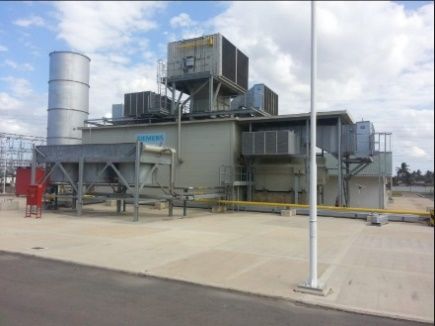
Strategy - Maximising the value of the Tanzanian asset
Increasing gas sales

•     At the end of 2018 there was a step change in natural gas demand from the Songo Songo field fuelled by increased industrial
      consumption, the introduction of new generation capacity and the requirement to stabilise the overall infrastructure system

•     With the significant spare production and infrastructure capacity, Orca is well placed to capture new markets as they
      materialise. 180 MWs of new gas fired generation capacity is expected to be commissioned by TANESCO in stages over the
      next 9-18 months.

Licence extension

•     Licence expires in October 2026. There is scope within existing Tanzanian petroleum laws for this to be extended

•     Licence extension may enable the drilling of Songo Songo North (appraisal) and potentially Songo Songo West (exploration) to
      extend plateau production to meet increasing gas demand in country

Recovery of receivables

•     Working capital including cash of US$90 million1 as at 31 March 2019 excludes a US$59 million gas receivable and US$31
      million of related late payment interest from the electricity utility, TANESCO. These have been fully provided for in Orca’s
      financial statements

•     The gas receivable element peaked at US$74 million in 2016; since then TANESCO has repaid US$15 million of this amount.

     1.   Working capital including cash is a non-GAAP measure that does not have any standardized meaning under IFRS and therefore may not be comparable to similar measures presented by other entities. Please
          see "Non-GAAP Measures" in this Presentation

    Orca Exploration Group                                                                           June 2019                                                                                            Slide 6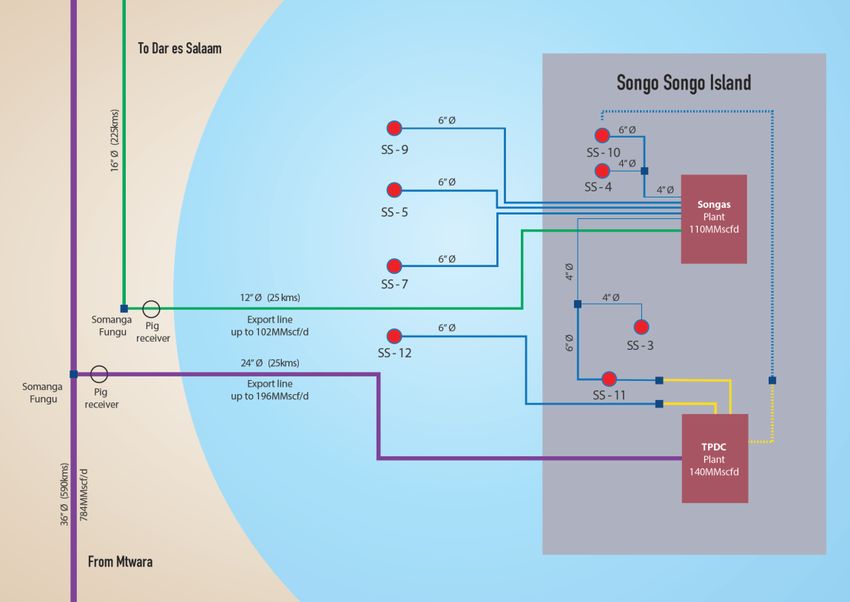
Strategy - Increasing liquidity for shareholders
• Dividend of C$0.05/share was paid in April for A and B shares on record at 31 March 2019. Dividend of C$0.06/share to
be paid in July 2019 for A and B shares on record at 30 June 2019. Moving forward the Board expects to evaluate the
appropriateness of declaring and paying cash dividends on a quarterly basis
• In May 2019 the Board was enhanced through the appointment of two additional non executive directors
• Improved interaction between Orca and the investment community through regular communication
• There will be a focus on improving ‘Adjusted funds flow from operations per share’ 1 and net income per share through
cost control, organic growth and accretive M&A activity
US$000s Quarterly adjusted funds flow from operations US$/share
Quarterly Net Income US$/share
US$000s
$8,000 $0.20 $0.40
0.18 0.17 $13,000
$0.15 0.35
$6,000
0.13 0.12 0.12 0.13 $11,000 $0.30
$0.10
$4,000
$9,000
$0.05
$2,000 $0.20
$7,000
0.01 $0.00
$0 $5,000
Dec-16 Mar-17 Jun-17 Sep-17 Dec-17 Mar-18 Jun-18 Sep-18 -$0.05 $0.10
0.08 0.07
-$2,000 $3,000
-$0.10 0.03
$1,000 0 $0.00
-$4,000 -0.02
-$0.15
-$1,000 Dec-16 Mar-17 Jun-17 Sep-17 Dec-17 Mar-18 Jun-18 Sep-18
-$6,000 -0.2 -$0.20 -$0.10
-$3,000 -0.13 -0.13
-$8,000 -$0.25
Adjusted Funds flow from operations -$5,000 -$0.20
Adjusted Funds flow from operations per share Net income (loss) Earnings (loss) per share
1. Adjusted funds flow from operations is a non-GAAP measure that does not have any standardized meaning under IFRS and therefore may not be comparable to similar
measures presented by other entities. Please see "Non-GAAP Measures" in this Presentation
Orca Exploration Group June 2019 Slide 7
Strategy - Diversification to reduce risk
•      The Company is reliant on the cash flows from its only asset, the Songo Songo field in Tanzania

•      There is scope for Orca to reduce this asset concentration through mergers, acquisitions and divestitures

•      In the current market environment where traditional sources of capital for upstream companies are
       limited, Orca is well positioned to capitalise on opportunities available in the market

•      M&A activity may enable Orca to realise significant cost synergies by reducing corporate overheads per
       unit of production

    Orca Exploration Group                              June 2019                                            Slide 8
Songo Songo Additional Gas Reserves
Conventional Natural Gas Reserves and NPV10 for
Songo Songo Gas Field
As at December 31, 2018 1P 2P 3P1
Conventional natural gas (Bcf) 261 293 316
NPV10 reserves (US$m) 252 294 322
Note: Current licence expires in October 2026. There are provisions in current Tanzanian
Petroleum law for licence extensions; an extension may significantly increase the value
of the Songo Songo project
• No new wells are forecast to be required to extract and sell the 1P reserves. The forecast capex primarily
consists of:
• Refrigeration on the inlet to the Songas Facilities
• Compression
• Workovers of the onshore wells, SS-3, SS-4 and SS-10
• Orca forecasts that a horizontal well will be required to extract the 2P reserves
1. Possible reserves are those additional reserves that are less certain to be recovered than probable reserves. There is a 10% probability that the quantities actually
recovered will equal or exceed the sum of proved plus probable plus possible reserves
Orca Exploration Group June 2019 Slide 9Songo Songo field location, infrastructure and gas producers
• The Songo Songo gas field was initially
discovered in 1974; 12 wells have been drilled
on the licence (currently 7 are on production)
• In 2004 first gas flowed from the field to Dar
es Salaam through the Songas Facilities. After
debottlenecking, these consist of a:
• 110 MMscfd gas processing facility on SSI
• 12” 25 kms offshore pipeline
• 16” 225 kms onshore pipeline
• In 2016, the NNGI facilities were completed.
These consist of:
• Two gas processing plants:
• 140 MMscfd facility on SSI with
integrated compression and
refrigeration; and
• 210 MMscfd facility at Mtwara
• A 36” 590 kms pipeline running from the 210
MMscfd facility at Mtwara to Dar es Salaam
• A 24” offshore pipeline connecting the SSI gas
processing facility to their onshore pipeline
• Other operators of gas producing fields in country are Aminex at Kiliwani North on Songo Songo Island (not currently producing)
and Maurel & Prom who are currently producing 80-90 MMscfd from 5 wells at the Mnazi Bay field in Mtwara
Orca Exploration Group June 2019 Slide 10Gas processing facilities on Songo Songo Island
• Two gas processing facilities on SSI:
• Songas Facilities (110 MMscfd)
• NNGI (140 MMscfd)
• Orca operates the Songas Facilities on a ‘no gain
no loss basis’
• The Orca team on SSI also manages the wells
and flow lines to the Songas Facilities
• Inlet pressure for the Songas Facilities is 87 bar
(dictated by the need to supply gas at no less
than 50 bar for power in Dar es Salaam)
• The NNGI has inbuilt compression and refrigeration
• Currently the NNGI capacity is available for the processing
and transportation of Orca’s natural gas
Orca Exploration Group June 2019 Slide 11Orca’s Historical Additional Gas Sales (MMcfd)
70
60
12
50 10
13
8
11
40 13
13
7 13
30
6
49
4 46
20 4 40 41
36
30 32
29 27
4 23
10 17
20
2
9
5
0 1
2004 2005 2006 2007 2008 2009 2010 2011 2012 2013 2014 2015 2016 2017 2018
Power Industrial
• Steady growth in domestic and industrial power demand from 2004 to 2013
• Decrease in power sales since 2014 has been a result of increase in hydro-power generation as well as
competition from new gas suppliers in the Tanzanian market
• Additional Gas sales increased to 60 MMscfd in January to May 2019
Orca Exploration Group June 2019 Slide 12
Orca Exploration GroupTanzania power generation growth and capacity
Average electricity demand has been growing in Tanzania at circa 8% per annum since 20041
1000.00
900.00
800.00
700.00
600.00
MWh
500.00
400.00
300.00
200.00
100.00
0.00
Jan-14 Apr-14 Jul-14 Oct-14 Jan-15 Apr-15 Jul-15 Oct-15 Jan-16 Apr-16 Jul-16 Oct-16 Jan-17 Apr-17 Jul-17 Oct-17 Jan-18 Apr-18 Jul-18 Oct-18 Jan-19
HYDRO Gas Fired Liquid Fuel Total Generation
Tanzanian gas fired generation capacity
MW MMscf/d Location
Songas 180 36.0 Dar es Salaam
Ubungo 1 (Wartsilla) 100 20.0 Dar es Salaam
Ubungo 2 (Jacobsen) 129 25.8 Dar es Salaam
Tegeta 45 45 9.0 Dar es Salaam
Kinyerezi 1 150 30.0 Dar es Salaam
Kinyerezi 2 240 36.0 Dar es Salaam
Mtwara 22 4.4 Mtwara
Somanga 8 1.5 Somanga Funga
874 163
1. Sourced from TANESCO generation reports
Orca Exploration Group June 2019 Slide 13
Orca Exploration GroupBuilding an industrial market
Orca has constructed over 50 kms of low pressure distribution pipeline in Dar es Salaam and connected 39
customers
Orca Exploration Group June 2019 Slide 14
Orca Exploration GroupForecast Tanzanian gas demand (2019 – 2022)
MMscfd
2019 2020 2021 2022
Industrial Cement Power Current gross supply (from SSI and Mnazi Bay)
• The above forecast has been prepared by Orca management. The forecast takes into account power and industrial
projects that are currently under construction and assumes average utilisation rates
• Once refrigeration and first stage compression is installed, Orca is well placed to provide the majority of the incremental
gas volumes through to 2022
Orca Exploration Group June 2019 Slide 15
Orca Exploration GroupCurrent corporate structure for Tanzanian asset
US$4 million
preference share Swala Oil and Gas
Orca Exploration
Group Inc Tanzania Plc
92.07% 7.93%
US$30 million
guarantee
Pan African Energy
Mauritius Limited
International Finance
Corp 100%
Pan African Energy
Tanzania Ltd
US$60 million IFC Loan 1
Interest and repayment:
• 10% coupon plus a 6.4% ‘participating interest’
• US$5 million semi annual payments starting April 2022; One US$30 million payment in April 2025
Annual participating interest until October 2026 = net cash flow from operating activities less net cash flow used in investing activities times 6.4%
1 The IFC Loan Agreement, and amendments thereto, are available on Orca’s SEDAR profile
Orca Exploration Group June 2019 Slide 16
Orca Exploration GroupFinancial and production highlights
US$ 000 except where otherwise stated Q1 2019 2018 2017 2016
Revenue 19,936 57,766 60,832 65,885
Funds flow from operations 9,037 19,255 16,742 31,855
Net cash flows from operating activities 13,206 28,752 48,154 19,968
Net income (loss) attributable to shareholders 2,784 13,270 -2,500 2,164
per share – basic and diluted $0.08 $0.38 -$0.07 $0.06
Cash and cash equivalents 141,491 131,497 122,322 80,895
Working capital 90,325 84,182 69,575 71,989
Capital expenditure 1,092 5,843 1,545 16,924
Long- term debt (incl. current portion) 58,703 58,660 58,518 58,399
Power gas delivered MMscfd 49.7 26.9 29.0 32.0
Weighted average power gas price US$/mscf $3.43 $3.68 $3.60 $3.56
Industrial gas delivered MMscfd 11.6 13.0 12.6 12.5
Weighted average industrial gas price US$/mscf $7.97 $8.26 $7.71 $7.70
Operating netback on total deliveries US$/mscf $2.48 $2.76 $3.00 $3.26
1. Adjusted funds flow from operations, weighted average power gas price, weighted average industrial gas price, and operating netback on total deliveries are non-GAAP
measures that do not have any standardized meaning under IFRS and therefore may not be comparable to similar measures presented by other entities. Please see "Non-
GAAP Measures" in this Presentation
Orca Exploration Group June 2019 Slide 17Advisories Certain information regarding Orca set forth in this presentation contains forward-looking statements that involve substantial known and unknown risks and uncertainties. The use of any of the words "plan", "expect", “prospective”, "project", "intend", "believe", "should", "anticipate", "estimate" or other similar words, or statements that certain events or conditions "may" or "will" occur are intended to identify forward-looking statements. Such statements represent Orca's internal projections, estimates or beliefs concerning, among other things, future growth, results of operations, revenue and customer growth, future capital and other expenditures (including the amount, nature and sources of funding thereof), business prospects and opportunities, and the ability of Orca to drill additional wells and/or negotiate license extensions with the Tanzanian government. These statements are only predictions and actual events or results may differ materially. Although management believes that the expectations reflected in the forward-looking statements are reasonable, it cannot guarantee future results, levels of activity, performance or achievement since such expectations are inherently subject to significant business, economic, competitive, political and social uncertainties and contingencies. Many factors could cause Orca's actual results to differ materially from those expressed or implied in any forward-looking statements made by, or on behalf of, Orca. More particularly, this presentation may contain, without limitation, statements pertaining to the following: the Company’s expectations regarding supply and demand of natural gas; anticipated power sector revenues; the Company’s estimated spending for, and results of, the planned Development Program for 2019 and 2020, which includes planned workovers and completing the installation of a refrigeration unit to maintain production through the Songas gas processing facility and the National Natural Gas Infrastructure (“NNGI”); the current and potential production capacity of the Songo Songo field; expectations regarding amounts and frequency of future dividends; the Company's ability to access new markets; the Company's ability to produce additional volumes; the Company's ability to access additional processing and transportation capacity; the Company's ability to locate and bring online additional supply in the future; the Company’s expectation that it can expand and maintain the deliverability of gas volumes in excess of the existing Songas infrastructure; forecast costs (including operating costs) and netbacks; budgeted capital expenditures; the Company's 2019 production guidance; the Company's expectation that a license extension may enable the drilling of Songo Songo North (appraisal) and potentially Songo Songo West (exploration); the Company's expectations regarding increased gas fired generation capacity commissioned by Tanzanian Electric Supply Company Limited (“TANESCO”); the Company's expectations regarding acquisitions and additional international operations; and other forward-looking statements. In addition, statements relating to “reserves” are by their nature forward-looking statements, as they involve the implied assessment, based on certain estimates and assumptions that the reserves described can be profitably produced in the future. The recovery and reserve estimates of the Company’s reserves provided herein are estimates only and there is no guarantee that the estimated reserves will be recovered. As a consequence, actual results may differ materially from those anticipated in the forward- looking statements. Although management believes that the expectations reflected in the forward-looking statements are reasonable, it cannot guarantee future results, levels of activity, access to resources and infrastructure, performance or achievement since such expectations are inherently subject to significant business, economic, operational, competitive, political and social uncertainties and contingencies. These forward-looking statements involve substantial known and unknown risks and uncertainties, certain of which are beyond the Company’s control, and many factors could cause the Company’s actual results to differ materially from those expressed or implied in any forward-looking statements made by the Company, including, but not limited to: failure to receive payments from TANESCO; risk that the planned financing solutions to resolve the TANESCO arrears are not implemented by the Tanzanian government; risk that additional gas volumes available to the NNGI from third parties will replace all or a portion of the volumes currently nominated by TANESCO under the Portfolio Gas Sales Agreement (“PGSA”) until additional gas-fired power generation is brought on-stream to consume all of the Company’s available gas production; risk that the Development Program is not completed as planned and the actual cost to complete the Development Program exceeds the Company’s estimates; risk that the remaining well workovers under the Development Program are unsuccessful or determined to be unfeasible; risk of a lack of access to Songas processing and transportation; risk that Orca may be unable to complete additional field development to support the Songo Songo production profile through the life of the field; risk that Orca may be unable to develop additional supply or increase production values; risks associated with Orca and PAET's ability to complete sales of Additional Gas; potential negative effect on the Company’s rights under the PSA and other agreements relating to its business in Tanzania as a result of the recently approved Petroleum Act, 2015 (“Act”) and recently enacted legislation, as well as the risk that such legislation will create additional costs and time connected with the Company’s business in Tanzania; risks regarding the uncertainty around evolution of Tanzanian legislation; risk that, without extending or replacing the Re-Rating Agreement (an unsigned agreement with TANESCO, TPDC and Songas which evidenced an increase to the gas processing capacity of the Songas facilities from 70 MMcfd to a maximum of 110 MMcfd), the gas being processed through the Songas gas processing plant may be reduced back to its original capacity, resulting in a material reduction in the Company’s sales volumes of Additional Gas; risk that the Company will not fully recover Songas’ share of capital expenditures associated with the workovers of wells SS-5 and SS-9; risk that the Company will not be successful in appealing claims made by the Tanzanian Revenue Authority (“TRA”) and may be required to pay additional taxes and penalties; the impact of general economic conditions in the areas in which the Company operates; civil unrest; industry conditions; changes in laws and regulations including the adoption of new environmental laws and regulations, impact of new local content regulations and changes in how they are interpreted and enforced; increased competition; the lack of availability of qualified personnel or management; fluctuations in commodity prices, foreign exchange or interest rates; stock market volatility; competition for, among other things, capital, drilling equipment and skilled personnel; failure to obtain required equipment for drilling; delays in drilling plans; failure to obtain expected results from drilling of wells; effect of changes to the PSA on the Company; changes in laws; imprecision in reserve estimates; the production and growth potential of the Company’s assets; obtaining required approvals of regulatory authorities; risks associated with negotiating with foreign governments; inability to satisfy debt obligations and conditions; failure to successfully negotiate agreements; and risk that the Company will not be able to fulfil its contractual obligations. In addition, there are risks and uncertainties associated with oil and gas operations, therefore the Company’s actual results, performance or achievement could differ materially from those expressed in, or implied by, these forward-looking statements and, accordingly, no assurances can be given that any of the events anticipated by these forward-looking statements will transpire or occur, or if any of them do so, what benefits the Company will derive therefrom. Readers are cautioned that the foregoing list of factors is not exhaustive. Orca Exploration Group June 2019 Slide 18
Advisories
Such forward-looking statements are based on certain assumptions made by the Company in light of its experience and perception of historical trends, current conditions and expected future developments, as well as other factors the Company
believes are appropriate in the circumstances, including, but not limited to, the potential impact of the Act and the Finance Act, 2016 on the Company’s business in Tanzania; the potential impact of the Natural Wealth and Resources (Permanent
Sovereignty) Act, 2017, the Natural Wealth and Resources Contracts (Review and Re-Negotiation of Unconscionable Terms) Act, 2017 and The Written Laws (Miscellaneous Amendments) Act, 2017; the Company’s belief that the parties to the
unsigned Amended and Restated Gas Agreement (“ARGA”) will continue to conduct themselves in accordance with the ARGA until a new Gas Sales and Purchase Agreement (“GSPA”) is signed; the Company’s expectation that, despite the Re-
Rating Agreement of the gas processing plant owned by Songas Limited (“Songas”) having expired, the Songas gas processing plant will not be de-rated or production through the plant restricted; the anticipated effect of the Second Additional
Gas Plan (“AGP2”) on the Company's available volumes of Additional Gas for sale; additional Songo Songo field developments contemplated in connection with AGP2; that the Company will be able to negotiate Additional Gas sales contracts in
relation to the approval of AGP2; the ability of the Company to complete additional developments and increase its production capacity; that the Company and TPDC will agree to the terms of a Gas Sales Agreement; the actual costs to complete
the Development Program are in line with estimates; that there will continue to be no restrictions on the movement of cash from Mauritius or Tanzania; that the Company will have sufficient cash flow, debt or equity sources or other financial
resources required to fund its capital and operating expenditures and requirements as needed; that the Company will have adequate funding to continue operations; that the Company will successfully negotiate agreements; receipt of required
regulatory approvals; the ability of the Company to increase production at a consistent rate; infrastructure capacity; commodity prices will not further deteriorate significantly; the ability of the Company to obtain equipment and services in a
timely manner to carry out exploration, development and exploitation activities; future capital expenditures; availability of skilled labour; timing and amount of capital expenditures; uninterrupted access to infrastructure; the impact of increasing
competition; conditions in general economic and financial markets; effects of regulation by governmental agencies; that the Company’s appeal of various tax assessments will be successful; that the enactment of the Act and new legislation in
Tanzania will not impair the Company’s rights under the PSA to develop and market natural gas in Tanzania; current or, where applicable, proposed industry conditions, laws and regulations will continue in effect or as anticipated as described
herein; and other matters.

Additionally, the forward-looking statements regarding the Company's expectations of future Tanzanian gas demand are based on certain assumptions made by the Company as discussed above as well as additional assumptions including, but not
limited to, the completion of planned gas fired plant expansions, increase in industrial and residential demand; and other matters.

The amount of future cash dividends, if any, will be subject to the discretion of the Board of Directors and may vary depending on a variety of factors and conditions existing from time-to-time, including fluctuations in commodity prices,
production levels, capital expenditures, debt service requirements, operating costs and other burdens, foreign exchange rates and the satisfaction of solvency tests imposed by the applicable corporate requirements.

Management has included the above summary of assumptions and risks related to forward-looking information provided in this document in order to provide stakeholders with a more complete perspective on the Company's current and future
operations and such information may not be appropriate for other purposes. Orca's actual results, performance or achievement could differ materially from those expressed in, or implied by, these forward-looking statements and, accordingly, no
assurance can be given that any of the events anticipated by the forward-looking statements will transpire or occur, or if any of them do, what benefits Orca will derive. These forward-looking statements are made as of the date of this document
and Orca disclaims any intent or obligation to update publicly any forward-looking statements, whether as a result of new information, future events or results or otherwise, other than as required by applicable securities laws. The forward-
looking statements contained in this presentation are expressly qualified by this cautionary statement.

  Orca Exploration Group                                                                                                June 2019                                                                                                               Slide 19
Advisories
NON-GAAP MEASURES
Throughout this MD&A, the Company uses certain measures to analyze operational and financial performance. These non-GAAP measures do not have any standardized meaning
prescribed under IFRS and therefore may not be comparable to similar measures presented by other entities.

Adjusted Funds Flow from Operations                                                             Net Cash

Adjusted funds flow from operations represents net cash flows from operating activities less   Net cash is used to provide information on funds available for investment purposes after
interest expense and before changes in non-cash working capital. This is a performance measure paying material liabilities:
that management believes represents the company’s ability to generate sufficient cash flow to
fund capital expenditures and/or service debt:

$’000                 THREE MONTHS ENDED MARCH 31, 2019                                         $'000               AS AT MARCH 31, 2019

Net cash flows from operating activities                  13,206                                Cash and cash equivalents                 40,372
Base interest expense                                     -1,543                                Investment in bonds                      101,119
Participatory interest expense                              -854                                                                         141,491
Changes in non-cash working capital                       -1,772                                Long-term loan                           -58,703
Funds flow from operations                                 9,037                                Net Cash                                  82,788

Weighted Average Industrial and Power Gas Prices

Weighted average gas prices are used my management to analyse revenue and compare operating results between periods:

                     THREE MONTHS ENDED MARCH 31, 2019                                           THREE MONTHS ENDED MARCH 31, 2019

Total Industrial gas sales ($'000)                        8,351                                 Reconciliation of total sales to revenue ($'000)
Divided by:
Total industrial gas volumes (MMcf)                       1,048                                 Total industrial gas sales                8,351
Weighted average industrial gas price ($/mcf)              7.97                                 Total power gas sales                    15,340
                                                                                                Gross field revenue                      23,691
Total power gas sales ($'000)                            15,340                                 TPDC revenue share                       -7,043
Divided by:                                                                                     Operating revenue                        16,648
Total power gas volumes (MMcf)                            4,472                                 Current income tax adjustment             3,288
Weighted average power gas price ($/mcf)                   3.43                                 Revenue                                  19,936

  Orca Exploration Group                                                                   June 2019                                                                                 Slide 20
Advisories
NON-GAAP MEASURES (continued)
Operating Netback On Total Deliveries
Operating netbacks represent the profit margin associated with the production and sale of additional gas and is calculated as revenues less processing and transportation tariffs, government
parastatal’s revenue share, operating and distribution costs for one thousand standard cubic feet of additional gas. This is a key measure as it demonstrates the average profit generated from
each unit of production:
THREE MONTHS ENDED MARCH 31, 2019
Weighted average industrial gas price ($/mcf) 7.97
Weighted average power gas price ($/mcf) 3.43
Weighted average gas price ($/mcf) 4.29
TPDC share of revenue -1.28
Production, distribution and transportation costs -0.53
Operating netback 2.48
Working Capital including Cash
Working capital is a measure of the Company's operating efficiency and its short-term financial health and demonstrates the Company's ability to meet its near term
obligations:
AS AT MARCH 31, 2019
Current assets 157,246
Current liabilities -66,921
Working capital 90,325
Orca Exploration Group June 2019 Slide 21Advisories
OIL AND GAS INFORMATION
The estimates of the Company's December 31, 2017 reserves and resources set forth in this Presentation have been prepared by McDaniel & Associates Consultants Ltd. ("McDaniel"), an independent qualified reserves evaluator, as December 31,
2017 in accordance with the Canadian Oil and Gas Evaluations Handbook (the "COGE Handbook" or "COGEH") and using McDaniel's forecast prices and costs as at such dates (the "McDaniel Report"). Please see Orca's Form 51-101F1 – Statement
of Reserves Data and Other Oil and Gas Information prepared on April 5, 2019 and effective December 31, 2018 on www.sedar.com for more information.
There are numerous uncertainties inherent in estimating quantities of proved, probable and possible reserves, quantities of prospective resources and future net revenues to be derived therefrom, including many factors beyond the Company's
control. The reserves, prospective resources and estimated financial information with respect to certain of the Company's assets have been independently evaluated by McDaniel. These evaluations include a number of factors and assumptions
made as of the date on which the evaluation is made such as geological and engineering estimates which have inherent uncertainties, the effects of regulation by governmental agencies such as initial production rates, production decline rates,
ultimate recovery of reserves and contingent resources, timing and amount of capital expenditures, marketability of production, current and forecast prices of crude oil and natural gas, Orca's ability to transport its product to various markets,
operating costs, abandonment and salvage values and royalties and other government levies that may be imposed over the producing life of the reserves and contingent resources. Many of these assumptions are subject to change and may not,
over time, prove to be accurate. Actual production and cash flow derived from the Company's assets may vary from these evaluations, and such variations may be material.
Estimates with respect to reserves and prospective resources that may be developed and produced in the future are often based upon volumetric calculations, probabilistic and deterministic methods and analogy to similar types of reserves and
contingent and prospective resources, rather than upon actual production history. Estimates based on these methods generally are less reliable than those based on actual production history. Subsequent evaluation of the same reserves or
prospective resources based upon production history will result in variations, which may be material, from current estimated reserves and prospective resources. Reserves and prospective resources estimates may require revision based on actual
production experience. Such figures have been determined based upon assumed commodity prices and operating costs. Market price fluctuations of crude oil and natural gas prices may render the recovery uneconomic.
"Proved" reserves (or 1P Reserves or P90) are those reserves that can be estimated with a high degree of certainty to be recoverable. It is likely that the actual remaining quantities recovered will exceed the estimated proved reserves. "Probable"
reserves (or 2P Reserves or P50) are those additional reserves that are less certain to be recovered than proved reserves. It is equally likely that the actual remaining quantities recovered will be greater or less than the sum of the estimated
proved plus probable reserves. "Possible" reserves (or 3P Reserves or P10) are those additional reserves that are less certain to be recovered than probable reserves. There is a 10% probability that the quantities actually recovered will equal or
exceed the sum of proved plus probable plus possible reserves.
Estimates of the net present value of the future net revenue from the Company's reserves do not represent the fair market value of such reserves. The estimates of reserves and future net revenue from individual properties or wells may not
reflect the same confidence level as estimates of reserves and future net revenue for all properties and wells, due to the effects of aggregation. In this Presentation NPV10 represents the net present value of net income discounted at 10%. The
NPV estimates are net estimates and are prepared after the deduction of royalties and abandonment and reclamation costs. All evaluations and reviews of future net revenue are stated prior to any provision for interest costs or general and
administrative costs and after the deduction of royalties, development costs, production costs, well abandonment costs and estimated future capital expenditures for wells to which reserves have been assigned.
References in this Presentation to production rates are useful in confirming the presence of hydrocarbons, however such rates are not determinative of the rates at which such wells will commence production and decline thereafter and are not
indicative of long term performance or of ultimate recovery. Additionally, such rates may also include recovered "load oil" fluids used in well completion stimulation. While encouraging, investors are cautioned not to place reliance on such rates
in calculating the aggregate production for the Company.
This Presentation discloses drilling locations that have associated proved and/or probable reserves based on the McDaniel Report and using McDaniel's pricing forecasts as at the dates of such reports. Unbooked locations are internal estimates
based on prospective acreage and an assumption as to the number of wells that can be drilled per drainage units based on historical practices and internal review. Unbooked locations do not have attributed reserves or resources. Unbooked
locations have been identified by management as an estimation of the Company’s multi-year drilling activities based on evaluation of applicable geologic, seismic, engineering, production and reserves information. There is no certainty that the
Company will drill all unbooked drilling locations and if drilled there is no certainty that such locations will result in additional oil and gas reserves, resources or production. The drilling locations on which the Company will actually drill wells is
ultimately dependent upon the availability of capital, regulatory approvals, seasonal restrictions, oil and natural gas prices, costs, actual drilling results, additional reservoir information that is obtained and other factors. While certain of the
unbooked drilling locations have been derisked by drilling existing wells in relative close proximity to such unbooked drilling locations, the majority of other unbooked drilling locations are farther away from existing wells where management has
less information about the characteristics of the reservoir and therefore there is more uncertainty whether wells will be drilled in such locations and if drilled there is more uncertainty that such wells will result in additional oil and gas reserves,
resources or production.
"boes" may be misleading, particularly if used in isolation. A boe conversion ratio of six thousand cubic feet of natural gas to one barrel of oil equivalent (6 mcf: 1 bbl) is based on an energy equivalency conversion method primarily applicable at
the burner tip and does not represent a value equivalency at the wellhead. Given that the value ratio based on the current price of crude oil as compared to natural gas is significantly different from the energy equivalency of 6:1, utilizing a
conversion on a 6:1 basis may be misleading as an indication of value.
Orca Exploration Group June 2019 Slide 22You can also read