Analyst Christmas Lunch - Going forward - Kauniskangas / Neuvonen November 2017
←
→
Page content transcription
If your browser does not render page correctly, please read the page content below

Analyst Christmas
Lunch
- Going forward

Kauniskangas / Neuvonen
November 2017

Contents

1. Market update
2. Large projects
3. Partnership Properties
4. Financing update

YIT |   2
1
Market update

YIT |   3

Market dynamics
    Development of macro environment
                                                                 2017: 3.0%            2017: 2.8%
                FINLAND                        2017: 1.9%        2018: 2.5%            2018: 2.0%                                   RUSSIA
                                               2018: 2.0%        2019: 2.2%            2019: 1.3%
•    Acceleration in demand boosts             2019: 2.0%
     exports, investments increasing                                                                                    •   Economy recovering, gradually
     rapidly, recovery broad-based             2017: 2.2%                                                                   recovering domestic private
                                               2018: 1.8%
•    Growth in construction to continue                                                                                     demand expected to drive growth
                                               2019: 1.9%
     solid, record-high unit start-ups in                                                                               •   Inflation extremely low but CBR
     residential construction                                                                                               expects it to be only a short-term
                                                                                       2017: 4.1%
•    Households are saving less as                                                     2018: 3.1%        2017: 1.9%         issue
     consumption has been encouraged                                                   2019: 2.9%        2018: 1.8%
                                                                                                         2019: 1.7%     •   Oil price has increased rapidly,
     by low interest rates and confidence                                                                                   presidential elections next spring
                                                                                       2017: 4.5%
     is high                                                                                                                a major determinant of the
                                                                                       2018: 3.6%
                                                                                       2019: 3.2%                           economy
                                                2017: 4.1%
                                                2018: 3.5%
      NORDIC COUNTRIES                          2019: 3.3%                         2017: 3.7%                                CEE COUNTRIES
                                                                                   2018: 3.3%
                                                                                   2019: 2.9%
•    Growth picked up in 2017, drivers
     include housing investment, private                2017: 3.5%            2017: 3.3%                                •   GDP growth has remained rapid
     consumption and exports                            2018: 3.0%            2018: 3.6%                                    this year and it is expected to
                                                        2019: 2.5%            2019: 3.6%                                    continue solid also in 2018
•    Sweden: rapidly declining
     residential prices, economy benefits                                                                               •   Mortgage interest rates still low
                                                                     BALTIC COUNTRIES
     from global growth                                                                                                 •   Residential prices have
•    Norway: rapid growth in housing              •   Economic growth accelerating, pace expected to moderate               increased in 2017 especially in
     investments, weak NOK supports                   towards 2019                                                          the Czech Republic
     exports                                      •   Baltic property market still attractive for investors
•    Denmark: economy recovering in a             •   Wages increasing due to tight labor market
     full force but ensuring continuity is a
     challenge                                    •   EU fund inflow boosts public investment in Latvia and Lithuania

    YIT |   4              Source: Bloomberg and several macro reports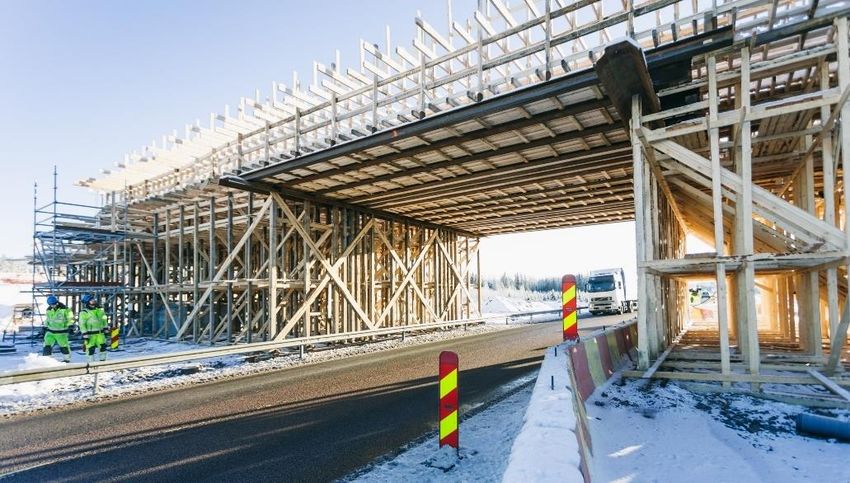
Market update: Finland
High construction volumes compensating quiet years in the past
Change in YIT’s sales mix in Finland (pcs)
• Sales are proceeding well, clear change
in mix from investors to consumers at YIT 3,502
3,192 3,040
2,779
• Good development in growth areas in
2,765 2,757 2,730
2,432 2,515
68% 68% 68%
78%
Finland 56% 52%
58%
45%
39% 2,063
1,890 1,893
• Urbanisation trend favours blocks of flats 1,567 1,869 1,555 1,596
1,315 1,251
• 500,000-600,000 people to move from 2009 2010 2011 2012 2013 2014 2015 2016 Rolling 12
countryside to cities by 2030 months
(Q4/16+
1–9/17)
Consumer sales Investor sales Share of consumer sales
Housing start-ups in Finland in general (pcs)
43,000
40,000
36,168 35,582 36,549 7,900
31,326
34,187 33,922 34,472 35,200 33,652 32,966
32,051 8,400
30,343 31,944 29,957
31,714
6,791
28,566 29,130 27,817
13,020 25,103 6,459
24,306 12,626 14,165 15,593 16,907 16,542 23,377 23,480 12,511 11,605
10,377 11,662 15,355 9,834 8,128
18,337 7,533 11,019 11,767 6,719
11,510 9,298 35,100
6,641 29,758 31,600
25,255
20,282 23,148 21,561 17,547 17,363 19,757 18,879 18,293 19,040 21,141 21,361 20,123 19,689 18,384
16,773 19,966 16,696
11,696 11,867 14,182
Block of flats and terraced houses Single family houses and other Long term average
(1995-2018e)
Source: Statistic Finland 1995-2016, Confederation of Finnish Construction Industries RT 2017e-2018e
YIT | 5
Urbanisation is supporting growth

  •     Population growth continues in growth centres despite the overall slowing trend in
        Finnish population growth

  Population development in HMA                                                  Population development forecast until 2040 in HMA
 1,400,000                                                                       1,400,000
 1,300,000                                                                       1,300,000
 1,200,000                                                                       1,200,000
                                                                                                                                 20% growth
 1,100,000                                                                       1,100,000                                          during
 1,000,000                                                                       1,000,000                                        2016–2040
   900,000                                                                        900,000
   800,000                                                                        800,000
                  1987    1991    1995    1999      2003   2007   2011   2015                2016 2019 2022 2025 2028 2031 2034 2037 2040

                                  Helsinki Metropolitan Area                                            Helsinki Metropolitan Area

  Population development in other growth centres                                 Demographic growth trend until 2040
 290,000                                                                         290,000

 240,000                                                                         240,000

 190,000                                                                         190,000

 140,000                                                                         140,000

  90,000                                                                          90,000
              1987       1991    1995     1999     2003    2007   2011   2015              2016 2019 2022 2025 2028 2031 2034 2037 2040

              Jyväskylä          Kuopio          Oulu      Tampere       Turku             Jyväskylä   Kuopio      Oulu       Tampere    Turku

Source: KTI

YIT |         6
Housing Finland and CEE
Sales and start-ups in Finland in Q3
Sold apartments (units)                                                            • Consumer sales increased
                     2016: 2,730                           1-9/2017: 2,182           by 63%

                                                                                   • Share of units sold to
                                         858    826           789                    consumers record-high:
                   705
        612                        555   240                                 567     84% (Q3/2016: 52%)
                                                317            328
                   332                                                       92
        298                        264
                                         618    509            461           475
                                                                                   • 64 apartments sold in
        314        373             291                                               bundles to investors
        Q1          Q2             Q3    Q4      Q1            Q2            Q3      (Q3/2016: 80 units)
                          2016                                2017
                      To consumers             To investors (funds)

Apartment start-ups (units)

                     2016: 2,877                           1-9/2017: 2,451

                                                             1081
        817                        819          790           305
                   657             185   584                                 580
        262                                     213
                   277                   168                                 28
                                   634                        776
        555                                     577                          552
                   380                   416

        Q1          Q2             Q3    Q4     Q1             Q2            Q3
                         2016                                 2017
                      To consumers             To investors (funds)

YIT |    7
CEE’s economic outlook

  Consumer confidence has developed favourably                                Household consumption on a solid uptrend
  10                                                                      130.0
   5                                                                      125.0
   0                                                                      120.0
  -5                                                                      115.0
 -10                                                                      110.0
 -15                                                                      105.0
 -20                                                                      100.0
 -25                                                                       95.0
 -30                                                                       90.0
 -35                                                                       85.0
                                                                                  Index 2010=100
 -40                                                                       80.0
       2013          2014             2015        2016     2017                   2007    2008     2009   2010   2011   2012   2013   2014   2015   2016
                            Estonia          Latvia      Lithuania      The Czech Republic            Slovakia          Poland

 Positives                                                                    Downside risks

  +           The GDP growth expectations for 2018 still solid
              supported by Germany
                                                                                  –      Wage pressure

  +           High migration in the CEE capital cities, especially in
              Bratislava, supporting the residential market
                                                                                  –   Political uncertainties e.g. in Poland

  +       Region benefits from EU funds
                                                                                  –   Risk of a real estate bubble in the Czech Republic

Source: Eurostat, Euroconstruct

YIT |         8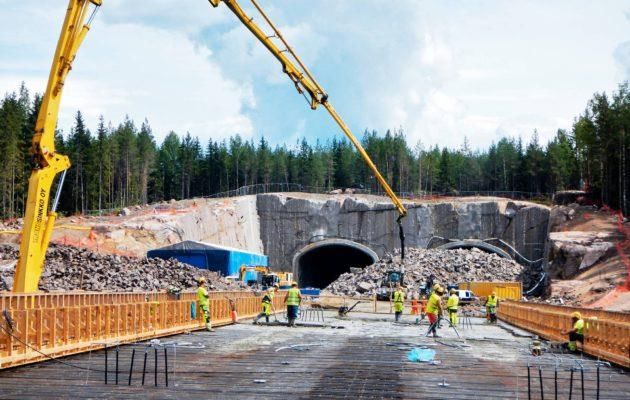
Market update: CEE countries
 Residential market in the CEE countries
Residential start-ups in the Czech Republic                        Residential start-ups in Slovakia (units)                       Residential start-ups in Poland (units)
(units)
                                                                                                                                                                                180,000
                                                                                                                                                        168,400 173,900 172,000
                                                                                                                                              148,100
                                                          32,200
                                              30,600                                                  21,400                       127,400
                                    27,200                                                19,600               20,000                                             83,600             85,000
                        26,400                                                                                            18,500                        79,200             82,000
              24,400
 22,100                                                                         15,800                                                        74,700
                                                          18,800       14,700
                                              18,000                                                  13,000                        72,700
                        15,000      17,200                                                11,100               12,000     11,000
              13,700
 13,700                                                                9,200    9,600
                                                                                                                                                        89,200    90,300   90,000    95,000
                                              12,600      13,400                                                                              73,400
              10,700    11,400      10,000                                                 8,500      8,400     8,000     7,500     54,700
  8,400                                                                5,500    6,200

     2013      2014      2015        2016     2017F       2018F        2013     2014       2015       2016     2017F      2018F        2013    2014      2015     2016     2017F     2018F
                Block of flats     Single family houses                          Block of flats    Single family houses                          Block of flats   Single family houses

 •          Prague supply lower than demand                        •      Bratislava housing volumes on                            •      Warsaw demand will stay high due
            for years to come due to slow city                            high level due to migration and                                 to urbanisation and migration
            planning and permitting process                               good macro situation                                     •      Supply in balance with demand
 •          Price increase will continue                           •      Supply has been able to adjust to                               due to capacity – prices stable
 •          Increased cost inflation due to                               the demand                                               •      Political risks which could impact
            good macro performance                                 •      Moderate price increase expected                                foreign investments
 •          Lack of resources also in                                     to continue                                              •      Krakow, Gdansk and Wroclaw
            construction                                           •      Lack of skilled workforce and                                   interesting opportunities
                                                                          increasing cost level

Source: Euroconstruct, June 2017

YIT | 9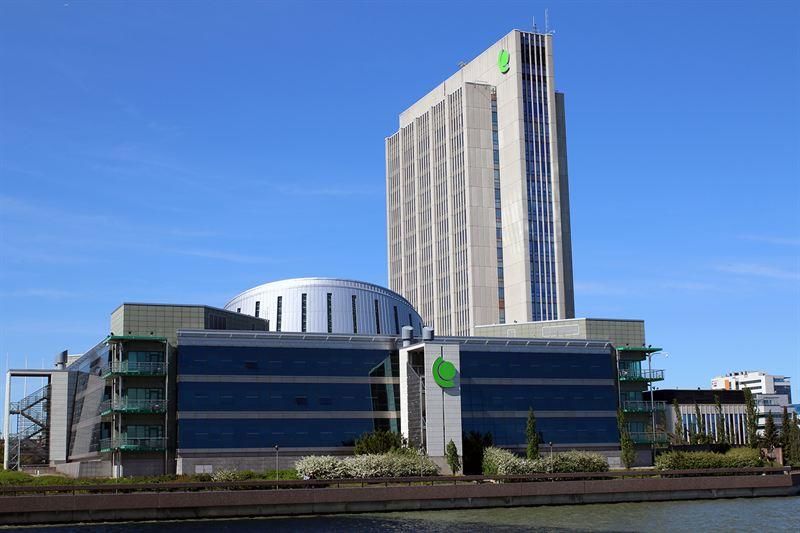
Market update: CEE countries
 Residential market in the Baltic countries
Residential start-ups in the Estonia (units)               Residential start-ups in Latvia (units)                 Residential start-ups in Lithuania (units)

                                           5,600
                                                                                                                                                  12,703
                                   4,732           4,900                                                                                                   11,300
                                           1,500                                                                                        10,177                      10,200
                        3,969                      1,400
                                   1,511                                                                                                          7,524
                                                                                                                               7,624                       5,700
             2,756      1,270                                                                                                                                       5,200
                                                                       2,631                                           5,926             6,118
     2,079                                                     2,237            2,242      2,200           2,300
              976                                                                                  2,100
                                           4,100                                                                               4,691
                                                   3,500               1,392                                           3,597
     966                           3,221                       1,376            1,136      1,134   1,100   1,200
                        2,699
                                                                                                                                                  5,179    5,600    5,000
             1,780                                                                                                                       4,059
     1,113                                                             1,239    1,106      1,066   1,000   1,100       2,329   2,933
                                                               861

     2013     2014    2015         2016     2017F 2018F        2013    2014    2015        2016     2017F 2018F        2013    2014     2015      2016     2017F 2018F
                 Block of flats     Single family houses                  Block of flats    Single family houses                 Block of flats   Single family houses

 •      Tallinn price level almost on 2008                 •      Market changed - demand and                      •      Healthy national economy
        pre-crisis level                                          prices in suburbs increasing                     •      Vilnius has taken big part of
 •      15-20% of flat buyers are Finnish                  •      Consumers are still cost sensitive                      international shared service
 •      Moderate price increase expected                          - demand in prime locations low                         centers – stable housing market
        to continue due to increasing                      •      Legal changes to improve                                4,000-5,000 flats
        purchase power                                            permitting and balance tenant’s                  •      Moderate price growth
 •      Supply and demand in balance                              and landlord’s position in flat rental           •      Kaunas will be the next in line to
                                                           •      Prices still close to after crisis level                grow in volumes

Source: Euroconstruct, June 2017

YIT | 10
Operations in the CEE countries
Financials update on housing in CEE
Revenue, EUR million, the CEE countries’ share of the segment’s revenue, %
• The revenue during 1–
140
9/2017 has already
111 116 exceeded full year 2016
120 106
100
80
80 72 • EBIT-% above the Housing
60 47 Finland and CEE segment’s
18%
40
7% 11% 14% 15% 14% average since 2015
20
•
0
2013 2014 2015 2016 1–9/2016 1–9/2017
Growth in residential sales
volume every year since
Revenue CEE's share of the segment
2010
Apartment sales and start-ups, units
• In 1–9/2017, unit sales
grew by 68% y-o-y
SALES CAGR • In 2016, unit sales grew
2011-2016 by 17% y-o-y
1,300
27% 1,197 1,181
1,091 1,070
1,0231,021
• The number of start-ups has
723 734 789
526 530 521
637 been limited in 2017 due to
364 384 slow permitting processes
• Residential prices in a
2011 2012 2013 2014 2015 2016 1–9/2016 1–9/2017 growing trend on average
Apartments sold Start-ups
All figures according to segment reporting (POC).
YIT | 11Examples of YIT’s projects under construction in the CEE
countries
Estonia Poland Slovakia Czech Republic
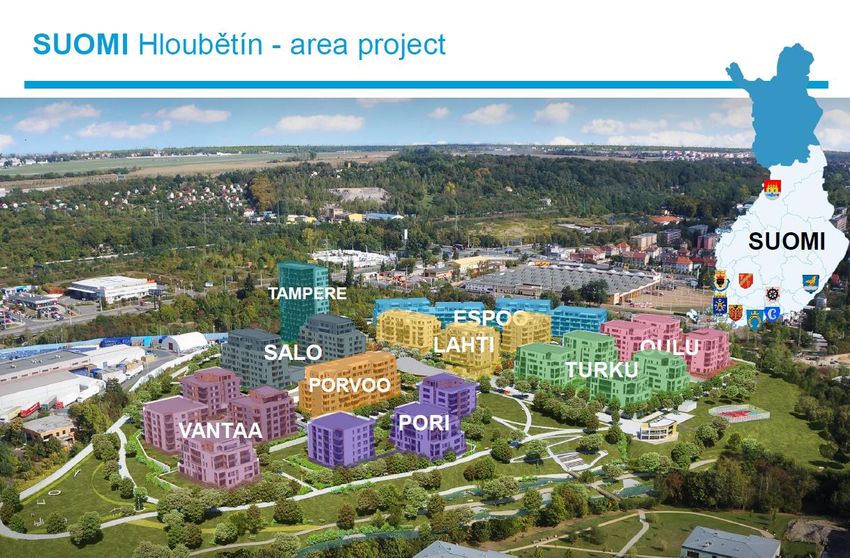
Mäepealse: 600 flats Nordic Mokotow: 300 flats Stein2: 450 flats Suomi Hloubetin: 1,000 flats
Estonia Czech Republic Czech Republic Latvia
Vibu: 500 flats Nuppu: 1,000 flats Aalto Cibulka: 250 flats Bikernieku: 500 flats
Latvia Lithuania Lithuania Lithuania
Gulbju: 250 flats Piliamiestis: 500 flats Raitininku: 250 flats Sporto: 250 flats
Source: Newsec
YIT | 12Finnish brand
Suomi-alue Tsekissä – voidaanko
highly valued in the kertoa?
CEE countries
•• Suomen vahva brändi CEE-
Suomi Hloubetin area
maissa
developmenton tärkeä
project in the kilpailuetu
Czech Republic named after
Finnish towns
• In total 900 apartments to be
completed by 2023
YIT | 13Housing Russia
Sales and start-ups in Q3
Sold apartments (units) and share of sales financed with a mortgage (%) • Number of sold units
2016: 3,523 (51%) 1-9/2017: 1,942 (52%) decreased by 8% y-o-y
892 880 925 • No changes in price lists
826 812
584 • Sales increased by 39%
546
from Q2, growth especially
54% 52% 52% 56%
50% 49% 48% in economy segment
• Start-ups were increased in
Q1 Q2 Q3 Q4 Q1 Q2 Q3
order to maintain the critical
2016 2017 construction volume, target
Sold apartments Financed with mortgages, %
to release capital remains
Apartment start-ups (units)
2016: 2,782 1-9/2017: 1,992
1,125
782 741 761
486 490
389
Q1 Q2 Q3 Q4 Q1 Q2 Q3
2016 2017
YIT | 142 Large projects YIT | 15
Market update: Business Premises and Infrastructure
Large projects in order backlog
Estimated completions of 5 largest
                 Jun-17            self-developed
                                Dec-17            business premises
                                               Jul-18       Feb-19 projects and 5 largest
                                                                         Aug-19           business premises
                                                                                        Mar-20        Sep-20and infrastructure
                                                                                                                    Apr-21     contracts
                                                                                                                                  Oct-21

               Tripla hotel                                           ~90
                                                                                                                            Value in order backlog
         Naantali CHP             ~40
         power plant
      Helsinki Central                              ~50
           Library
   Myllypuro Campus,
                                                             ~70
       Metropolia
            Tampere
          light railway                                                                 ~110
      E18 Hamina-
  Vaalimaa motorway                                   ~260
Extension of Business
    Park Rantatie                 ~25
              K3 Posti
              terminal                       ~29

                 K3 Wihuri                 n/a

         Kasarmikatu 21              n/a

              Mall of Tripla                                   ~600

                                            2018                       2019                    2020                  2021                      2022

  Announced            (not yet in order backlog)             Potential                                  Upcoming projects
  •     Raide-Jokeri planning phase (2017-2018)               • Raide-Jokeri construction phase 2019->   • Several infrastructure contracts coming
  •     Fortum headquarters                                   • Hippos 2020 (2018–2023)                    to the market, such as roads, bridges,
  •     Tripla offices (2017->)                               • Helsinki High-Rise (2020/2021->)           tunnels, refineries, metro stations…
  •     Kuopion Kuntolaakso

YIT |    16
Fortum headquarters – A development
project by Regenero
• Entity comprising the Fortum’s heaquarters:
the high-rise building, the Keilalampi office
building and unused residential building rights
• YIT has the right to purchase the new residential
construction rights from Regenero
• Target to develop mixed-use urban environment
near excellent public transportation connections
• YIT will implement the construction work related
to the project as a turnkey contract and is
responsible for the implementation planning of
the project
• Regenero is a joint-venture formed by YIT and
HGR Property Partners
YIT | 17Hippos2020 Targeted number of
visitors when
Total floor space
of buildings
completed
• A hybrid project with various recreation facilities
3–5 million 122,000
in Jyväskylä, Finland
per annum
sq.m
• Keva and OP in a consortium, chosen to
innovation development phase
• The final decision regarding the constructor of
the project will be chosen by the end of 2017 Area to be
refurbished
• Total investment in the area will be
approximately EUR 200–300 million 42,000
sq.m.
• Planned time of construction: 2018–2023
YIT | 18Helsinki High Rise
• YIT’s proposal was chosen for the second
phase of international High Rise design-build
competition
• Design area covers 150,000–200,000 square
metres of residential, office and commercial
premises
• The winner and approval of the implementation
will be decided in autumn 2018
• Winner of the competition has an opportunity to
start the construction work in 2020–2021 if city
planning process proceeds as promised
YIT | 193 Partnership Properties YIT | 20
Partnership Properties
More out of urban development
                                        KEY ACTIONS

                                                        Step C
                                                        • Residential services
                               Step B                   • Renovation services
                              • Partnership Properties
                                segment                                          Growing
             Step A           • Improved risk tolerance                          operating
             • Group Urban    • More professional              More              profit
                                                               stable
               development      resources
                                                               cash
               unit                       More                 flow
             • Plot factory               investment                       Long-term
                                          capacity
                            More                                           customerships
                            projects                    Ownership and
                                                      quarterly
                More                                  reporting
                ideas            Faster turnover
                                 of plot portfolio
             Wider portfolio
             of development
             projects

                                            NEW APPROACH
YIT |   21
Targets of the new business area
Improve visibility on
Improve group’s Create portfolio of
1 growth capability 2 true value of
existing assets
3 stable cash flows
Sufficient information
Participation in sizeable of assets Diversified real-estate
urban developments and urban area portfolio
Clarified
earnings model
Substantial investment Long-term customer
capacity through relationships and living
partnerships Fair value of assets services
Targets
Total investment capacity from EUR 1,000 million (3/2017)
to over EUR 2,000 million (12/2020)
Including YIT’s and partners’ equity and debt in joint ventures ROE target for
Of which YIT’s equity share to increase from investment (excluding
EUR 170 to 300–400 million construction stage and
fair value gains)
All investments in mega projects done with partners >10%
Only equity share in YIT’s balance sheet
YIT | 22Own-based vs. tender-based business model
Own-based business Tender-based business
margin
Risks margin Risks
Partnership
Number and
Properties Schedule activity of
Costs
effect
competitors Intensity of
Demand
competition
Sales price level
Employer’s
Interest level behaviour
capital tied
volume
• Through partnerships it is possible to achieve the best sides of both business
models
• Lower capital intensiveness
• Higher margins than in traditional tendering
• Take more out of YIT’s development capability
• Better visibility on future revenue sources
• Creation of partnership network
Dynamic business model in different market conditions
YIT | 23Value creation process
Capabilities and
Outcome Results
resources
Tripla
Urban city Fortum
Area Hippos
development
developments Siltamäki
Hakunila
Area development
Concrete 70–80%
projects of own based projects
Specialised own
based development
Building 500,000–600,000
Plot factory right sqm
of annual building rights
YIT | 24Market dynamics
Balanced risk profile and operating model
higher margin
more capital tied • Balanced risk profile boosted
higher capital and OWN-BASED
consumer risk Solutions
BUSINESSfor with Partnership Properties
urban living offers opportunities to vary
e.g. affordable
apartments between:
• different business models
• capital structures
• products and services
Dynamic business model
TENDER-BASED
BUSINESS in different market conditions
Business lower margin
model no capital tied
higher market and
competition risk
YIT | 25Business model offering new earnings potential
Different sources of earnings
Sales of Cash flow /
Turn key
developed market based Steady cash flow
contract Optimal timing of
projects to a valuation of the through
fund Recognition 100% disposal
asset after ownership
when finished completion
Market valuation
Ownership of mega projects during development and execution phase
In practise
Ownership and leasing of plots
Ownership of apartments in CEE countries and in Finland
Ownership of apartments, business premises and parking spaces
when developing new business models
YIT | 26Examples of created projects in different asset classes
Mall of Tripla E18 Hamina-Vaalimaa Highway Tietotie renovation
• Value: EUR ~600 million • PPP-project with Meridiam • Detail design ongoing
• Unique concept • EUR 220 million investment • Long-term contract under
negotiation
• Unique location • 20 years maintenance contract
with Finnish Transportation • Good location in Otaniemi
• 40 million visitors* annually Campus, 100 m from metro
agency entrance
*Estimation
YIT | 27Partnership properties
YIT’s role extended from development to establishment
Current model New model
1000
• ~1–3 years Establishment •
1000 Value creation Establishment
holding period potential period
•
900 Uncertainties in 900
unlocked
the length of through
800 development optimizing
800
period Execution holding period Execution
period • ~5–7 years period
700 700 usually needed
600 600
500 500
400 400
300Development
Development
300
period period
200 200
100 100 15–
20%*
0 0
Plot acquisition Development cost Plot acquisition Development cost
Construction cost Fair value Construction cost Fair value
YIT | 28 *Through JV structure, more projects can be realised
with less capital tied in each projectPartnership properties
Roles of the new segment
Segment involved only in large and/or long-term
development projects financed with partners
Key roles
➢ Investment case preparation
➢ Legal structuring
➢ Funding
➢ Asset valuation (external valuation to create
transparency)
➢ Care on assets during the ownership period E18 Hamina-Vaalimaa motorway
Finland
➢ Divestment preparation
Through internal partnerships
➢ Project development and construction
➢ Leasing & divestment
➢ Customer care
➢ Renovations
Through external partnerships
➢ Maintenance and facility management Kasarmikatu 21,
Helsinki, Finland
YIT | 29Market dynamics
ROE vs. cash flow in different models in own-based business
YIT alone Joint-venture
• High capital employed • Lower capital employed
Development only • High EBIT • Lower EBIT
• High risk • Shared risk
• Lower capital employed
Long-term cash-flow generating • Lower EBIT
Not possible
investment • Shared risk
• Annual cash-flow
Illustrative case example
200 Steady, positive cash flow after 1–2 years
Return in equity 10%
External
EUR 2 million per annum
financing 50%
~50–110
Equity share 50%
10–20
Of which YIT’s 60
40
share: 20% 20
20 margin
Total investment Turn-key contract Profit 10 years Profit 20 years Profit 30 years Profit from sale of Profit in total
margin equity stake
ROCE-% with 10 years (20,1%), 20 years (16,8%), 30 years (15,5%) ownership period
YIT | 304 Financing update YIT | 31
Financial position
Financial key ratios in Q3
• Gearing and equity ratio impacted by temporarily increased net debt
• Net debt/EBITDA (IFRS) continued to improve

Gearing (%)                                            Equity ratio (%)                                          Net debt/EBITDA (Multiple, x)

                                                                                                                               12.3    12.3

                                                                                                                                              10.3
               118.9                           124.0
                       112.3           115.0                   36.4                                                                                  8.6
108.6 104.8                                                                    35.1    35.4    34.6                      8.1
                               103.6                   34.1            33.8                           34.3
                                                                                                                  6.9          8.9
                                                                                                                                                            6.0
                                               97.5            32.9
 89.6           91.8                   87.0            31.5                    31.2    31.1                      6.1                   6.8
        82.5            83.3                                           30.1                    30.7   30.6               6.5
                                                                                                                                                     6.0
                               72.8                                                                                                           5.5
                                                                                                                                                            4.9

 Q1      Q2     Q3        Q4    Q1      Q2      Q3     Q1      Q2      Q3      Q4      Q1      Q2      Q3         Q1     Q2    Q3      Q4     Q1     Q2     Q3
             2016                      2017                       2016                        2017                         2016                      2017

                                                                                                                        POC          IFRS
                    POC         IFRS                                      POC           IFRS

Financial covenant tied to gearing (maximum level of   Financial covenant tied to the equity ratio (minimum
150.0%, IFRS) in the syndicated RCF agreement and      level of 25.0%, IFRS) in bank loans, the syndicated RCF
in bank loans.                                         agreement and the bonds issued in 2015 and 2016.

YIT |   32
Residential construction stage financing to meet market
practice
• Until now, YIT has sold the contract receivables from housing corporations fo financial institutions
This model differs from market practice and doesn’t offer similar benefits than before
Previously used financing model Current model since Q4 2017
• YIT’s subsidiary YIT Construction sells the contract • Housing company debt drawn to finance the construction
receivables from Housing corporations (also owned stage
by YIT) to financial institutions • Housing corporation loan related to unsold apartments is
• Due upon completion booked in interest bearing liabilities
• Sold in line with the progress of the project Benefits
• Housing company loans of sold apartments are not
burdening YIT’s balance sheet
• Similar reporting treatment as with POC debt
Impacting the total amount of net debt
YIT Customers YIT Customers
Customer payments Customer payments
(20%) Payment for (20%)
YIT Housing construction costs Housing
YIT
Construction corporations corporations
Construction
Receivables, Housing corporation
Debt sold to banks loans (70%)
Financial institutions Financial institutions
YIT | 33Financial position
Balanced debt portfolio
Debt portfolio at the end of the period 9/2017, EUR 701 million Maturity structure at the end of the period 9/2017
Maturity profile, excluding construction stage financing
(EUR million)
500
Commercial papers
450
Bonds, 21%
400 Pension loans
Commercial papers, 27% 350 Bank loans
Construction stage financing, 33% 300 Bonds
Pension loans, 9% 250
200
Bank loans, 10%
150
100
50
0
9/2017 9/2018 9/2019 9/2020 9/2021 9/2022
Floating rate, 29%
Average interest rate 1.24%
• YIT starts to finance construction stage with housing
Fixed rate, 71% company loans according to market practice
Average interest rate 3.35%
Average interest rate: 2.75%
YIT | 34Financial position
Net debt and maturity structure in Q3
• Net debt increased temporarily due to negative cash flow from operations
• A new EUR 50 million, 3-year bilateral loan withdrawn after the review period in October
Interest-bearing debt (EUR million), IFRS Maturity structure of long-term debt 9/2017 (EUR million) 1
677 678 700 668 701
628 649
33 35 39 43 159.6
122 72 40
67 66 78 35 32
555 557 578 599 551 573 626
50.0 50.0
11.3 10.5
Q1 Q2 Q3 Q4 Q1 Q2 Q3 2017 2018 2019 2020 2021
2016 2017
1 Excluding construction stage financing
Net debt Cash and cash equivalents
Interest-bearing receivables
YIT | 35Disclaimer This presentation has been prepared by, and the information contained herein (unless otherwise indicated) has been provided by YIT Corporation (the “Company”). By attending the meeting or event where this presentation is made, or by reading the presentation slides, you agree to be bound by the following limitations. This presentation is being furnished to you solely for your information on a confidential basis and may not be reproduced, redistributed or passed on, in whole or in part, to any other person. This presentation does not constitute or form part of and should not be construed as, an offer to sell, or the solicitation or invitation of any offer to buy, acquire or subscribe for, securities of the Company or any of its subsidiaries in any jurisdiction or an inducement to enter into investment activity. No part of this presentation, nor the fact of its distribution, should form the basis of, or be relied on in connection with, any contract or commitment or investments decision whatsoever. The information contained in this presentation has not been independently verified. No representation, warranty or undertaking, expressed or implied, is made as to, and no reliance should be placed on, the fairness, accuracy, completeness or correctness of the information or the opinions contained herein. Neither the Company nor any of its respective affiliates, advisors or representatives nor any other person shall have any liability whatsoever (in negligence or otherwise) for any loss however arising from any use of this presentation or its contents or otherwise arising in connection with the presentation. Each person must rely on their own examination and analysis of the Company and the transactions discussed in this presentation, including the merits and risks involved. This presentation includes “forward-looking statements”. These statements contain the words "anticipate", “will”, "believe", "intend", "estimate", "expect" and words of similar meaning. All statements other than statements of historical facts included in this presentation, including, without limitation, those regarding the Company’s financial position, business strategy, plans and objectives of management for future operations, are forward-looking statements. Such forward-looking statements involve known and unknown risks, uncertainties and other important factors that could cause the actual results, performance or achievements of the Company to be materially different from future results, performance or achievements expressed or implied by such forward-looking statements. Such forward-looking statements are based on numerous assumptions regarding the Company's present and future business strategies and the environment in which the Company will operate in the future. These forward-looking statements speak only as at the date of this presentation. The Company expressly disclaims any obligation or undertaking to disseminate any updates or revisions to any forward-looking statements contained herein to reflect any change in the Company's expectations with regard thereto or any change in events, conditions or circumstances on which any such statement is based. The Company cautions you that forward-looking statements are not guarantees of future performance and that its actual financial position, business strategy, plans and objectives of management for future operations may differ materially from those made in or suggested by the forward-looking statements contained in this presentation. In addition, even if the Company's financial position, business strategy, plans and objectives of management for future operations are consistent with the forward-looking statements contained in this presentation, those results or developments may not be indicative of results or developments in future periods. Neither the Company nor any other person undertakes any obligation to review or confirm or to release publicly any revisions to any forward-looking statements to reflect events that occur or circumstances that arise after the date of this presentation. YIT |
Disclaimer
Important information regarding the merger of YIT and Lemminkäinen
The information contained in this presentation regarding the merger of YIT Corporation (“YIT”) and Lemminkäinen Corporation (“Lemminkäinen”) (unless otherwise indicated) has been provided by YIT and
Lemminkäinen. By attending the meeting where this presentation is made, or by reading the presentation slides, you agree to be bound by the following limitations. This presentation is being furnished to you solely
for your information on a confidential basis and may not be reproduced, redistributed or passed on, in whole or in part, to any other person.
This presentation does not constitute a notice to an extraordinary general meeting or a merger prospectus and as such, does not constitute or form part of and should not be construed as, an offer to sell, or the
solicitation or invitation of any offer to buy, acquire or subscribe for, any securities or an inducement to enter into investment activity. Any decision with respect to the proposed statutory absorption merger of
Lemminkäinen into YIT (the “Merger”) should be made solely on the basis of information to be contained in the actual notices to the extraordinary general meeting of YIT and Lemminkäinen, as applicable, and the
merger prospectus related to the Merger as well as on an independent analysis of the information contained therein. You should consult the merger prospectus for more complete information about YIT,
Lemminkäinen, their respective subsidiaries, their respective securities and the Merger.
The distribution of this presentation may be restricted by law and persons into whose possession any document or other information referred to herein comes should inform themselves about and observe any such
restrictions. The information contained herein is not for publication or distribution, directly or indirectly, in or into Canada, Australia, Hong Kong, South Africa or Japan. Any failure to comply with these restrictions may
constitute a violation of the securities laws of any such jurisdiction. This presentation and any materials distributed in connection with this presentation are not directed to, or intended for distribution to or use by, any
person or entity that is a citizen or resident or located in any locality, state, country or other jurisdiction where such distribution, publication, availability or use would be contrary to law or regulation or which would
require any registration or licensing within such jurisdiction.
No part of this presentation, nor the fact of its distribution, should form the basis of, or be relied on in connection with, any contract or commitment or investment decision whatsoever. The information contained in
this presentation has not been independently verified. No representation, warranty or undertaking, expressed or implied, is made as to, and no reliance should be placed on, the fairness, accuracy, completeness or
correctness of the information or the opinions contained herein. Neither YIT nor Lemminkäinen, nor any of their respective affiliates, advisors or representatives or any other person, shall have any liability whatsoever
(in negligence or otherwise) for any loss however arising from any use of this presentation or its contents or otherwise arising in connection with the presentation. Each person must rely on their own examination and
analysis of YIT, Lemminkäinen, their respective subsidiaries, their respective securities and the Merger, including the merits and risks involved.
This presentation includes “forward-looking statements.” These statements may not be based on historical facts, but are statements about future expectations. When used in this presentation, the words “aims,”
“anticipates,” “assumes,” “believes,” “could,” “estimates,” “expects,” “intends,” “may,” “plans,” “should,” “will,” “would” and similar expressions as they relate to YIT, Lemminkäinen, the Merger or the combination of the
business operations of YIT and Lemminkäinen identify certain of these forward-looking statements. Other forward-looking statements can be identified in the context in which the statements are made. Forward-
looking statements are set forth in a number of places in this presentation, including wherever this presentation include information on the future results, plans and expectations with regard to the combined
company’s business, including its strategic plans and plans on growth and profitability, and the general economic conditions. These forward-looking statements are based on present plans, estimates, projections and
expectations and are not guarantees of future performance. They are based on certain expectations, which, even though they seem to be reasonable at present, may turn out to be incorrect. Such forward-looking
statements are based on assumptions and are subject to various risks and uncertainties. Shareholders should not rely on these forward-looking statements. Numerous factors may cause the actual results of
operations or financial condition of the combined company to differ materially from those expressed or implied in the forward-looking statements. Neither YIT nor Lemminkäinen, nor any of their respective affiliates,
advisors or representatives or any other person undertakes any obligation to review or confirm or to release publicly any revisions to any forward-looking statements to reflect events that occur or circumstances that
arise after the date of this presentation. The combined financial information is presented for illustrative purposes only.
The combined income statement information has been calculated assuming the activities had been included in one entity from the beginning of each period. The preliminary revenue, adjusted operating profit and
operating profit of the combined company have been calculated as a sum of combined financial information for the twelve months ended 31 December 2016. The combined financial information is based on a
hypothetical situation and should not be viewed as pro forma financial information.
This presentation includes estimates relating to the synergy benefits expected to arise from the Merger and the combination of the business operations of YIT and Lemminkäinen, which have been prepared by YIT
and Lemminkäinen and are based on a number of assumptions and judgments. Such estimates present the expected future impact of the Merger and the combination of the business operations of YIT and
Lemminkäinen on the combined company’s business, financial condition and results of operations. The assumptions relating to the estimated synergy are inherently uncertain and are subject to a wide variety of
significant business, economic, and competitive risks and uncertainties that could cause the actual synergy benefits from the Merger and the combination of the business operations of YIT and Lemminkäinen, if any,
to differ materially from the estimates in this presentation. Further, there can be no certainty that the Merger will be completed in the manner and timeframe described in this presentation, or at all.

Notice to Lemminkäinen Corporation Shareholders in the United States
The YIT Corporation shares to be issued in connection with the merger have not been registered under the U.S. Securities Act of 1933, as amended (the “Securities Act”) and are being issued in reliance on the
exemption from registration set forth in Rule 802 under the Securities Act.
YIT Corporation and Lemminkäinen Corporation are Finnish companies and the issuance of YIT Corporation shares will be subject to procedural and disclosure requirements in Finland that may be different from
those of the United States. Any financial statements or other financial information included on this presentation may have been prepared in accordance with non-U.S. accounting standards thatmay not be
comparable to the financial statements of U.S. companies or companies whose financial statements are prepared in accordance with generally accepted accounting principles in the United States.
It may be difficult for U.S. shareholders of Lemminkäinen Corporation to enforce their rights and any claims they may have arising under U.S. federal securities laws in connection with the merger, since YIT
Corporation and Lemminkäinen Corporation are located in non-U.S. jurisdictions, and some or all of YIT Corporation's and Lemminkäinen Corporation's officers and directors may be residents of countries other than
the United States. As a result, U.S. shareholders of Lemminkäinen Corporation may not be able to sue YIT Corporation or Lemminkäinen Corporation or their respective officers and directors in a court in Finland for
violations of U.S. federal securities laws. Further, it may be difficult to compel YIT Corporation or Lemminkäinen Corporation to subject themselves to the jurisdiction or judgment of a U.S. court.
Lemminkäinen Corporation's shareholders should be aware that YIT Corporation may purchase Lemminkäinen Corporation's shares otherwise than under the merger, such as in open market or privately negotiated
purchases, at any time during the pendency of the proposed merger.

YIT |
You can also read