A NEW CHAPTER FOR VALLOUREC

Page created by Gabriel Ryan
 
CONTINUE READING
A NEW CHAPTER FOR VALLOUREC
A NEW CHAPTER FOR
VALLOUREC

              Confidential   1
A NEW CHAPTER FOR VALLOUREC
LEGAL DISCLAIMER
 Forward-Looking Statements
 This presentation may include forward-looking statements. These forward-looking statements can be identified by the use of forward-looking terminology, including the terms as “believe”, “expect”, “anticipate”, “may”,
 “assume”, “plan”, “intend”, “will”, “should”, “estimate”, “risk” and or, in each case, their negative, or other variations or comparable terminology. These forward-looking statements include all matters that are not
 historical facts and include statements regarding the Company’s intentions, beliefs or current expectations concerning, among other things, Vallourec’s results of operations, financial condition, liquidity, prospects,
 growth, strategies and the industries in which they operate. By their nature, forward-looking statements involve risks and uncertainties because they relate to events and depend on circumstances that may or may not
 occur in the future. These risks include those developed or identified in the public documents filed by Vallourec with the French Financial Markets Authority (Autorité des marches financiers, or “AMF”), including those
 listed in the “Risk Factors” section of the Registration Document filed with the AMF on March 29, 2021. Readers are cautioned that forward-looking statements are not guarantees of future performance and that
 Vallourec’s or any of its affiliates’ actual results of operations, financial condition and liquidity, and the development of the industries in which they operate may differ materially from those made in or suggested by the
 forward-looking statements contained in this presentation. In addition, even if Vallourec’s or any of its affiliates’ results of operations, financial condition and liquidity, and the development of the industries in which they
 operate are consistent with the forward-looking statements contained in this presentation, those results or developments may not be indicative of results or developments in subsequent periods. .

 Cautionary Statement
 This presentation does not, and shall not, in any circumstances constitute a public offering or an invitation to the public in connection with any offer.

 No communication and no information in respect of this transaction may be distributed to the public in any jurisdiction where a registration or approval is required. No steps have been or will be taken in any jurisdiction
 (other than France) where such steps would be required. The issue, the subscription for or the purchase of Vallourec’s shares may be subject to specific legal or regulatory restrictions in certain jurisdictions. Vallourec
 assumes no responsibility for any violation of any such restrictions by any person.

 This announcement is not a prospectus within the meaning of Regulation (EU) 2017/1129 of the European Parliament and the Council of June 14, 2017 (as amended or superseded, the “Prospectus Regulation”).

 No securities offering will be opened to the public in France before the delivery of the approval on a prospectus prepared in compliance with the Prospectus Regulation, as approved by the AMF.
 In France, an offer of securities to the public may only be made pursuant to a prospectus approved by the AMF. With respect to the member States of the European Economic Area (each, a “relevant member State”),
 other than France, no action has been undertaken or will be undertaken to make an offer to the public of the shares requiring a publication of a prospectus in any relevant member State. Consequently, the securities
 cannot be offered and will not be offered in any member State (other than France), except in accordance with the exemptions set out in Article 1(4) of the Prospectus Regulation, or in the other case which does not
 require the publication by Vallourec of a prospectus pursuant to the Prospectus Regulation and/or applicable regulation in the member States.

 This presentation does not constitute an offer of the securities to the public in the United Kingdom. The distribution of this presentation is not made, and has not been approved, by an authorized person (“authorized
 person”) within the meaning of Article 21(1) of the Financial Services and Markets Act 2000. As a consequence, this presentation is directed only at (x) persons who (i) are outside the United Kingdom, (ii) have
 professional experience in matters relating to investments falling within Article 19(5) of the Financial Services and Markets Act 2000 (Financial Promotion) Order 2005, as amended (the “Order”), or (iii) are high net
 worth entities falling within Article 49(2) of the Order and (y) any other persons to whom it may otherwise lawfully be communicated (all such persons together being referred to as “Relevant Persons”).

 The securities are directed only at Relevant Persons and no invitation, offer or agreements to subscribe, purchase or acquire the securities may be proposed or made other than with Relevant Persons. Any person
 other than a Relevant Person may not act or rely on this document or any provision thereof. This presentation is not a prospectus which has been approved by the Financial Conduct Authority or any other United
 Kingdom regulatory authority for the purposes of Section 85 of the Financial Services and Markets Act 2000.

 This presentation does not constitute or form a part of any offer or solicitation to purchase or subscribe for securities in the United States. Vallourec shares may not be sold in the United States absent registration or an
 exemption from registration under, as amended. Vallourec does not intend to register in the United States any portion of the offering mentioned in this presentation or to conduct a public offering of the shares in the
 United States. the U.S. Securities Act of 1933

 The distribution of this presentation in certain countries may constitute a breach of applicable law. The information contained in this presentation does not constitute an offer of securities for sale in the United States,
 Canada, Australia or Japan.
Vallourec - Investor presentation                                                                                                                                                                                                      2
A NEW CHAPTER FOR VALLOUREC
1   €300M RIGHTS ISSUE

                         3
A NEW CHAPTER FOR VALLOUREC
€300M RIGHTS ISSUE

                                                                                        KEY TERMS OF THE RIGHTS ISSUE

                            Amount                                                                                                                      €300m

                                                                                                                Preservation of the shareholders’ Preferential Subscription Rights:
         Preferential Subscription Right (“PSR”)
                                                                                                                          each shareholder will receive 1 PSR per share

                                                                                                                                                  €5.66 per share
                     Subscription Price                                             Discount of 42.3% to the theoretical value of the Vallourec share ex-rights based on the share price at the close of trading as of 1st June 2021,
                                                                                                       and of 30% to the price of the capital increase reserved to Converting Creditors1 of €8.09 per new share

                                                #                                                                                                   c. 53 million
         Nb of shares issued               % ex-post
                                                                                   c. 23% of the share capital post financial restructuring and before the exercise of warrants (“BSA”) (c. 20% after)
                                            capital

                     Subscription Ratio                                                                                             37 new shares per 8 existing shares

           Use of Proceeds of the Rights Issue                                              Partial repayment of the Other Claims in proportion to their holdings by the Converting Creditors 1

                                                                   Irrevocable commitment from Bpifrance Participations and Nippon Steel Corporation, each currently holding 14.56% of the share capital, to
                Subscription Commitments
                                                                                  subscribe on an irreducible basis through the exercise of part of their PSR for respectively €20m and €35m

                                                                   Any New Shares not subscribed in the Rights Issue will be subscribed by the Converting Creditors1, with the subscription price paid by way
          Undertaking by Converting Creditors1
                                                                                                                          of setoff against their claims

                                                                                                             Apollo, SVPGlobal, Bpfirance Participations, Nippon Steel Corporation:
                           Lock-ups
                                                                                                                             6 months after the Completion Date

                          Placement                                                                       Offering open to the public in France only, 4(a)2 offering in the United States

                                                                                                      Global Coordinators, Lead Managers and Joint Bookrunners: BNP Paribas, Natixis
                     Banking Syndicate
                                                                                                                           Joint Bookrunner: CIC Market Solutions

  1   Converting Creditors means all creditors of Vallourec S.A. Under the various Notes and RCFs except Commercial Banks (Commercial Banks means BNP Paribas, Banque Fédérative du Crédit Mutuel/ CIC and Natixis)

Vallourec - Investor presentation                                                                                                                                                                                                       4
A NEW CHAPTER FOR VALLOUREC
RIGHTS ISSUE TIMETABLE

                                                       TIMETABLE

                June 2, 2021                                         Approval by the AMF of the Prospectus

                June 3, 2021                        Press Release / description of the terms and availability of the prospectus

                June 4, 2021        Ex-rights date and beginning of the trading period of the Rights on the regulated market of Euronext Paris

                June 8, 2021                                          Beginning of the subscription period

                June 17, 2021                                         End of the trading period of the Rights

                June 21, 2021                                             End of the subscription period

                June 24, 2021                                             Announcement of the results

                June 30, 2021                          Settlement & Delivery and completion of the financial restructuring

Vallourec - Investor presentation                                                                                                                5
A NEW CHAPTER FOR VALLOUREC
2   KEY HIGHLIGHTS

                     6
Q1 2021 KEY HIGHLIGHTS

                        Q1 results: Improved EBITDA at €80 million                                                                                            Confirmed 2021 Outlook

     ►     €702m revenue, down 18% y-o-y (-5% at constant exchange                                                       ►      Increased 2021 outlook released on April 30th
           rates)                                                                                                        ►      EBITDA targeted between €350 and €400m
     ►     €80m EBITDA, up 18% y-o-y, with margin up 3.4p.p. to 11.4%                                                    ►      FCF targeted between (€340) and (€260)m

     ►     Free cash flow at (€62)m versus (€181)m in Q1 2020                                                            ►      Continuous cost savings throughout the year

     ►     Cash position at €1,242m as of March 31st 2021                                                                ►      Maintained strict cash control

      Implementation of the financial restructuring to be completed on
                                                                                                                                              … allowing the roll-out of our strategic plan
                              June 30th 2021…
     ►     Safeguard Plan approved by the Commercial Court of Nanterre                                                    ►      Reinforcing the profitability of Vallourec’s core business by
           on May 19th 2021
                                                                                                                                      ►      implementing additional cost savings
                                                                                                                                      ►      maximizing the utilization of our most competitive routes
     ►     Launch of the €300m rights issue, backstopped by the Converting                                                            ►      continued innovation to successfully leverage market recovery
           Creditors1
                                                                                                                          ►      Exploiting the full potential of our mine in Brazil with a new iron ore
                                                                                                                                 treatment line by the end of 2021
     ►     Closing of the financial restructuring planned to take place on June
           30th (including the capital increase reserved to the Converting Creditors)                                     ►      Innovating in low carbon energy solutions to seize energy transition
                                                                                                                                 growth opportunities

 1   Converting Creditors means all creditors of Vallourec S.A. Under the various Notes and RCFs except Commercial Banks (Commercial Banks means BNP Paribas, Banque Fédérative du Crédit Mutuel/ CIC and Natixis)
Vallourec - Investor presentation                                                                                                                                                                                    7
WRITING A NEW CHAPTER FOR VALLOUREC...

                                                        … AND LEANER FINANCIAL STRUCTURE
                         ROBUST STRATEGIC PLAN…
                                                                   TO EXECUTE IT

               FURTHER ENHANCE PROFITABILITY: COST
              MEASURES, INNOVATION AND VALUE ADDITIVE          €1.8BN DEBT REDUCTION
                             SERVICES

                SUPPORTIVE MEDIUM-TERM TRENDS IN OUR
                                                                SUFFICIENT LIQUIDITY
                         CORE O&G MARKET

                  ACTIVATE ADDITIONAL VALUE CREATION
                                                              REDUCED FINANCING COSTS
                                LEVERS

                                     SUPPORT OF REFERENCE SHAREHOLDERS

                                        CLEAR PATH TO VALUE CREATION

Vallourec - Investor presentation                                                          8
… ROOTED IN OUR STRONG ESG COMMITMENT

                     CLIMATE                                         ENERGY                       RESOURCES USED                            SOCIAL

                       1.7                                            46%                                 97%                               2.5%
          ton of CO2 per ton                                    of energy consumed                      of our waste                  average gap between
          of tubes produced                                       from low-carbon                        recovered                     men's and women's
         vs 2 tons on average                                         sources                                                            compensation
               for peers

    The carbon footprint of our products is certified
             ISO 14025 & EN 15804+A1

 RECOGNIZED RATINGS

                                   "AA" rating                                                                         Rated No. 13 of 128 companies related
                                                                                                                       to Energy Sector Services

                                                        -25% reduction in the Group's greenhouse gas emissions in 2025
                                                        versus 2017, in line with the Paris Agreement
                                                        ➔ Validated by SBTi in May 2020, this ambition is compatible with limiting global warming to well
                                                        below 2°C

Vallourec - Investor presentation                                                                                                                              9
3
    WRITING A NEW CHAPTER FOR VALLOUREC:
    ROBUST STRATEGIC PLAN SUPPORTED BY
    STRENGTHENED BALANCE SHEET

                                           10
1
    FURTHER ENHANCE THE PROFITABILITY OF
    OUR CORE BUSINESS

                                           11
MAXIMIZING THE UTILIZATION OF OUR MOST
                  COMPETITIVE ROUTES

         TIANDA CASE STUDY: SUCCESSFUL                                                                                         CONTINUING INTEGRATION STRATEGY AND
         PREMIUMIZATION PLAN DEPLOYED                                                                                          MAXIMIZING USE OF VSB AND TIANDA

                           Tianda Premiumization rate                                                                         Utilization rate of the new routes for Oil & Gas premium OCTG orders
                                                                                                                              in EA-MEA1

                                                                                  45%                                                                                                             c.74%
                                                                                                                                                                                 62%

                                                             23%
                                       20%
                                                                                                                                         19%
                  9%

                  2018                 2019                  2020                  2025 e                                                 2015                                   2020             2025e

1   Percentage of premium OCTG and PLP products rolled at VSB or Tianda, compared to total swing order deliveries, i.e., orders that may be served interchangeably from Europe, Brazil or Asia.

Vallourec - Investor presentation                                                                                                                                                                         12
€400M ADDITIONAL GROSS SAVINGS TARGETED BY 2025

  COSTS SAVINGS POTENTIAL CONFIRMED IN 2021-2025 INDUSTRIAL ROADMAP…

 ►    Process improvement through deployment of Industry 4.0 tools, data analytics and intensification of lean initiatives

 ►    More than 250 initiatives identified and monitored at group level based on cost savings methodology successfully executed over the
      last years

 ►    Sourcing initiatives including spend control towers and low-cost countries procurement

  … EMPOWERED BY SPECIFIC ACTIONS AT REGIONAL LEVEL

                                    Europe                                             Brazil                           North America
   ► Adaptation underway of production capacity to                         ► Execute full cost                   ► Enable maximum use of
     planned demand:                                                         reduction potential at                most competitive flows
         • Closure of Deville site                                           steel plant                           by debottlenecking and
                                                                                                                   internalization
         • Social plan across French sites                                                                         initiatives
                                                                           ► Optimize production
         • Structural working time and shift pattern reduction in            flows within and across
           Germany                                                           sites                               ► Strengthen operations
                                                                                                                   agility to cope with
   ► Portfolio optimization                                                ► Internalize some key                  market volatility
                                                                             functions

Vallourec - Investor presentation                                                                                                           13
TECHNOLOGICAL EDGE AND BRAND RECOGNITION AT
           THE HEART OF VALLOUREC’S STRATEGY…
                                                                                               NUMBER OF NEW PATENTS FILED

   Proven Know-How &                ►   5 dedicated R&D centres in Europe, Brazil and the US
       Technology                   ►   430 researchers and technicians

                                    ►   Co-development with Nippon
                                                                                               ►   VAM® brand equity
   Leading Position in              ►   #1 worldwide market share for VAM® connections
                                                                                               ►   VAM® Field Services to support
     Premium OCTG                   ►   “VAM® system” developed by Vallourec
                                                                                                   customers' running operations
    Connections with
                                    ►   Successful market introduction of new   VAM®
   VAM Product Family                                                                          ►   200 licensees for maintenance and repair
                                        connections (VAM® SPRINT-SF, VAM® SPRINT-FJ, VAM®
                                                                                                   close to customers operations
                                        SLIJ-3)

                                    ►   Industry first: 3D-printed safety-critical component
         Innovation                     delivered to TotalEnergies in the North Sea
      with Customers                ►   Multiple collaborations with customers and start-ups
                                        to develop innovative solutions for the industry

Vallourec - Investor presentation                                                                                                             14
...COMPLEMENTED BY A RANGE OF SERVICES
            COMBINING ON-SITE ASSISTANCE AND DIGITAL SOLUTIONS

                                    Facilitates           Accelerates the descent      Provides complete        Online sales platform
                                  the traceability        of casing and production     inventory visibility    for Vallourec products
    OBJECTIVE OF               and pairing of tubes for      pipes on platforms      Improves the efficiency        and solutions
   THE CUSTOMER                      line pipes            Secures operations               of operations           with real-time
                                                                                        in the storage area       inventory access

       IN-HOUSE                     SmartengoTM              SmartengoTM               SmartengoTM               SmartengoTM
      DEVELOPED
       SOLUTION
                                     BEST FIT             RUNNING EXPERT                 INVENTORY               E-COMMERCE

                                    End of 2020,            Solution deployed           Solution deployed      Launched in September
                               25,000 tubes assembled      on over 13,000 tubes           with success                 2020
     DEPLOYMENT
       STATUS

Vallourec - Investor presentation                                                                                                       15
2
    SUPPORTIVE MEDIUM-TERM TRENDS IN OUR
    CORE MARKET

                                           16
SUPPORTIVE MID-TERM TRENDS IN OUR CORE O&G
            MARKET BASED ON CLEAR FUNDAMENTALS

    Global oil demand returning to    GLOBAL OIL DEMAND
                                      In mb/d
      pre-crisis level of 100mb/d
                                      110

                                      105

                                      100
           Stock drawdown and
                                       95
           Natural field depletion
                                       90
                            =          85
                                                 2019           2020           2021e          2022e           2023e           2024e           2025e           2026e
        E&P capex recovering          Source: International Energy Agency – Market Report Serie - Oil 2021 – March 2021

      especially in Vallourec’s key
                                      DEPLETION RATE
                regions:
                     Middle-East                             Natural                 Observed                             Natural Decline Rate is the production
                                                           decline rate             decline rate                          evolution if no investment is made, either to
                        Brazil                                                                                            bring new field onstream or to enhance already
                                                                                                                          producing field output
                    United States                                                       - 3,5 %

                        China                                                                                             Observed Decline Rate is the annual
                                                            -9%à-8%                                                       decline in production if only investments to
                                                                                                                          enhance already producing fields output are
                                                                                                                          made, no new field is brought on.
                                        Source : World Energy Outlook 2020

Vallourec - Investor presentation     Source: World Energy Outlook -2020                                                                                                   17
MARKET TRENDS BY REGION

                 NORTH AMERICA                                      SOUTH AMERICA                                       EA-MEA

   Oil & Gas                                            Oil & Gas                                       Oil & Gas

   ►    2021 drilling activity recovery (+200 rigs in   ►   Offshore Brazil: Petrobras focusing its     ►   Strong impact of the crisis in 2020-2021
        the US from 08/2020) is expected to                 E&P CAPEX on the development of its
        continue in 2022 as inventories and drilled         core pre-salt projects. Exclusively high-   ►   Market recovery in volume expected to
        uncompleted wells (DUCs) decrease                   end premium                                     take place as from 2022 especially in
                                                        ►   Positive trends on PLP offshore projects        winning regions (Middle-East and East-
   ►    Drilling recovery limited by end user's                                                             Africa) as E&P Capex are released
                                                        ►   Guyana development offering additional
        capital discipline and drilling efficiencies
                                                            opportunities                               ►   Competition intensity keeping prices
   ►    Price recovery starting in 2021 supported       Industry                                            under pressure across EA-MEA
        by the balance of domestic supply/demand        ►   Brazilian Industry quickly recovering
        and raw materials surge
                                                        ►   Long-term moderate growth should be         Industry
   ►    Consolidation of competition and                    supported by competitiveness of the         ►   Industry market collapsed in 2020 but
        distribution                                        Brazilian industry                              following a V-shape recovery in 2021
                                                        Mine
   ►    Welded pipe capacity reduction positively                                                       ►   Forecast of a moderate growth after
                                                        ►   Start-up of a new iron ore treatment line
        impacts seamless share                                                                              restocking in 2021
                                                            by end of 2021
                                                        ►   Current favorable prices expected to
                                                            decrease gradually

Vallourec - Investor presentation                                                                                                                      18
3
    ACTIVATE ADDITIONAL LEVERS
    OF VALUE CREATION

                                 19
EXPLOIT THE FULL POTENTIAL OF OUR MINE IN BRAZIL:
            NEW IRON ORE TREATMENT LINE BY THE END OF 2021

  ► A reference in terms                           ► Construction of a new iron ore
    of environment                                   treatment line with a production
                                                     startup end-2021
  ► 7.9Mt produced in 2020
   (+26% versus 2019)                              ► Leading to total production capacity
                                                     of 8.7Mt/y as from 2022
  ► Best-in-class cost structure
                                                   ► Payback estimated at c.2.5 years

Vallourec - Investor presentation                                                           20
INNOVATING IN LOW CARBON ENERGY SOLUTIONS TO
            SEIZE ENERGY TRANSITION GROWTH OPPORTUNITIES
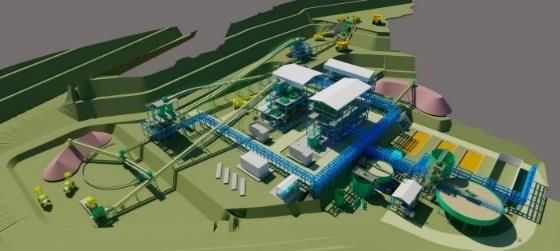
                                         WIND
    GEOTHERMAL                                                              CCUS                        HYDROGEN                             SOLAR
                                       OFFSHORE
                                                                                                                                      Provide optimized tubular
                                                                      Contribute to the safe                                              structures capable of
  Adapting Oil & Gas expertise                                                                             Providing tubular
                                                                          deployment                                                  supporting solar panels for
      to support the growth                                                                                  solutions for
                                                                     of CCUS infrastructure                                            large-scale structures such
    of our geothermal clients        Providing secondary steel                                            hydrogen projects
   in demanding environments          structures foundations                                         – transportation, distribution        as parking lots shade
                                                                      Vallourec’s line pipes
  (corrosion, high temperature)       for wind turbine as well                                        and storage – that require        structures and agricultural
                                                                      allow for safe transport                                            and industrial hangars
                                         as tubular structures                                      a high level of water tightness
                                                                       of CO2 and its OCTG
                                       for jackets and for wind                                        and corrosion resistance
                                                                      products are suitable
  VAM®21 connection and the          turbine installation vessels                                                                     Supplied Vertsun with MSH
                                                                          for injecting CO2
      THERMOCASE® VIT                         and cranes                                                                                structural hollow sections
                                                                            underground
  installed as part of the closed-                                                                   Involved in the HyStorIES         combined with the Preon®
     loop geothermal project           Development Phase                                                      Project                    box design tool to build
                                                                     Several contracts signed
   (GreenloopTM) developed by                                                                                                             agricultural hangars
                                                                    for projects in Qatar and the
        GreenFire Energy                                                                                                               without internal support
                                                                              North Sea
                                                                                                                                                columns

Vallourec - Investor presentation                                                                                                                                     21
A LEANER FINANCIAL STRUCTURE TO

4   EXECUTE OUR STRATEGIC PLAN

                                      22
A LEANER FINANCIAL STRUCTURE TO EXECUTE OUR
                   STRATEGIC PLAN

                                                                              DEBT                                                            SUITABLE NET LEVERAGE

                                                                     €1.8bn1                                                                                 c.1.6 x          2

                                                                          reduction                                                                  2020A Proforma
                                                                                                                                                  €1.8bn debt reduction
                                                    After rights issue, reserved share capital
                                                                     increase
                                                                 and debt write-off

                                                              FINANCIAL CHARGES                                                                       Normative CAPEX

                                                               c.€110m/yr                                                                          < €200m/yr
                                                                         reduction

                                                     on a FY basis resulting from new debt                                             Thanks to a state-of-art industrial footprint
                                                   structure and the termination of the DBOT
                                                 lease contract (c.€20m reduction in financial
                                                                    charges)

1   Slightly more than 50% of Vallourec S.A.’s €3.5bn debt principal amount
2 Net   leverage calculated on the basis of the following ratio as of December 31, 2020: net debt (at 2,214 million euros) to which is applied debt reduction (1.8 billion euros) divided by EBITDA (equal to 258 million euros)

Vallourec - Investor presentation                                                                                                                                                                                                  23
4   2021 OUTLOOK

                   24
2021 GOOD DYNAMICS
                            NORTH AMERICA                                            EUROPE-AFRICA & MIDDLE EAST- ASIA
                                                                           ►   O&G: overall activity still strongly impacted by the pandemic
  ►    The OCTG market is showing a progressive improvement                    and prices/mix remaining under pressure; negative impact
       with higher prices and volumes                                          on revenue and margin from the sharp decline in deliveries of
                                                                               high alloy products; resuming tendering activity in 2021
                                                                               should translate into higher 2022 activity
                                                                           ►   Industry: recovery is underway and should continue having
                                                                               a positive impact on our activity

                            SOUTH AMERICA                                                          COST SAVINGS

                                                                           ►    Savings measures to enable the Group to continue to lower
  ►    O&G: deliveries expected to increase compared with 2020
                                                                                its cost base
  ►    Industry: overall level of activity expected to continue its
                                                                           ►    Strict cash control maintained, with a capex envelope of
       recovery
                                                                                c.€160m
  ►    Increased contribution expected from the iron ore mine,
       although prices should gradually decrease along the year

       FULL YEAR 2021               ➢ €350 to €400 million targeted EBITDA
         TARGETS                    ➢ (€340) to (€260) million targeted free cash flow
       UPGRADED ON                  ➢ New free cash flow objective includes a c.€65 million additional cash outflow, resulting from
         APRIL 30th                   exercising the repurchase option for the debt of the lease contract (DBOT) in Brazil.

Vallourec - Investor presentation                                                                                                              25
APPENDICES
Q1 2021 RESULTS

                  26
Q1 2021 KEY FIGURES

 VOLUMES (kt)                                        REVENUE (€m)

                                                                                                                                                      -5% at
                                                                            853                       -18%                                          constant FX
                   450              -20%                                                                                             702
                                             358

                Q1 2020                    Q1 2021                      Q1 2020                                                  Q1 2021

 EBITDA (€m)                                         FREE CASH FLOW (€m)

                                             80                           Q1 2020                                                Q1 2021
                                    +18%
                   68

                                                                                                                                    (62)1

                                                                                                          +€119m

                                                                            (181)
               Q1 2020                     Q1 2021   1. Due to the ongoing financial restructuring, financial interests on the RCF and the bonds were not cashed out
                                                        (some of them to be paid in cash on the Completion Date, and some of them to be partly reimbursed, partly
Vallourec - Investor presentation                       converted into capital and partly refinanced included in the debt and equitization)                            27
Q1 2021 REVENUE BY MARKET

                Oil & Gas                                                                                                                                                      Industry and Other
                -34% YoY (-26%1)                                                                                                                                               +32% YoY (+61%1)
                                                                                                       Q1 2021 revenue
                                                                                                               in million €                                        ► Europe:
   ► North America:                                                                                       and as a % of revenue
        •    Lower deliveries and prices compared to                                                                                                                    •      Industry revenue up, driven by higher
             Q1 2020                                                                                                                                                           volumes

                                                                                                                                                                   ► South America:
   ► EA-MEA:                                                                                                                                                            •      Revenue increase, on account of higher
        •    Revenue decrease mainly due to lower                                                                                                                              revenue from the iron ore mine reflecting
             volumes                                                                         364                                                                               both higher prices and volumes which
                                                                                             52%                                                255                            reached 1.9Mt (up 28% versus Q1 2020),
   ► South America:
        •    Revenue increase reflecting higher volume
                                                                                                                   702                          36%                            as well as of higher sales in the Industry
                                                                                                                                                                               market driven by increased volumes and
                                                                                                                                                                               prices, despite an unfavorable currency
             and price/mix, despite an unfavorable
                                                                                                                                                                               conversion effect
             currency conversion effect

                                                                                                                          46        37
                Petrochemicals                                                                                                                                                 Power Generation
                                                                                                                          7%        5%
                -24% YoY (-15%1)                                                                                                                                               -22% YoY (-19%1)

   ► Lower deliveries in North America and EA-                                                                                                                          •      Revenue decrease reflecting the closure of
        MEA                                                                                                                                                                    the Reisholz facility mid 2020

 Note:
 1. At constant exchange rates
 Due to rounding, numbers presented throughout this document may not add up precisely to the totals provided and percentages may not precisely reflect the absolute figures.

Vallourec - Investor presentation                                                                                                                                                                                           28
Q1 2021 REVENUE BRIDGE AND EBITDA

  Q1 2020 – Q1 2021 REVENUE BRIDGE (€m)
                                                                                     ► Revenue decrease by 18% YoY (-5% at constant
                                                                                       exchange rates)
                                                                                      •   -20% volume impact mainly driven by Oil & Gas in North
                                                                                          America and, to a lesser extent, in EA-MEA, while Industry &
                                                                                          Other volume were up both in Europe and Brazil
                                                                                      •   +15% price/mix effect reflecting a better price/mix in South
                                                                                          America and the higher contribution of our iron ore mine
                                                                                      •   -13% currency conversion effect mainly related to EUR/BRL

  In € million                              Q1 2021   Q1 2020   Change     Q4 2020
                                                                                     ► EBITDA at €80m, up 18% YoY, with margin up 3.4p.p.
  Revenue                                      702       853     -17.7%       830
                                                                                       at 11.4%
  Cost of sales                               (534)     (692)    -22.8%      (674)
                                                                                      •   Industrial margin of €168m, slightly up YoY and up 5.1p.p. to
  Industrial Margin                            168       161       4.3%       157
                                                                                          23.9% of revenue, reflecting:
  (as a % of revenue)                        23.9%     18.9%    +5.1p.p.    18.9%
                                                                                           »   the higher mine contribution, combined with results from
  Sales, general and administrative costs      (77)      (90)    -14.4%       (75)             savings initiatives launched across the Group
  (as a % of revenue), Group share           -11.0%    -10.6%   -0.4p.p.     -9.0%         »   more than offsetting the impact of the decrease in Oil & Gas
  Other                                        (11)       (3)        na        (6)             activity in EA-MEA and in North America
  EBITDA                                        80        68     +€12m         76
  (as a % of revenue)                        11.4%      8.0%    +3.4p.p.     9.2%     •   SG&A costs reduced by 14% reflecting cost savings

Vallourec - Investor presentation                                                                                                                             29
Q1 EBITDA TO NET INCOME

  In € million                                                    Q1 2021          Q1 2020          Change          Q4 2020      ► At €27m, operating result was positive versus a
  EBITDA                                                                  80               68        +€12m                 76      (€29)m loss in Q1 2020, reflecting:
  (as a % of revenue)                                                11.4%             8.0%         +3.4p.p.            9.2%       •   Higher EBITDA
  Depreciation of industrial assets                                     (43)             (59)        -27.1%              (55)      •   Limited restructuring charges
  Amortization and other depreciation                                    (9)             (14)              na            (17)      •   Lower depreciation and amortization
  Impairment of assets                                                      -                -             na           (409)
  Asset disposals, restructuring costs and non-
                                                                                                                                 ► Financial result at (€82)m versus (€35)m in Q1 2020
                                                                         (1)             (24)              na            (90)
  recurring items                                                                                                                  •   Stable net interest expenses
  Operating income (loss)                                                 27             (29)        +€56m              (495)      •   Accelerated amortization of existing bonds costs for
                                                                                                                                       (€16)m and debt restructuring fees incurred to date for
  Financial income/(loss)                                               (82)             (35)         -€47m              (48)
                                                                                                                                       (€7)m
  Pre-tax income (loss)                                                 (55)             (64)          +€9m             (543)      •   Q1 2020 was positively impacted by the settlement of a
  Income tax                                                            (40)             (20)              na            (45)          dispute in Brazil for €26m
  Share in net income/(loss) of equity affiliates                        (3)              (1)              na              (1)
  Net income                                                            (98)             (85)         -€13m             (589)    ► Income tax amounting to (€40)m mainly related to
  Attributable to non-controlling interests                              (5)             (11)              na            (19)      activities in Brazil
  Net income, Group share                                               (93)             (74)         -€19m             (570)
  Net earnings per share                                               (8.2)            (0.2)              na           (49.8)   ► Net loss, Group share, at (€93)m
  * Q1 2021 & Q4 2020 figures impacted by new number of shares following reverse stock split effective on May 25 2020

Vallourec - Investor presentation                                                                                                                                                                30
Q1 2021 WORKING CAPITAL REQUIREMENT

 QUARTERLY NET WORKING CAPITAL REQUIREMENT IN DAYS1
 Number of days

     Annual                                               133
    Quarterly
                                                                                                   112                                        113                                                                           108
    Average                                                                                                                                                                              106

     Period        Q1.16       Q2.16 Q3.16 Q4.16 Q1.17 Q2.17 Q3.17 Q4.17 Q1.18 Q2.18 Q3.18 Q4.18 Q1.19 Q2.19 Q3.19 Q4.19 Q1.20 Q2.20 Q3.20 Q4.20                                                                                  Q1.21
  Annualized
   quarterly        2,684      3,052     2,772      3,351      3,132     3,732      3,856     4,280      3,449      3,928     3,844      4,464      4,100     4,336 4,240 4,016 3,412                   3,368   2,864   3,320     2,808
  sales (€m)
  Net WCR1
    (€m)
                    1,098      1,114     1,028      1,051      1,206     1,165      1,169       990      1,147      1,222     1,310      1,152      1,316     1,279 1,220 1,046 1,114                   1,060   943     706       803

   ► Net working capital requirement at 104 days of sales, down from 119 days in Q1 2020

 Note:
 1. Net WCR defined as trade receivables plus inventories minus trade payables, net of provisions for inventories and trade recei vables; net WCR days are computed on an annualized quarterly sales basis

Vallourec - Investor presentation                                                                                                                                                                                                         31
Q1 2021 FREE CASH FLOW
 ► Free cash flow in Q1 2021 of €(62)m versus €(181)m in Q1 2020

                                                                                                                                                                1► €13m cash flow from operating activities
                                                                                                                                                                       in Q1 2021 versus (€31)m in Q1 2020,
                                                                                                                                                                       reflecting the EBITDA increase and the
                                                                                                                                                                       freeze of payment of financial interest
           In € million                                                        Q1 2021            Q1 2020             Change             Q4 2020
                                                                                                                                                                       under the safeguard proceeding opened
                                                                                                                                                                       on February 4th (for €44m), partly offset
  1       Cash flow from operating activities (A)                                      13               (31)           +€44m                   (18)
                                                                                                                                                                       by the non-recurring positive effect in Q1
                                                                                                                                                                       2020 of the settlement of a dispute in
  2       Change in operating WCR [+ decrease,
                                                                                     (47)             (119)            +€72m                   178                     Brazil (for €26m)
          (increase)] (B)

                                                                                                                                                                2► Operating WCR increase by €47m in Q1
  3       Gross capital expenditure (C)                                              (28)               (31)             +€3m                  (48)                    2021, vs a €119m increase in Q1 2020,
                                                                                                                                                                       including NSC’s payment of its residual
          Free cash flow (A)+(B)+(C)                                                 (62)             (181)           +€119m                   112                     fixed costs coverage obligation following
                                                                                                                                                                       the sale of its share in VSB in Brazil for
                                                                                                                                                                       €34m

                                                                                                                                                                3► Capex in line with usual calendarization

 Notes:
 1. Operating WCR includes WCR as well as other operating liabilities and receivables
 2. Free cash flow (FCF) is a non-GAAP measure and is defined as cash flow from operating activities minus gross capital expenditure and plus/minus change in operating working capital requirement

Vallourec - Investor presentation                                                                                                                                                                                   32
NET DEBT AND LIQUIDITY

 Q4 2020 – Q1 2021 NET DEBT BRIDGE
 €m
                                                                                  Net Debt     ► €2,364m net financial debt as
     Net Debt                                                                       as at
       as at                                                                      March 31st     at March 31st 2021:
   Dec 31st 2020                                                                    2021          • Free cash flow of (€62)m
                                                                                                  • Asset disposals & other items for
                                                                                                    (€89)m, reflecting mainly accrued
                                                                                                    interests related to the financial
                                                                                                    restructuring for (€44)m, the
                                                                                                    accelerated amortization of
                                                                                                    existing bonds costs for (€16)m,
                                                                                                    the last reimbursement of NSC
                                      (€62)m free cash-flow
                                                                                                    shareholder loan to VSB for
                        Cash Flow           Change                    Asset
                                                                                                    (€9)m and the acquisition of NSC
                         from Op.            in op.                 disposals                       shares in VSB for (€7)m
                         Activities          WCR          Capex   & other items
                                                                                               ► Cash position at €1,242m as at
                                                                                                 March 31st 2021

Vallourec - Investor presentation                                                                                                        33
Q1 2021 REVENUE BRIDGES
 Q1 2020 – Q1 2021 REVENUE BRIDGE PER MARKET (€m)

 Q1 2020 – Q1 2021 REVENUE BRIDGE BY GEOGRAPHY

 Due to rounding, numbers presented throughout this document may not add up precisely to the totals provided and percentages may not precisely reflect the absolute figures.
Vallourec - Investor presentation                                                                                                                                              34
BALANCE SHEET AS AT MARCH 31, 2021
    In € million
    Assets                                  3/31/2021   12/31/2020 Liabilities                                 3/31/2021   12/31/2020
                                                                   Equity - Group share *                         (200)        (187)
                                                                   Non-controlling interests                        238          321
    Net intangible assets                        47            50 Total equity                                       38          134
    Goodwill                                     24            25 Shareholder loan                                    -            9
    Net property, plant and equipment         1,694         1,718 Bank loans and other borrowings (A)                9        1,751
    Biological assets                            32            30 Lease debt (D)                                    78           84
    Equity affiliates                            40            42 Employee benefit commitments                     182          203
    Other non-current assets                    130           128 Deferred taxes                                    16           20
    Deferred taxes                              180           187 Provisions and other long-term liabilities       148          142
    Total non-current assets                  2,147         2,180 Total non-current liabilities                    433        2,200
    Inventories                                 720           664 Provisions                                        69          104
                                                                  Overdraft and other short-term
    Trade and other receivables                 539           468                                                3,597        1,853
                                                                  borrowings (B)
    Derivatives - assets                         11            37 Lease debt (E)                                    25           24
    Other current assets                        209           203 Trade payables                                   456          426
                                                                  Derivatives - liabilities                         12           21
    Cash and cash equivalents (C)             1,242         1,390
                                                                  Other current liabilities                        291          241
    Total current assets                      2,721         2,762 Total current liabilities                      4,450        2,669
    Assets held for sale and discontinued                         Liabilities held for sale and discontinued
                                                 92           107                                                   39           37
    operations                                                    operations
    Total assets                              4,960         5,049 Total equity and liabilities                   4,960        5,049

    Net debt (A+B+C)                          2,364         2,214 * Net income (loss), Group share                 (93)      (1,206)

    Lease debt (D+E)                            103           108

Vallourec - Investor presentation                                                                                                       35
GROSS INDEBTEDNESS AS AT MARCH 31, 2021

                   In € million                                           3/31/2021
                  Private placement – maturing in August 2027                   55
                  Bond issue – maturing in September 2024                      500
                  Non-convertible bond issue – maturing in October 2022        550
                  Convertible bond issue – maturing in October 2022            249
                  Bond issue – maturing in October 2023                        400
                  RCF drawings                                               1,712
                  ACC ACE                                                       46
                  Other                                                         94
                  TOTAL GROSS FINANCIAL INDEBTEDNESS                         3,606

Vallourec - Investor presentation                                                     36
► Euronext Paris: ISIN code: FR0013506730,
  Ticker: VK
  USA: American Depositary Receipt (ADR) - ISIN
  code: US92023R4074, Ticker: VLOWY
► Investor Relations Contact - Vallourec Group
   •   Email: investor.relations@vallourec.com
   •   www.vallourec.com

                                                  37
You can also read