MUFG Americas Holdings Corporation - Investor Presentation for the Quarter Ended September 30, 2018 - Union Bank

Page created by Loretta Romero
 
CONTINUE READING
MUFG Americas Holdings Corporation - Investor Presentation for the Quarter Ended September 30, 2018 - Union Bank
MUFG Americas Holdings
                                     Corporation

                                     Investor Presentation for the Quarter Ended

                                     September 30, 2018

MUFG Americas Holdings Corporation
MUFG Americas Holdings Corporation - Investor Presentation for the Quarter Ended September 30, 2018 - Union Bank
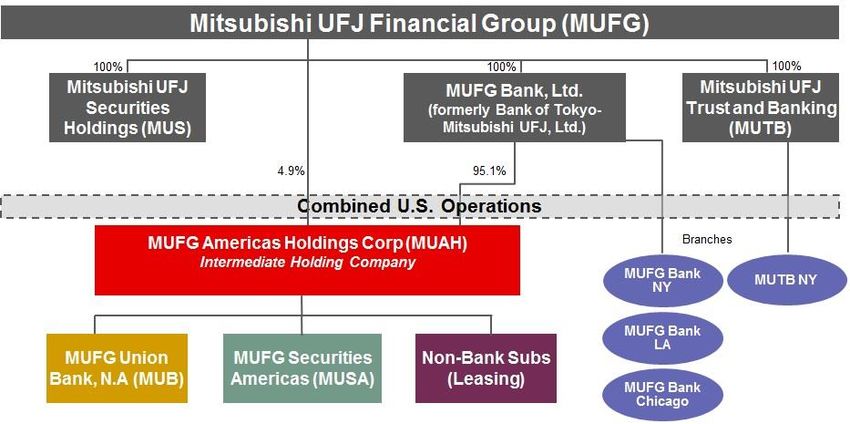
Forward-Looking Statements and Non-GAAP Financial Measures

This presentation describes activities of MUFG Americas Holdings Corporation and its consolidated subsidiaries (the Company) unless otherwise
specified. This presentation should be read in conjunction with the financial statements, notes and other information contained in the Company’s
most recent annual report on Form 10-K and Quarterly Reports on Forms 10-Q and in any subsequent filings with the Securities and Exchange
Commission (SEC).

The following appears in accordance with the Private Securities Litigation Reform Act. This presentation includes forward-looking statements that
involve risks and uncertainties. Forward-looking statements can be identified by the fact that they do not relate strictly to historical or current facts.
Often, they include the words “believe,” “continue,” “expect,” “target,” “anticipate,” “intend,” “plan,” “estimate,” “potential,” “ project,” or words of
similar meaning, or future or conditional verbs such as “will,” “would,” “should,” “could,” or “may.” They may also consist of annualized amounts
based on historical interim period results. There are numerous risks and uncertainties that could and will cause actual results to differ materially
from those discussed in the Company’s forward-looking statements. Many of these factors are beyond the Company’s ability to control or predict
and could have a material adverse effect on the Company’s financial condition, and results of operations or prospects. For more information about
factors that could cause actual results to differ materially from our expectations, refer to our reports filed with the SEC, including the discussions
under “Management’s Discussion & Analysis of Financial Condition and Results of Operations” and “Risk Factors” in the Company’s most recent
Annual Report on Form 10-K and Quarterly Reports on Forms 10-Q and in any subsequent filings with the SEC and available on the SEC’s website
at www.sec.gov. Any factor described above or in our SEC reports could, by itself or together with one or more other factors, adversely affect our
financial results and condition. All forward-looking statements contained herein are based on information available at the time of this presentation,
and the Company assumes no obligation to update any forward-looking statements.

This investor presentation includes additional capital ratios (tangible common equity and Common Equity Tier 1 capital (calculated under the Basel
III standardized approach on a fully phased-in basis) to facilitate the understanding of the Company’s capital structure and for use in assessing and
comparing the quality and composition of the Company's capital structure to other financial institutions. These presentations should not be viewed
as a substitute for results determined in accordance with GAAP, nor are they necessarily comparable to non-GAAP financial measures presented
by other companies. Please refer to our separate reconciliation of non-GAAP financial measures in our 10-Q for the quarter ended September 30,
2018.
                                                                                                MUFG Americas Holdings Corporation Investor Presentation, 3Q18   2
MUFG Americas Holdings Corporation - Investor Presentation for the Quarter Ended September 30, 2018 - Union Bank
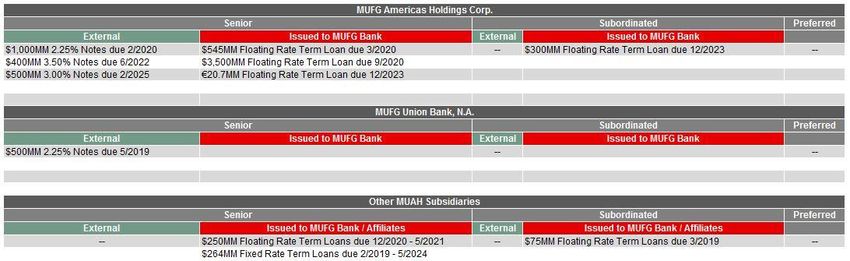
Core Strategic Subsidiary of Mitsubishi UFJ Financial Group (MUFG)
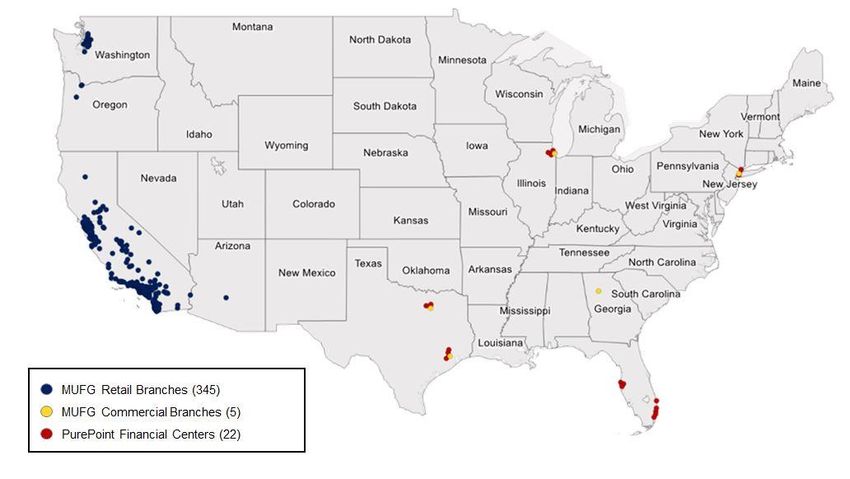
MUFG Americas Holdings Corporation (MUAH) and its principal                                                                                                   MUFG Branch / Financial Center Network
subsidiaries MUFG Union Bank, N.A. (MUB) and MUFG Securities
Americas (MUSA) are owned by MUFG Bank, Ltd. (formerly The Bank of
Tokyo-Mitsubishi UFJ, Ltd.) and Mitsubishi UFJ Financial Group, Inc.
(MUFG). MUFG Bank, Ltd. is a wholly-owned subsidiary of MUFG.

• One of the largest regional bank holding companies in the United States;

• Network of 350 U.S. branches; comprised of 345 full-service retail
  branches and 5 commercial branches

• Both MUB and MUAH have publicly issued debt securities outstanding

                                Reference Banks’ Period-End Assets ($bn) 1,2                                                                                 Company Profile as of September 30, 2018
                                                                                                                                                                                             MUAH                        MUFG3
                                                                                                                                               Headquarters                                  New York                    Tokyo

                                                                                                                                               Main Banking Office                           San Francisco               Tokyo

                                                                                                                                               Employees                                     Approx. 13,250              Approx. 151,550

                                                                                                                                               Total Assets                                  $161.0 billion              $2,706 billion4

                                                                                                                                               Total Loans Held for Investment               $83.7 billion               $980 billion4

                                                                                                                                               Total Deposits                                $87.8 billion               $1,589 billion4
                                                                                                                                               Common Equity Tier 1 risk-based
                                                                                                                                               capital ratio (fully-phased in) 16.58%5                                   12.36%6

                                                                                                                                               3. As of June 30, 2018; MUFG employees is as of March 30, 2018
1. Source: SNL Financial as of October 29, 2018                                                                                                4. JPY denominated amounts converted to USD based on an exchange rate of 110.54 JPY/USD; refer to
2. ‘Reference Banks’, referred to throughout this presentation unless otherwise noted, consist of these 13 CCAR-filing public regional banks   MUFG’s Investor Relations website (http://www.mufg.jp/english/ir/) for additional information
   plus the four largest U.S. money center banks (BAC, C, JPM and WFC) not shown here                                                          5. Non-GAAP financial measure. Refer to our separate reconciliation of non-GAAP financial measures in
                                                                                                                                               our 10-Q for the quarter ended September 30, 2018
                                                                                                                                               6. Calculated in accordance with Japanese banking regulations based on information derived from
                                                                                                                                               MUFG’s consolidated financial statements prepared in accordance with Japanese GAAP, as required by
                                                                                                                                               the Japanese Financial Services Agency

                                                                                                                                               MUFG Americas Holdings Corporation Investor Presentation, 3Q18                                      3
MUFG Americas Holdings Corporation - Investor Presentation for the Quarter Ended September 30, 2018 - Union Bank
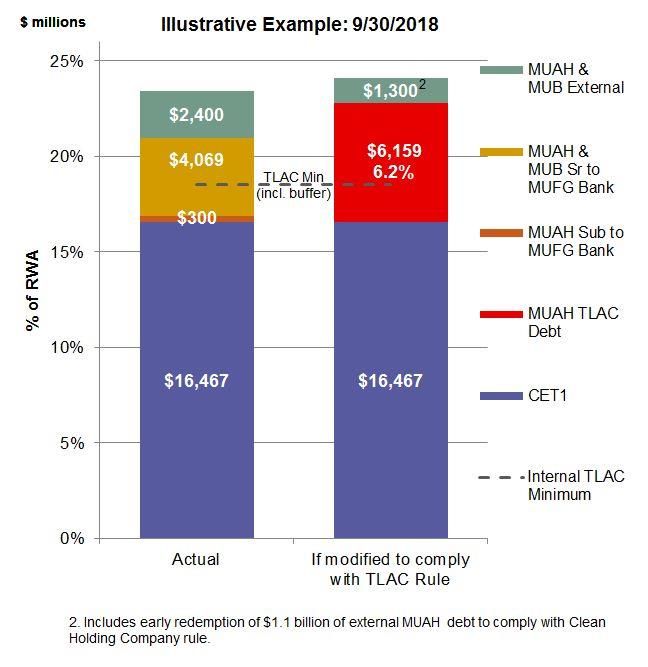
Strong U.S. Franchise

• One of the largest regional bank holding companies in the United States with total assets of $161 billion; subsidiary of
  MUFG, one of the world’s largest financial organizations with $2.7 trillion in assets

• Strong regional network of 345 Union Bank branches primarily in demographically attractive West Coast market with
  prominent market share along with 5 commercial branches plus a direct national banking platform (PurePoint Financial)
      ◦ Deposit franchise reduces reliance on wholesale funding

• Strong local management team with a majority of independent board members – new business plans include key
  initiatives, including PurePoint, unsecured consumer lending as well as Commercial and Industrial growth plans

• Conservative risk culture with a high quality loan portfolio with strong credit performance – non-performing assets and
  net charge-offs consistently below peer set

• Strongly capitalized, with Tier 1 risk-based capital ratio of 16.58% (vs. 11.84% for core peer set)

• Strong liquidity position and favorable credit ratings; MUAH, MUB and MUSA carry solid credit ratings and benefit from
  ownership by MUFG, one of the world’s largest financial organizations
                                                                            MUFG Americas Holdings Corporation Investor Presentation, 3Q18   4
MUFG Americas Holdings Corporation - Investor Presentation for the Quarter Ended September 30, 2018 - Union Bank
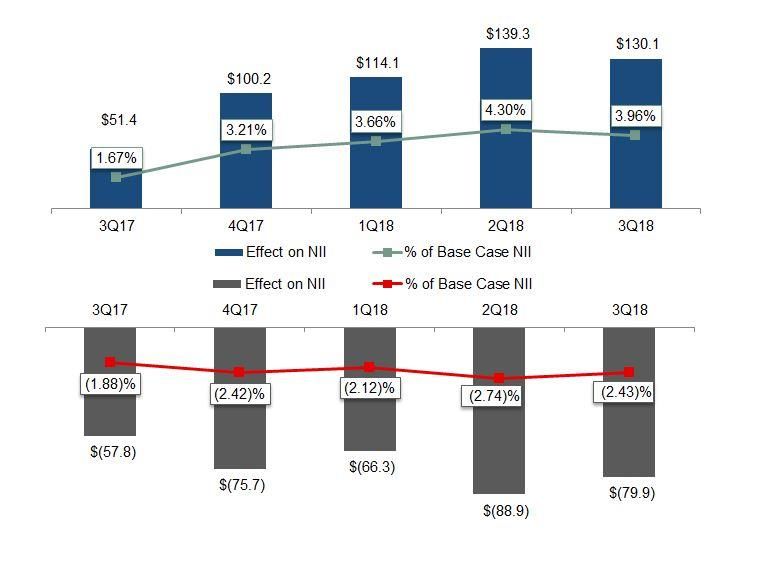
MUAH is MUFG's Intermediate Holding Company

                    9/30/18 assets: $124.0bn   9/30/18 assets: $33.4bn   9/30/18 assets: $3.6bn1

  The enhanced prudential standards require that all foreign banking organizations with at least $50 billion in assets hold
  ownership of controlled U.S. subsidiaries through an Intermediate Holding Company (IHC).

1. Net of intercompany eliminations

                                                                                       MUFG Americas Holdings Corporation Investor Presentation, 3Q18   5
MUFG Americas Holdings Corporation - Investor Presentation for the Quarter Ended September 30, 2018 - Union Bank
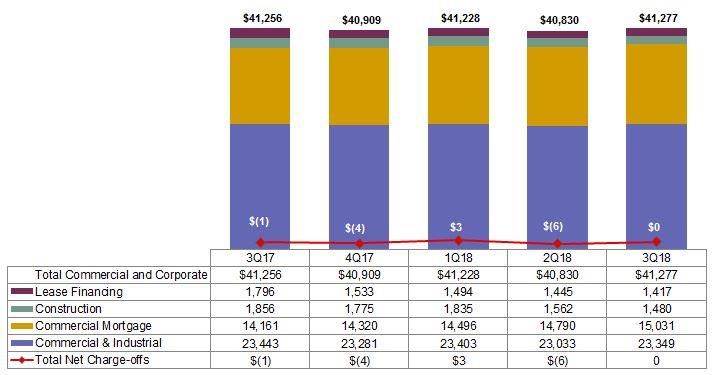
MUFG's Journey in the Americas

                WHOLESALE BANK DEVELOPMENT
                                                                                INTEGRATION OF BANK & BRANCH
                                                                                      COVERAGE MODELS
                         REGIONAL BANK ACQUISTIONS

  MUFG Bank U.S. BRANCHES: 130+ years of history in the U.S.
                                                                                                      PROFITABILITY IMPROVEMENT
 Formation of     Loan Marketing                     Product Expansion:                                 & SUSTAINABLE GROWTH
                                     Vertical
 Corporate &       Joint Venture                       Public Finance,
                                     Industry
  Investment        Established                       Global Financial               New U.S. CEO
                                      Focus
    Banking                                           Solutions, Stable           Stephen Cummings
                                                            Value
                                                                                                               MUAH as Intermediate
                                                                                                                 Holding Company
                                                                                                              Consolidates MUFG U.S.
                                                                                                               Subsidiaries, including
                                                                                                             MUFG Securities Americas
                                                                                                               (EPS Implementation)

                                                                                          Formation of
  Became a                                                                               Regional Bank
wholly owned                                                                              under Single
subsidiary of                               ~$6B Assets                                    Leadership
                      ~$600M Assets                                                                                                                 Announced
 MUFG Bank                                                 ~$550M Deposits                                                                         Acquisition of
                                                                                Integration of                                                        Intrepid
                                                                              MUFG Bank’s U.S.                                                      Investment
                       ~$3B Assets         ~$1B Deposits    ~$3.5B Assets
                                                                             Banking Operations                                                       Bankers
                UBOC Name                                                        under MUFG
                Changed to                                                    Americas Holdings
                                                                             Corp (MUAH) / MUFG
                                                                                 Union Bank
         UNION BANK: 150+ years of history in California
                                                                                           MUFG Americas Holdings Corporation Investor Presentation, 3Q18           6
MUFG Americas Holdings Corporation - Investor Presentation for the Quarter Ended September 30, 2018 - Union Bank
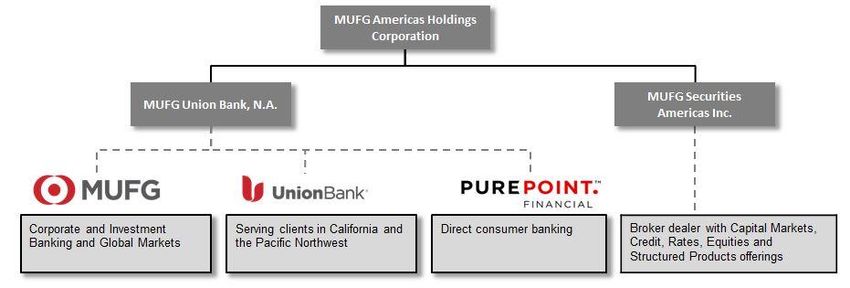
Business Model for Four Key Segments

                                              Regional Bank                                                           U.S. Wholesale & Investment Banking
Branding

           Five main divisions: Consumer Banking, Wealth Markets, Commercial Banking, Real Estate       •   Delivers the full suite of MUAH products and services to large and mid-sized
           Industries and PurePoint Financial                                                               corporate customers

           Two customer segments:                                                                       •   Employs an industry-focused strategy including dedicated coverage teams in:
           Consumer: West Coast individuals, including high net worth                                            • General Industries
           • Products and services include checking and deposit accounts, mortgages, home equity                 • Power and Utilities
              loans, consumer loans, credit cards, bill and loan payment services, merchant services,            • Oil and Gas
              wealth planning, trust & estate services, investment management, brokerage and private             • Telecom and Media
Coverage

              wealth management                                                                                  • Technology
           • PurePoint serves consumers by offering savings accounts and CD products online with                 • Healthcare and Nonprofit
              services provided through a call center and a network of financial centers in New York,            • Public Finance
              Florida, Illinois, and Texas                                                                       • Financial Institutions (predominantly Insurance and Asset Managers)

           Commercial: Institutional clients and businesses with annual revenues up to $1 billion       •   Provides customers general corporate credit and structured credit services including
           • Commercial credit products and services include commercial and asset-based loans,              project finance, leasing and equipment finance, commercial finance, funds finance,
             accounts receivable, inventory, and trade financing primarily to West Coast corporate          and securitizations
             customers, and construction loans, commercial mortgages, bridge financing and
             unsecured funding to professional real estate investors and developers nationwide
           • Non-credit products and services include global treasury management, capital market        •   Non-credit products and services include global treasury management, capital
             solutions, foreign exchange, interest rate risk and commodity risk management products         market solutions, and various foreign exchange, interest rate risk and commodity risk
             and services                                                                                   management products

                                                                                  Transaction Banking
                                                                                                                                         •          Payables /
                                                                                  •        Demand Deposit Account
                                 •    Automated Clearing House                                                                                      Receivables
                                                                                  •        Institutional Trust and Global
                                 •                                                                                                       •
Products

                                      Cash Management                                                                                               Treasury
                                                                                           Custody
                                 •    Commercial Card                                                                                               Management
                                                                                  •        Money Market Demand Account
                                                                                                                                         •          Trade Finance

                                                                       MUFG Securities Americas (MUSA)
                                                                                                                  •          Private Placements
                                          •    Capital Markets
                                                                                                                  •          Sales & Trading
                                          •    Collateralized Financings
                                                                                                                  •          Securities Borrowed and
                                          •    Domestic and Foreign Debt                                                     Loaned
                                                    and Equity Securities Transactions                            •          Securitization
                                                                                                                 MUFG Americas Holdings Corporation Investor Presentation, 3Q18                7
MUFG Americas Holdings Corporation - Investor Presentation for the Quarter Ended September 30, 2018 - Union Bank
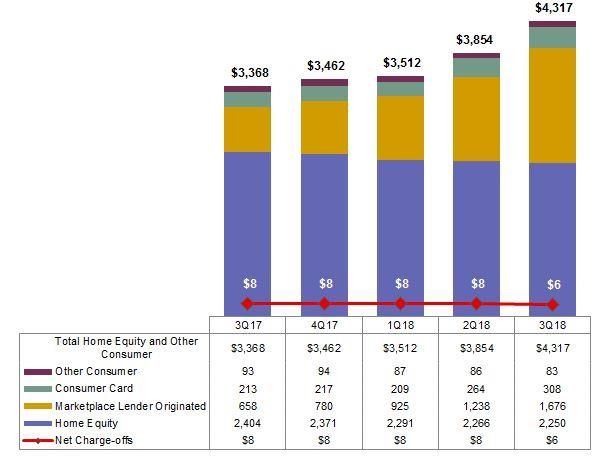
MUFG Americas Holdings Corporation - Strategic Plan

                                                  I. Global Priorities
                  Customer and             Digital                       Productivity                    MUFG Group
                 Business Driven      Transformation                   Improvements                     Reorganization
                   Approach

                                        II. Vision for MUFG Americas
Strongly                              Returns Focus & Sustainable Growth
Aligned                            III.Closing
                                        Americas
                                               GapsStrategic Imperatives
                                                    To Our Cost of Capital
                Seamless & Efficient Delivery of Solutions Across Legal Entities and Our Regions
                            Strengthen Risk Management Compliance & Controls

                                      III. Americas Strategic Imperatives
                   Profitability      Deepening Customer                                                           Scale
                         ---             Relationships                  Target (Balanced)                            ---
                Capital & Liquidity            ---                        Business Mix                           Customer
                  Optimization           Fee Revenues                                                           Acquisition

           Expense Management
                                                                                                             Strong Foundation &
                    ---                       Risk Appetite Optimization
                                                                                                                Infrastructure
                Efficiency

                                      - Top Strategic Initiatives Prioritized   -
                                                                        MUFG Americas Holdings Corporation Investor Presentation, 3Q18   8
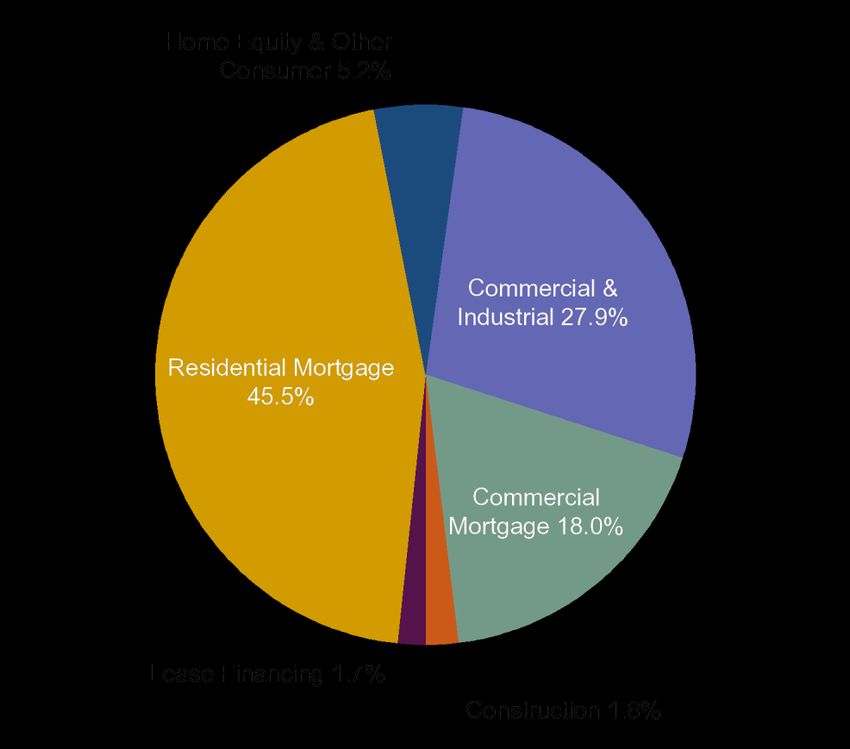
MUFG Americas Holdings Corporation - Investor Presentation for the Quarter Ended September 30, 2018 - Union Bank
Key Initiatives

                                      Initiatives to Improve Revenues
                      Scaled USD deposit balance and launched 22 financial centers

    PurePoint
     Direct
    Banking

    Mortgage
    Servicing         Enhance non-interest income from servicing business by MSR purchases
  Rights (MSR)

   Commercial
                    · Deepen customer relationships and expand product suite, including originate to distribute model and equity
  and Industrial
                      margin lending
       (C&I)

                                      Initiatives to Improve Efficiency
   Resource
   & location         Redistribute part of workforce to a lower cost location and strong labor supply (Phoenix, AZ)
    strategy

    IT services
                    · Create a technology platform that is resilient, flexible, and agile; improve service model by
  transformation
                      process re-engineering
 & cost reduction

                                                                            MUFG Americas Holdings Corporation Investor Presentation, 3Q18   9
MUFG Americas Holdings Corporation - Investor Presentation for the Quarter Ended September 30, 2018 - Union Bank
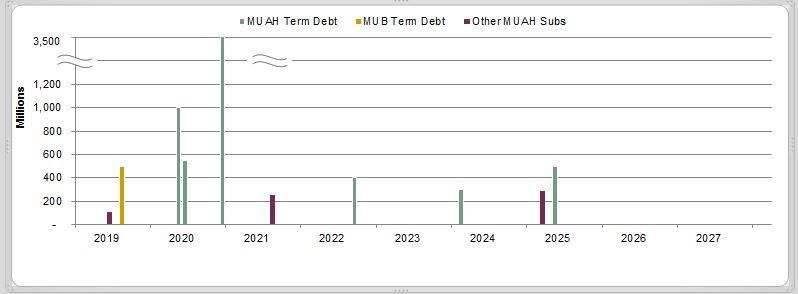
2018 Third Quarter MUAH Results

                                                                                                                                                              For the Three Months Ended
                                                                                                                                         September 30,                         June 30,                     September 30,
                             (Dollars in millions)                                                                                                2018                            2018                              2017
                             Results of operations:
                             Net interest income                                                                                           $                 832           $                  825            $                   816
                             Noninterest income                                                                                                              626                              596                                515
                             Total revenue                                                                                                                1,458                            1,421                              1,331
                             Noninterest expense                                                                                                          1,059                            1,083                                 982
                             Pre-tax, pre-provision income 1                                                                                                 399                              338                                349
                             (Reversal of) provision for credit losses                                                                                         64                              (19)                                18
                             Income before income taxes and including noncontrolling
                             interests                                                                                                                       335                              357                                331
                             Income tax expense (benefit)                                                                                                      35                               28                               109
                             Net income including noncontrolling interests                                                                                   300                              329                                222
                             Deduct: Net (income) loss from noncontrolling interests                                                                             6                              15                                 10
                             Net income attributable to MUAH                                                                               $                 306           $                  344            $                   232

    Compared with the third quarter of 2017, net income increased by $74 million

     •      Total revenue was $1.5 billion, up $127 million from the third quarter of 2017 due to a $111 million increase in noninterest
            income as a result of higher fees from affiliates partially driven by a change in the presentation of expenses beginning in 2018,
            and a $16 million increase in net interest income from an increase in earning assets.
     •      Increase in noninterest expense for the third quarter of 2018 compared with the third quarter of 2017 was driven largely by the
            change in presentation of certain expenses and an increase in salaries and employee benefits expense.
     •      The effective tax rates are lower in 2018 than the comparative prior year periods primarily as a result of the Tax Cuts and Jobs
            Act.

1. Pre-tax, pre-provision income is total revenue less noninterest expense. Management believes that this is a useful financial measure because it enables investors and others to assess the Company's ability to generate capital to cover credit
   losses through a credit cycle

                                                                                                                                                    MUFG Americas Holdings Corporation Investor Presentation, 3Q18                                    10
MUAH Balance Sheet and Profitability Highlights as of Period End

                                                                                                         As of Period End                                                   Compared to the previous quarter:
                                                                              September 30,                     June 30,                September 30,
                                                                                                                                                                          • Total assets increased $663
(Dollars in millions)                                                             2018                            2018                      2017
                                                                                                                                                                            million driven by increased loans
Balance sheet (end of period)                                                                                                                                               held for investment of $1.4 billion,
Total assets                                                                 $         161,036            $         160,373            $         154,852                    and securities of $1.4 billion, and
Total loans held for investment                                                         83,653                       82,236                       78,829                    offset by a decrease in trading
Total securities                                                                        28,397                       27,014                       28,457                    account assets and cash and
Securities borrowed or purchased under repo                                             21,265                       20,048                       21,891                    cash equivalents.
Trading account assets                                                                  11,213                       12,320                       10,223
Total deposits                                                                          87,811                       85,516                       85,349                  • Loans held for investment
Securities loaned or sold under repo                                                    27,032                       25,579                       27,307                    increased primarily due to growth
Long-term debt                                                                          12,796                       14,192                       11,419                    in the residential mortgage
Trading account liabilities                                                              4,029                        4,991                        3,338
                                                                                                                                                                            portfolio.
MUAH stockholders' equity                                                               18,742                       18,462                       18,459
Performance ratios                                                                                                                                                        • Total deposits increased $2.3
Net interest margin             1,2                                                          2.30%                        2.30%                        2.36%                billion largely due to time deposits
Return on average assets 1                                                                   0.68                         0.64                         0.67                 related to Consumer Banking and
Return on average MUAH stockholders'                                                                                                                                        PurePoint, partially offset by lower
equity 1                                                                                     5.92                         5.60                         5.64
                                                                                                                                                                            transaction and money market
Return on tangible common equity 1,4                                                         7.47                         7.09                         7.10
                                                                                                                                                                            accounts.
Efficiency ratio 3                                                                         78.93                        82.45                        75.57

 1.   Annualized
 2.   Net interest margin is presented on a taxable-equivalent basis using the federal statutory tax rates of 21% and 35% for 2018 and 2017, respectively
 3.   The efficiency ratio is total noninterest expense as a percentage of total revenue (net interest income and noninterest income)
 4.   Non-GAAP financial measure. Refer to our separate reconciliation of non-GAAP financial measures in our 10-Q for the quarter ended September 30, 2018

                                                                                                                                                MUFG Americas Holdings Corporation Investor Presentation, 3Q18     11
Strong and High Quality Capital Base

  MUAH's capital ratios exceed the average of the Reference Banks1

                                                                                                                          Reference
                                                                                                                           Banks'                        MUAH Capital Ratios
                                                                                                                          Average1
                                                                                                                      September 30, September 30,
                            Capital ratios:                                                                               2018          2018                                  June 30, 2018
                            Regulatory:
                            Common Equity Tier 1 risk-based capital ratio                                                         10.71%                     16.58%                       16.24%
                            Tier 1 risk-based capital ratio                                                                       11.84                      16.58                        16.24
                            Total risk-based capital ratio                                                                        13.92                      17.54                        17.15
                            Tier 1 leverage ratio                                                                                  9.64                      10.38                        10.28
                            Other:
                            Tangible common equity ratio2                                                                           8.25                       9.65                         9.51
                            Common Equity Tier 1 risk-based capital ratio
                            (U.S. Basel III standardized approach; fully                                                       N/A                           16.58                        16.24
                            phased-in)2

MUAH reports its regulatory capital ratios under the standardized approach of the U.S. Basel III rules, with certain
provisions subject to phase-in periods.

 1. Reference Banks consist of 13 CCAR-filing public regional banks depicted on slide 3 plus the four largest U.S. money center banks. Reference Banks’ average based on reporting through October 29, 2018 (Source: SNL Financial)
 2. Non-GAAP financial measures. Refer to our separate reconciliation of non-GAAP financial measures in our 10-Q for the quarter ended September 30, 2018

                                                                                                                                                MUFG Americas Holdings Corporation Investor Presentation, 3Q18                        12
MUAH's Capital, Asset Quality and Ratings Compare Favorably

   Common Equity Tier 1 (Basel 3) Ratio1                                                                                             Net Charge-offs / Average Loans1,2

     Nonperforming Assets / Total Loans1                                                                                              Reference Banks’ Credit Ratings1,3
                                                                                                                                                                  Holding Company Ratings                             Bank Ratings
                                                                                                                          Long-term ratings                    S&P        Moody's      Fitch                S&P        Moody's           Fitch
                                                                                                                          U.S. Bancorp                          A+          A1          AA-                 AA-           A1              AA-
                                                                                                                          Wells Fargo & Company                 A-          A2          A+                   A+          Aa2              AA-
                                                                                                                          MUAH                                  A-          A2           A                   A            A2               A
                                                                                                                          BB&T Corporation                      A-          A2          A+                   A            A1              A+
                                                                                                                          JPMorgan Chase & Co.                  A-          A2          AA-                  A+          Aa2              AA
                                                                                                                          PNC Financial Services                A-          A3          A+                   A            A2              A+
                                                                                                                          M&T Bank                              A-          A3           A                   A            A3               A
                                                                                                                          Comerica                             BBB+         A3           A                   A-           A3               A
                                                                                                                          Fifth Third Bancorp                  BBB+           Baa1           A-              A-           A3             A-
                                                                                                                          Bank of America Corp.                 A-             A3            A+              A+           Aa3            AA-
                                                                                                                          Citigroup Inc.                       BBB+           Baa1           A              A+             A1             A+
                                                                                                                          KeyCorp                              BBB+           Baa1           A-             A-             A3             A-
                                                                                                                          SunTrust Banks                       BBB+           Baa1           A-             A-            Baa1            A-
                                                                                                                          Citizens Financial Group             BBB+            NR           BBB+            A-            Baa1           BBB+
                                                                                                                          Huntington                           BBB+           Baa1           A-             A-             A3             A-
                                                                                                                          Capital One Financial Corp.          BBB            Baa1           A-            BBB+           Baa1            A-
                                                                                                                          Regions Financial Corp.              BBB+           Baa2          BBB+            A-            Baa2           BBB+
                                                                                                                          Zions Bancorporation                 BBB          (P)Baa3         BBB            BBB+           Baa3           BBB

1. Reference Banks consist of the 13 CCAR-filing public regional banks depicted on slide 3 plus the four largest U.S. money center banks. Reference Banks’ average based on reporting through October 29, 2018 (Source: SNL Financial)
2. Annualized
3. Ratings as of October 25, 2018                                                                                                                MUFG Americas Holdings Corporation Investor Presentation, 3Q18                                  13
Robust Liquidity Profile

                                                      MUB                                                                                                                          MUAH

Deposit franchise reduces reliance on wholesale funding                                                                         Holding company maintains liquidity to meet expected
Substantial available liquidity includes:                                                                                       obligations for at least 24 months without access to
                                                                                                                                funding
• Excess Reserves1: $2.3 billion
                                                                                                                                MUAH consolidated is compliant with modified LCR
• Unpledged securities: $24.8 billion
                                                                                                                                Double leverage ratio is 103%2
• Unused FHLB capacity: $19.9 billion

  MUB's Investment Portfolio, Carrying Value3 ($ billions)                                                                            MUAH Consolidated Funding Sources ($ billions)

1. Interest bearing deposits in banks
2. Source: MUAH FR Y-9LP as of June 30, 2018; defined as the Total Equity Investment in Subsidiaries divided by Total Equity. Management believes that this is a useful measure because it enables investors and others to assess the extent to
   which the Company is using debt to fund its equity investment in its subsidiaries
3. Amortized Cost / Carrying Amount reflects amortized cost except for balances transferred from AFS to HTM. Those balances reflect amortized cost plus any unrealized gains or losses at the date of transfer

                                                                                                                                                MUFG Americas Holdings Corporation Investor Presentation, 3Q18                                    14
Securities Financing Portfolio

                      Securities Financing Maturity Profile                                                                                Securities financing activity largely
                                                                                                                                           conducted through MUSA
                                                                                                                                           Securities financing portfolio is primarily
                                                                                                                                           collateralized by high quality, liquid assets
                                                                                                                                               • Approximately 87% is collateralized by
                                                                                                                                                 U.S. Treasuries and Agency MBS and
                                                                                                                                                 13% is backed by equities, credit and
                                                                                                                                                 other

                                                1
                                                                                                                                           Robust risk management framework
                                                                                                                                           governs secured financing profile including
                                                                                                                                           guidelines and limits for tenor gaps,
                  Assets                                                                        Liabilities                                counterparty concentration and stressed
                                                                                                                                           liquidity outflows

1. Includes continuous maturities which include open trades and term evergreen transactions that are primarily used to fund inventory
                                                                                                                                        MUFG Americas Holdings Corporation Investor Presentation, 3Q18   15
Internal TLAC1 Requirement to be Effective January 1, 2019

MUAH has sufficient aggregate capital and debt to achieve quantitative TLAC requirements; some modifications are required

TLAC-related implications to MUAH due to MUFG's
status as a single point of entry G-SIB are:
    • 18.5% of RWA overall Internal TLAC requirement;
           minimum 6% must be issued as eligible long-term debt

    •      Internal TLAC must be issued by MUAH to a foreign
           affiliate (MUFG Bank); internal TLAC instruments may
           not be issued to third party investors

    •      TLAC-eligible long-term debt will contain a contractual
           conversion ("bail-in") trigger while remaining external
           debt will not

    •      Clean Holding Company requirements limit MUAH's
           external liabilities including debt, derivatives and
           guarantees

    •      Compliance mandatory by January 1, 2019

MUFG is expected to be the external TLAC issuing entity
for the global organization
Note: MUAH is currently evaluating the impact of the NPR issued in
April 2018 by the Federal Reserve and OCC which is intended to
recalibrate the enhanced supplementary leverage ratio
1. "Total Loss-Absorbing Capacity, Long-Term Debt, and Clean Holding Company Requirements for Systemically Important U.S. Bank Holding Companies and Intermediate Holding Companies of Systemically Important
   Foreign Banking Organizations," Federal Register Vol. 82, No. 14, January 24, 2017; does not include FHLB balances                    MUFG Americas Holdings Corporation Investor Presentation, 3Q18         16
MUAH Long-Term Debt Outstanding and Maturity Schedule1

As of September 30, 2018

                                           2

                                       2

                                                                         Long-Term Debt Redemption Schedule - Next 10 Years

1. Excludes nonrecourse debt, junior subordinated debt, FHLB Loans and capital leases
2. Early full redemption of Senior Notes due 2020 and partial $100 million redemption of Senior Notes due 2025. Redemption date is November 8, 2018
                                                                                                                                               MUFG Americas Holdings Corporation Investor Presentation, 3Q18   17
Deposit Trends
         Average deposit balances have been steady over the last year

              Average Quarterly Deposit Breakdown ($ billions)3
                85                                           85

                                                                                                                                     •      PurePoint Financial, a division of MUFG
                                                                                                                                            Union Bank, N.A., is a hybrid digital bank
                                                                                                                                            aimed at committed savers

                                                                                                                                     •      PurePoint offers savings accounts and
                                                                                                                                            certificates of deposit (CDs), combining the
                                                                                                                                            convenience of online banking with in-
                                                                                                                                            person client service at PurePoint Financial
                                                                                                                                            Centers

                                                                                                                                     •      This model enables PurePoint to deliver
                          Major Deposit Share in Key California Locations1,2
                                                                                                                                            competitive rates and an exceptional client
        Metropolitan Statistical Area (MSA) / State                                           Rank             Share (%)
                                                                                                                                            experience the way clients want to bank -
        Santa Maria-Santa Barbara, CA                                                            2                 16.47
        San Diego-Carlsbad, CA                                                                   4                 12.42                    online, over the phone or in person
        Los Angeles-Long Beach-Anaheim, CA                                                       4                  8.15
        Fresno, CA                                                                               4                  7.54             •      As of September 30, 2018 PurePoint
        Oxnard-Thousand Oaks-Ventura, CA                                                         5                   5.7                    deposit balances were $5.2 billion
        Salinas, CA                                                                              5                    8.8
        Riverside-San Bernardino-Ontario, CA                                                     6                   4.0
        Sacramento--Roseville--Arden-Arcade, CA                                                  5                    4.4
                                                                                                                                     •      There are currently 22 PurePoint Financial
        San Francisco-Oakland-Hayward, CA                                                        7                  2.45                    centers
        Seattle-Tacoma-Bellevue, WA                                                             10                  1.79
        San Jose-Sunnyvale-Santa Clara, CA                                                      10                  2.17

        Overall California                                                                          4                    5.64
        Overall Washington                                                                        13                     1.28
1. Source: SNL Financial as of September 30, 2018; updated annually
2. The above balances do not include PurePoint deposits which are primarily placed with customers outside MUB's West Coast markets
3. Average quarterly balances may not total due to rounding                                                                              MUFG Americas Holdings Corporation Investor Presentation, 3Q18   18
Earning Asset Mix

MUB's loan portfolio is primarily residential mortgage and commercial; MUSA contributes trading and securities financing
assets.

                                                                                                                                                    Loan Portfolio Composition                                    2
                                 Earning Asset Mix 1

                                                                             Loans: 56.4%

1. Average balance for the quarter ended September 30, 2018. May not total 100% due to rounding
2. Period-end total loans held for investment, including all nonperforming loans and purchased credit-impaired loans. May not total 100% due to rounding
                                                                                                                                                 MUFG Americas Holdings Corporation Investor Presentation, 3Q18       19
Commercial Loan Portfolio

Commercial loan balance remains stable in 3Q2018 after recent declines in loan balances. Net charge-offs were also stable
quarter-over-quarter.

                               Commercial and Corporate Loan Portfolio
                                Period-end Loan Balances and Net Charge-offs ($mm)

                                                                         MUFG Americas Holdings Corporation Investor Presentation, 3Q18   20
Consumer Loan Portfolio

 Consumer portfolio continues to exhibit strong credit quality.

  Residential Mortgage Loan Portfolio                             Home Equity & Other Consumer Portfolio
Period-end Loan Balances and Net Charge-offs ($mm)                Period-end Loan Balances and Net Charge-offs ($mm)

                                                                         MUFG Americas Holdings Corporation Investor Presentation, 3Q18   21
Net Interest Margin Impacted by Low Rate Environment

Net interest margin decreased 10 basis points during the third quarter of 2018, compared with the same period in 2017.

Net Interest Income & Margin ($mm)                                                                                                                    Earning Assets ($bn)

                                                                                                                                                     $145                      $144                       $146     $146
                                                                                                                         $139                                                    $3                         $4      $4
                                                                                                                                                       $4
                                                                                                                          $2

                                                                                                1

                                             1                                                                                          2

1. Net interest margin is presented on a taxable-equivalent basis using the federal statutory tax rates of 21% and 35% for 2018 and 2017, respectively
2. Total loans held for investment
                                                                                                                                                  MUFG Americas Holdings Corporation Investor Presentation, 3Q18          22
Interest Rate Risk Management of Exposures Other Than Trading

                                                   Net Interest Income (NII) Sensitivity ($mm)

                                            +200
                                            bps
  Gradual parallel yield curve shift over
           12-month horizon

                                            -100
                                            bps

                                                                       MUFG Americas Holdings Corporation Investor Presentation, 3Q18   23
Asset Quality Trends

             Nonperforming Assets / Total Loans1                                                                                 Net Charge-offs (Recoveries) / Average Loans1,3

                                                                                                              2                                                                                                                                     2

     Criticized4 & Nonaccrual Loans / Total Loans                                                                                      Nonperforming Assets by Loan Type ($mm)

                                                                                                                                                     0.30%
                                                                                                                                                                   0.30%
                                                                                                                                                                                              0.25%         0.26%
                                                                                                                                                                                 0.22%

1.   Source: SNL Financial and company reports
2.   Reference Banks consist of 13 CCAR-filing public regional banks depicted on slide 3 plus the four largest U.S. money center banks. Reference Banks’ average based on reporting through October 29, 2018 (Source: SNL Financial)
3.   Annualized ratio
4.   Criticized loans held for investment reflect loans in the commercial portfolio segment that are monitored for credit quality based on regulatory ratings. Amounts exclude small business loans, which are monitored by business credit score
     and delinquency status
                                                                                                                                                         MUFG Americas Holdings Corporation Investor Presentation, 3Q18                                 24
Commercial Real Estate Overview

Largely secured, California-focused commercial real estate-purposed loans1 with strong credit performance

       Q3 2018 Property Type Breakdown                                                                                               Q3 2018 Geographic Distribution2

                                                                                                                                                                                          California
                                                                                                                                                                                            66%
                                             Secured 93%

                                                                 Commercial Real Estate Statistics
                                                                                                      September 30,                  December 31,                September 30,
                                      ($ MM)                                                              2017'                          2017                        2018
                                      Commitments                                                      $     21,101                    $    21,141                  $ 21,539
                                           Commercial and Industrial                                                    3,699                         3,540                      3,720
                                           Commercial Mortgage                                                         14,326                       14,529                      15,218
                                           Construction                                                                 3,077                         3,071                      2,602
                                      Outstandings                                                                   17,683                       17,714                      18,193
                                           Commercial and Industrial                                                    1,698                         1,645                      1,703
                                           Commercial Mortgage                                                         14,129                       14,294                      15,010
                                           Construction                                                                 1,857                         1,775                      1,480
                                      Nonperforming Loans                                                                   23                           21                          12
1. Commercial real estate-purposed loans are comprised of commercial mortgage loans, construction loans and C&I loans to borrowers with real estate-exposed businesses. Does not include CMBS in the investment or trading portfolios
2. Excludes loans not secured by real estate; subsets of California reported by Metropolitan Statistical Area (MSA); may not add to 100% due to rounding
                                                                                                                                              MUFG Americas Holdings Corporation Investor Presentation, 3Q18                            25
Consumer Loans Performed Well Through the Crisis

Residential Mortgage Performance Trends                                                                                              Home Equity and Other Consumer
                  (30 days Past Due + in Foreclosure)                                     3
                                                                                                                                    Total Delinquency (30 Days + Past Due) 3,4

Residential Mortgage Portfolio as of September 30, 2018:
• 36% interest-only (non-amortizing)
       • 65% weighted average LTV1 for the I/O portfolio
 • No subprime programs or option ARM loans
 • Low delinquency rate due to focus on prime loans, high FICO scores, and low LTVs
 • 82% of the consumer portfolio has a refreshed FICO score of 720 and above 2
 • 98% has an LTV less than or equal to 80%

1.   At origination
2.   Excluding loans serviced by third-party service providers and loans covered by FDIC loss share agreements, includes PCI loans
3.   Data Source: Consumer Lending Monthly Summary and Key Statistics; Source: Residential – Mortgage Bankers Association, Home Equity-American Bankers Association
4.   National (SA) is seasonally adjusted American Bankers Association data; Benchmark metrics are reported on a one quarter lag
                                                                                                                                          MUFG Americas Holdings Corporation Investor Presentation, 3Q18   26
Key MUFG Group Credit Ratings

                                           MUFG Union Bank, N.A.    MUFG Securities     MUFG Americas                         MUFG Bank, Ltd.                 Mitsubishi UFJ
                                                                     Americas Inc.    Holdings Corporation                                                 Financial Group, Inc.

                                          Deposits    Senior Debt     Senior Debt         Senior Debt                             Senior Debt                  Senior Debt
                                                                          —
                             Long-Term     Aa2            A2                                   A2                                      A1                          A1
    Moody’s
                             Short-Term    P-1            P-1             —                    —                                       P-1                         P-1

                             Long-Term      —             A*              A*                  A-*                                       A*                         A-*
    Standard &
    Poor’s                   Short-Term     —             A-1            A-1                  A-2                                      A-1                          —

                             Long-Term      A+             A              A                     A                                       A                           A
    Fitch
                             Short-Term     F1            F1              F1                   F1                                      F1                          F1

     - means not rated
     * outlook is positive

For all three rating agencies, strong capital and conservative asset quality offset MUAH’s low profitability and a
higher level of wholesale funding relative to peers.

•     On October 4, 2018, Moody's did an update to MUAH's credit opinion; MUAH and MUB's ratings and outlook
      remain unchanged.

•     On September 27, 2018, Fitch affirmed MUB, MUAH and MUSA's ratings. The outlook remains stable.

•     On April 16, 2018, S&P revised MUAH and MUB’s outlook to positive from stable. The change in outlook is
      followed by S&P’s revision to the MUFG Group’s outlook to positive from stable which was a result of S&P
      revising the outlook on Japan’s long-term sovereign rating as a result of healthier economic prospects to
      positive from stable.
                                                                                          MUFG Americas Holdings Corporation Investor Presentation, 3Q18                           27
2018 CCAR and 2018 Mid-Cycle DFAST Results

The Federal Reserve did not object to MUAH's 2018 Annual Capital Plan and proposed capital actions
In October 2018, MUAH submitted its Mid-Cycle DFAST results to the Federal Reserve

The Mid-Cycle DFAST stress test results demonstrate MUAH's capital cushion in excess of regulatory minimums

   •      The 2018 BHC Severely Adverse scenario is characterized by a growing U.S. deficit, U.S. corporate debt
          defaults, and technology sector weakness

                                               2018 Mid-Cycle Severely Adverse Scenario Results
         MUAH Actual and Projected Capital Ratios Using Dodd-Frank Capital Actions

                                                                        Actual                              Stressed Capital Ratios                                   Regulatory
                                                                     June 30, 2018                                                                                    Post-Stress
                                                                                              September 30, 2020                    Minimum1                          Minimums2
         Common Equity Tier 1 Capital Ratio                                         16.2%                         13.1%                             13.1%                           4.5%
         Tier 1 Risk-based Capital Ratio                                            16.2%                         13.1%                             13.1%                           6.0%
         Total Risk-based Capital Ratio                                             17.1%                         14.6%                             14.6%                           8.0%
         Tier 1 Leverage Ratio                                                      10.3%                          7.7%                               7.7%                          4.0%
         MUAH Actual and Projected Risk-Weighted Assets (RWA)
         ($ in billions)                                                       Actual – June 30, 2018                                  Projected – September 30, 2020
         Risk-Weighted Assets (Standardized)                                             $99.4                                                            $92.4

   1   Represents minimum projected capital ratio from 3Q18 through 3Q20
   2Minimum post-stress regulatory ratios as defined in the Comprehensive Capital Analysis and Review 2018 Summary Instructions for LISCC and Large and Complex Firms, February 1,
   2018
                                                                                                                  MUFG Americas Holdings Corporation Investor Presentation, 3Q18           28
Conclusion

MUAH, MUB and MUSA carry solid credit ratings and benefit from ownership by MUFG, one of the
world’s largest financial organizations
Strong local management team with a majority of independent board members
Solid balance sheet with high-quality capital base and strong liquidity
Conservative risk culture resulting in a high quality loan portfolio with historically strong credit
performance

There are many risks facing the banking industry and MUAH; please refer to Item 1A., Risk Factors, in
our 2017 Form 10-K and our September 30, 2018 10-Q

                                                   Contacts
            Alan Gulick                         Pawan Adhikari                                             Marcy Morita

        Managing Director                           Director                                                     Director

          425-423-7317                           415-765-4252                                              415-273-2452

   alan.gulick@unionbank.com            pawan.adhikari@unionbank.com                      marcy.morita@unionbank.com

                                                                    MUFG Americas Holdings Corporation Investor Presentation, 3Q18   29
Appendix
Reconciliation of Non - GAAP Measures - Adjusted Efficiency Ratio

                                                                               As of Period End

                                              September 30,       June 30,         March 31,             December 31,               September 30,
(Dollars in millions)                             2018              2018             2018                    2017                       2017

Noninterest expense (a)                       $      1,059    $       1,083    $          1,084         $            1,039         $                 982
Less: Costs associated with services
  provided to MUFG Bank, Ltd. branches in
  the U.S.                                            270               255                  241                        196                          197
Noninterest expense, as adjusted (b)          $       789     $         828    $             843        $               843        $                 785

Total revenue (c)                             $      1,458    $       1,421    $          1,207         $            1,317         $                1,331
Less: Fees from affiliates for services
  provided to MUFG Bank, Ltd.'s branches in
  the U.S.                                             292              278                 256                        210                            196
Less: Impact of TCJA                                    —                —                 (164)                       (24)                            —
Total revenue, as adjusted (d)                $      1,166    $       1,143    $          1,115         $            1,131         $                1,135

Efficiency ratio (a)/(c)                             72.59%           76.18%              89.84%                     78.95%                         73.78%
Adjusted efficiency ratio (b)/(d)                    67.61%           72.39%              75.64%                     74.60%                         69.16%

The adjusted efficiency ratio is a non-GAAP financial measure. Management believes adjusting the efficiency ratio for the fees and
costs associated with the provision of services to MUFG Bank, Ltd. branches in the U.S. enhances the comparability of MUAH's
efficiency ratio when compared with other financial institutions. Management believes adjusting revenue for the impact of the TCJA
enhances comparability between periods.

                                                                                   MUFG Americas Holdings Corporation Investor Presentation, 3Q18            31
You can also read