UBS Midstream, MLP and Utilities Conference - January 2019 - MPLX

 
CONTINUE READING
UBS Midstream, MLP and Utilities Conference - January 2019 - MPLX
UBS Midstream, MLP and
    Utilities Conference
                January 2019
UBS Midstream, MLP and Utilities Conference - January 2019 - MPLX
Forward‐Looking Statements
This presentation contains forward-looking statements within the meaning of federal securities laws regarding MPLX LP (MPLX). These forward-looking statements relate to, among other things, expectations, estimates and projections concerning the
business and operations, strategy and value creation plans of MPLX. In accordance with "safe harbor" provisions of the Private Securities Litigation Reform Act of 1995, these statements are accompanied by cautionary language identifying important
factors, though not necessarily all such factors, that could cause future outcomes to differ materially from those set forth in the forward-looking statements. You can identify forward-looking statements by words such as "anticipate," "believe," "could,"
"design," "estimate," "expect," "forecast," "goal," "guidance," "imply," "intend," "may," "objective," "opportunity," "outlook," "plan," "policy, " "position," "potential," "predict," "priority, " "project," "prospective," "pursue," "seek," "should," "strategy," "target,"
"would," "will" or other similar expressions that convey the uncertainty of future events or outcomes. Such forward-looking statements are not guarantees of future performance and are subject to risks, uncertainties and other factors, some of which are
beyond the company’s control and are difficult to predict. Factors that could cause MPLX’s actual results to differ materially from those implied in the forward-looking statements include: negative capital market conditions, including an increase of the
current yield on common units, adversely affecting MPLX’s ability to meet its distribution growth guidance; the ability to achieve strategic and financial objectives, including with respect to proposed projects and transactions; adverse changes in laws
including with respect to tax and regulatory matters; the adequacy of MPLX’s capital resources and liquidity, including, but not limited to, availability of sufficient cash flow to pay distributions and access to debt on commercially reasonable terms, and
the ability to successfully execute its business plans, growth strategy and self-funding model; the timing and extent of changes in commodity prices and demand for crude oil, refined products, feedstocks or other hydrocarbon-based products;
continued/further volatility in and/or degradation of market and industry conditions; changes to the expected construction costs and timing of projects and planned investments, and the ability to obtain regulatory and other approvals with respect
thereto; completion of midstream infrastructure by competitors; disruptions due to equipment interruption or failure, including electrical shortages and power grid failures; the suspension, reduction or termination of MPC’s obligations under MPLX’s
commercial agreements; modifications to earnings and distribution growth objectives; the ability to manage disruptions in credit markets or changes to credit ratings; compliance with federal and state environmental, economic, health and safety,
energy and other policies and regulations and/or enforcement actions initiated thereunder; adverse results in litigation; changes to MPLX's capital budget; other risk factors inherent to MPLX’s industry; risks related to MPC as set forth below, including
those related to MPC's acquisition of Andeavor or the potential merger, consolidation or combination of MPLX with ANDX; and the factors set forth under the heading “Risk Factors” in MPLX’s Annual Report on Form 10-K for the year ended Dec. 31,
2017, and in MPLX’s Forms 10-Q, filed with the Securities and Exchange Commission (SEC). Factors that could cause MPC's actual results to differ materially from those implied in the forward-looking statements include: the risk that the cost savings
and any other synergies from the Andeavor transaction may not be fully realized or may take longer to realize than expected; disruption from the Andeavor transaction making it more difficult to maintain relationships with customers, employees or
suppliers; risks relating to any unforeseen liabilities of Andeavor; the potential merger, consolidation or combination of MPLX with ANDX; future levels of revenues, refining and marketing margins, operating costs, retail gasoline and distillate margins,
merchandise margins, income from operations, net income or earnings per share; the regional, national and worldwide availability and pricing of refined products, crude oil, natural gas, NGLs and other feedstocks; consumer demand for refined
products; the ability to manage disruptions in credit markets or changes to credit ratings; future levels of capital, environmental or maintenance expenditures, general and administrative and other expenses; the success or timing of completion of
ongoing or anticipated capital or maintenance projects; the reliability of processing units and other equipment; business strategies, growth opportunities and expected investment; share repurchase authorizations, including the timing and amounts of
any common stock repurchases; the adequacy of capital resources and liquidity, including but not limited to, availability of sufficient cash flow to execute business plans and to effect any share repurchases or dividend increases, including within the
expected timeframe; the effect of restructuring or reorganization of business components; the potential effects of judicial or other proceedings on MPC’s business, financial condition, results of operations and cash flows; continued or further volatility in
and/or degradation of general economic, market, industry or business conditions; compliance with federal and state environmental, economic, health and safety, energy and other policies and regulations, including the cost of compliance with the
Renewable Fuel Standard, and/or enforcement actions initiated thereunder; the anticipated effects of actions of third parties such as competitors, activist investors or federal, foreign, state or local regulatory authorities or plaintiffs in litigation; the
impact of adverse market conditions or other similar risks to those identified herein affecting MPLX or ANDX; and the factors set forth under the heading "Risk Factors" in MPC's Annual Report on Form 10-K for the year ended Dec. 31, 2017, and in
MPC's Forms 10-Q, filed with the SEC. We have based our forward-looking statements on our current expectations, estimates and projections about our industry. We caution that these statements are not guarantees of future performance and you
should not rely unduly on them, as they involve risks, uncertainties, and assumptions that we cannot predict. In addition, we have based many of these forward-looking statements on assumptions about future events that may prove to be inaccurate.
While our management considers these assumptions to be reasonable, they are inherently subject to significant business, economic, competitive, regulatory and other risks, contingencies and uncertainties, most of which are difficult to predict and
many of which are beyond our control. Accordingly, our actual results may differ materially from the future performance that we have expressed or forecast in our forward-looking statements. We undertake no obligation to update any forward-looking
statements except to the extent required by applicable law. Copies of MPLX's Form 10-K and Forms 10-Q are available on the SEC website, MPLX's website at http://ir.mplx.com or by contacting MPLX's Investor Relations office. Copies of MPC's Form
10-K and Forms 10-Q are available on the SEC website, MPC's website at http://ir.marathonpetroleum.com or by contacting MPC's Investor Relations office.
Non-GAAP Financial Measures
Adjusted EBITDA, distributable cash flow (DCF) and distribution coverage ratio are non-GAAP financial measures provided in this presentation. Adjusted EBITDA and DCF reconciliations to the nearest GAAP financial measures are included in the
Appendix to this presentation. Distribution coverage ratio is the ratio of DCF attributable to GP and LP unitholders to total GP and LP distributions declared. Adjusted EBITDA, DCF and distribution coverage ratio are not defined by GAAP and should not be
considered in isolation or as an alternative to net income attributable to MPLX, net cash provided by operating activities or other financial measures prepared in accordance with GAAP. Certain EBITDA forecasts were determined on an EBITDA-only
basis. Accordingly, information related to the elements of net income, including tax and interest, are not available and, therefore, reconciliations of these forward-looking non-GAAP financial measures to the nearest GAAP financial measures have not
been provided.

                                                                                                                                                                                                                                                                         2
UBS Midstream, MLP and Utilities Conference - January 2019 - MPLX
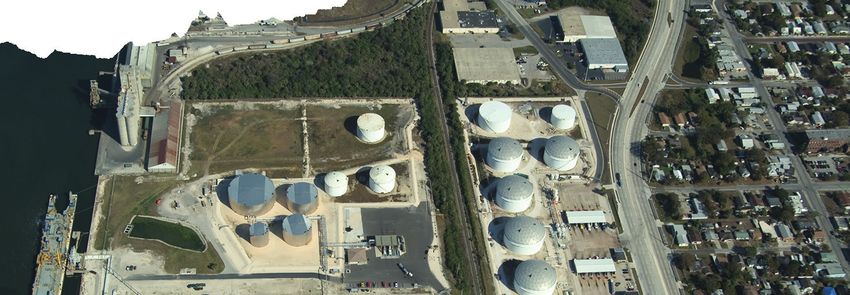
Roadmap to Creating Superior Value

Capture Full            Enhance                Grow in            Leverage             Financial
 Midstream              Cash Flow              Premier               MPC               Priorities
Value Chain              Stability              Basins           Relationship

Participate across   Long-haul pipelines        Permian:          Fosters growth      Self-funding
  value chain to     add stable cash flow   significant growth     opportunities     business model
diversify business                            opportunities
  and enhance         Export facilities                          Enhances projects    Target mid-teen
     margins          meet significant,         Marcellus:          via volume       returns on growth
                      growing market        disciplined growth     commitments          investments
Alleviate in-basin        needs               to support key
   bottlenecks                                  producers                                 Maintain
                      Leverage existing                                              investment grade
Connect supply to         assets for                                                    credit profile
 global demand        incremental third-
    markets             party business

                                                                                                    3
UBS Midstream, MLP and Utilities Conference - January 2019 - MPLX
Key Investment Highlights

Diversified large-cap MLP positioned to deliver attractive returns over the long term

    Logistics &                       •   Expanding third-party business and delivering industry solutions

     Storage                          •   Supports extensive operations of largest U.S. refiner

   Gathering &                        •   Largest processor and fractionator in the Marcellus/Utica basins
   Processing                         •   Growing presence in Permian basin and strong footprint in STACK play

                                      •   Substantial fee-based income with limited commodity exposure
Stable Cash Flows
                                      •   Long-term relationships with diverse set of producer customers

 Competitive Cost                     •   No IDR burden
   of Capital                         •   Anticipate no issuance of public equity to fund organic growth capital

                                                                                                                   4
UBS Midstream, MLP and Utilities Conference - January 2019 - MPLX
Compelling Investment Opportunity
                                                                  1,000
                                                                                                                                                       1.60
 Attractive returns for unitholders                                                                                                            $937
                                                                                                                                         $867
     – Forecast 10% distribution growth in 2018                    900

     – Expect $0.01 per unit increase each quarter in 2019(a)      800
                                                                                                                                  $760                 1.50

 Gathering & Processing provides attractive growth

                                                                                                                                                              Coverage Ratio x
                                                                   700

  opportunities                                                                                                            $569            1.38x
                                                                                                                    $538                               1.40
     – Significant natural gas and NGL growth in core footprint
                                                                   600

     – Assets to benefit from regional production growth           500
                                                                                                             $474
                                                                                                      $423
                                                                                        $375 $391
 Logistics & Storage asset base adds to stability                 400
                                                                                 $351                                 1.28x
                                                                                                                                                $766
                                                                                                                                                       1.30
                                                                          $302
  of cash-flow profile                                             300                    1.23x                                   $619
                                                                                                                                         $695

     – Incremental market opportunities off existing footprint
                                                                                                                    $442   $445
     – New market opportunities for third-party business           200

                                                                                                      $354   $387                                      1.20
                                                                                 $285   $301   $318
                                                                          $236
 Strong financial attributes                                      100

     – Low leverage, high coverage, self-funding                     0
                                                                                                                                                       1.10
     – Focused on attractive returns for capital projects                 1Q16 2Q16 3Q16 4Q16 1Q17 2Q17 3Q17 4Q17 1Q18 2Q18 3Q18
     – Commitment to investment grade credit profile
                                                                                           Annual Coverage Ratio
                                                                                           Distributable Cash Flow (DCF) ($MM)
                                                                                           Adjusted EBITDA attributable to MPLX LP ($MM)
(a)Assumes   MPLX and ANDX operate as standalone companies

                                                                                                                                                          5
UBS Midstream, MLP and Utilities Conference - January 2019 - MPLX
U.S. Production Growth Creates Midstream
  Opportunities
Strong production growth in crude, natural gas, and natural gas liquids will require additional
infrastructure to link supply to global demand markets. Pipelines, processing, fractionation and
export facilities will be needed to allow producers to realize full product value.
                       Crude                                                   Natural Gas                                                 NGL
MMBPD                                                    Bcfd                                                   MMBPD
 16                                                       110                                                    8

                          +50%                                                     +33%                          7
 14                                                      100                                                                               +69%
                                                                                                                 6
                                                          90                                      Exports
 12                                    Exports                                                                                                           Exports
                                                                                                                 5
                                                          80
 10                                                                                                              4
                                                          70
                                                                                                                 3
  8
                                                          60                                                     2
  6                                                       50                                                     1
  4                                                       40                                                     0
      2015

               2017

                      2019E

                              2021E

                                      2023E

                                                 2025E

                                                                                                                     2015

                                                                                                                            2017

                                                                                                                                   2019E

                                                                                                                                             2021E

                                                                                                                                                     2023E

                                                                                                                                                               2025E
                                                                2015

                                                                        2017

                                                                                2019E

                                                                                        2021E

                                                                                                2023E

                                                                                                        2025E
                                                                       Demand                     Production
Source: EIA, MPC                                                                                                                                              6
UBS Midstream, MLP and Utilities Conference - January 2019 - MPLX
Capturing The Full Midstream Value Chain

Feedstock Acquisition    Inbound Logistics   Refining & Processing   Outbound Logistics   Marketing & Retail

               Diversification enhances opportunities for revenue capture

               Integration enables capture of stable fee-based revenue across the value chain

               Developing assets focused on generating third-party revenue

    Integration enhances midstream value by increasing our touch points through the value chain

                                                                                                           7
UBS Midstream, MLP and Utilities Conference - January 2019 - MPLX
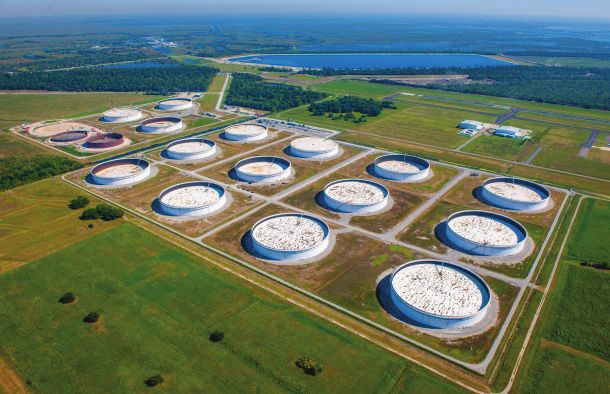
Capturing Permian Opportunities: Follow the Molecule

Creating an integrated footprint from                                        Legend
                                                                                Crude
the Permian to the Gulf Coast                                                   NGL
                                                                                Natural Gas

  1 Gathering and
    processing
                                            Delaware &
                                            Midland Basins
                                                                 TEXAS
  2 Long-haul pipelines                 1

  3 Fractionation                                            2
                                                                    3    4
  4   Export terminals

                                                                                              8
UBS Midstream, MLP and Utilities Conference - January 2019 - MPLX
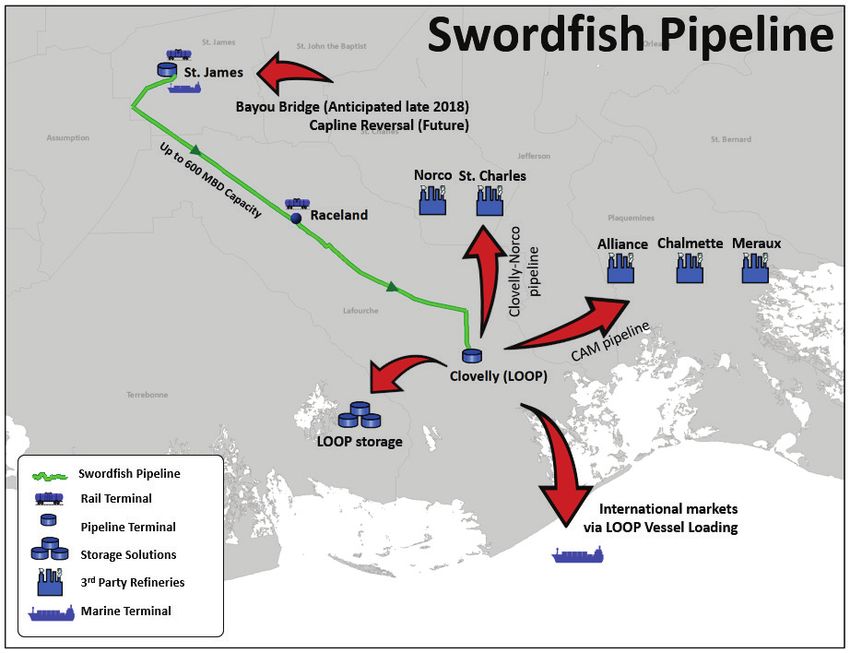
1            Permian G&P Feeds Downstream Opportunities

                               G&P assets create significant growth opportunities in the Permian
                                                                                                                 1
                                                                                                        Legend
                                                                                                       Crude pipeline
                                                                                                       Natural gas pipeline
                                                                                                       NGL pipeline

                       Preakness          Torñado                                                      Crude gathering

                                                                                                       Existing processing plant

                                                                                                       Future processing plant
                      Argo                  Apollo

                                                                               To Texas City area
                               Hidalgo                                                                 Natural gas gathering & processing
                                                                              To Agua Dulce              – Existing plants: Hidalgo, Argo
                                                                                                         – Future plants: Apollo, Torñado, Preakness
                                                                                                         – 200 MMcfd plants provide volumes for
                                                                                                           planned Whistler and BANGL pipelines
1 Pipelines   are shown pictorially only to show flow paths; some pipelines are new and/or proposed,

                                                                                                                                                       9
UBS Midstream, MLP and Utilities Conference - January 2019 - MPLX
2   Permian Crude Long-Haul Pipelines

Investments in long-haul pipelines generate stable, fee-based midstream income and
also help lower feedstock costs tor MPC refineries

 Gray Oak Pipeline (MPC Project)
 – MPC, Diamondback Energy, PSXP
                                                           Midland
                                                                     TEXAS
 – ~850 mile, 30-inch diameter                      Wink

 – Anticipate in-service 4Q19                Orla
                                                     Crane
                                                                                                Nederland

 PGC Pipeline                                                                 Texas City
                                                                                              Galveston Bay
 – MPLX, Energy Transfer, Magellan, Delek
                                                                             Corpus Christi
 – ~600 mile, 30-inch diameter
 – Anticipate in-service 4Q20

                                                                                                        10
2    Permian Natural Gas Long-Haul Pipeline

Expand our value chain by connecting growing natural gas production to demand from
MPC refineries and global export markets
 Whistler Pipeline
 – MPLX, Targa, White Water Midstream,
   and potentially others
                                                Waha        TEXAS
 – ~450 miles, 42-inch diameter
 – Capacity 2 Bcfd
                                                                           Texas City
                                                                                            Galveston Bay
 – ~170 miles, 30- or 42-inch diameter pipe
   from Agua Dulce to Gulf Coast industrial
                                                                           Corpus Christi
   markets                                                    Agua Dulce

 – Anticipate in-service 4Q20

                                                                                                   11
2     Permian NGL Long-Haul Pipeline and
3     Fractionation
Expand our value chain by connecting growing NGL production and developing new
fractionation infrastructure in the Gulf Coast

 BANGL Pipeline (Belvieu Alternative NGL)
    – MPLX, White Water Midstream, and other partners               TEXAS
    – ~400 mile, 24-inch diameter mainline

 Gulf Coast fractionation
    – MPLX, additional partners near Texas City
    – Two potential fractionators with 150 MBPD C2+ capacity each

                                                                                 12
4   Expanding Export Assets at Five Gulf Coast Locations

Export facilities create ability to generate third party revenue and meet global demand
for crude, refined products, and NGLs
 Currently in service
 – Mt. Airy, LA: acquired in 3Q18
 – LOOP: expansion with potential Capline reversal and
   Swordfish Pipeline
                                                           TEXAS
 Planned projects                                                                  St. James
                                                                       Texas City               Mt.
                                                                                                Mt.Airy
                                                                                                    Airy
 – South Texas Gateway (MPC project)                                                    LOOP

 – Texas City: hub for planned PGC and BANGL pipelines
                                                           Corpus Christi
                                                           South TX Gateway

                                                                                                    13
L&S: Mt. Airy Export Terminal

 Strategically located on Mississippi River in close proximity to several refineries, including MPC’s Garyville
  refinery

 4 MMBBL of third-party leased storage capacity, capability to expand storage capacity to 10 MMBBL

 120,000 bpd export dock, permitted for construction of second 120,000 bpd dock

                                                                                                                   14
L&S: Swordfish Pipeline

 Proposed crude oil pipeline running from St. James
  to Clovelly in Louisiana

 Jointly developed: MPLX and Crimson Midstream

 Binding open season to assess shipper interest
  commenced on October, 17, 2018

 Pipeline would provide shippers access to storage
  services, vessel loading, and connectivity to other
  carriers at Clovelly Hub

 Proposed in service first half 2020

                                                        15
Logistics & Storage
Segment Overview

  High-quality, well-maintained assets that are integral to MPC
  Transports, stores, distributes and markets crude oil and refined petroleum products
  Stable cash flows with fee-based revenues and minimal direct commodity exposure

     Fuels             Pipelines            Refining           Terminals and        Marine
  Distribution                              Logistics             Storage

                                                                                             16
Fuels Distribution Overview
Extensive Range of Scheduling and Marketing Services that Support MPC’s Refining and Marketing Operations

                             Services Description

                                   Scheduling
                                                                                     Annual EBITDA ~$600 MM
                            Supply and demand balancing
                            Third-party exchange, terminaling and storage       Acquired Feb. 1, 2018 from MPC
                            Bulk purchases and sale of products
                                                                                 Supported by MPLX logistics assets
                            Product movements coordination                           no additional maintenance capital
                            Products and intermediates inventory

                                Marketing Services

                                                                              Different from other Fuels Distribution models
                            Customer identification, evaluation and set-up
                                                                                     No title to inventory
                            Marketing analytics and forecasting
                            Sale of products                                        Margin risk stays with MPC
                            Product marketing through multiple channels of          100% fee for services
                             distribution

                                                                                                                           17
Crude Oil Pipelines
Strategically positioned to support diverse and flexible crude oil supply
Owns, leases, operates, or has interest in:     Crude Oil Pipeline Joint-Interest Ownership:
 ~4,500 miles of crude oil pipelines            Bakken Pipeline System, 9.2% ownership, includes
                                                  Dakota Access Pipeline and Energy Transfer Crude
 Pipelines connected to supply hubs such as      Oil Pipeline
  Cushing, Oklahoma; Wood River and Patoka,      Southern Access Extension Pipeline (SAX),
  Illinois                                        35% ownership interest
 Transports crude to refineries owned by MPC    Louisiana Offshore Oil Port (LOOP), 40.7%
  and third parties                               ownership interest
                                                 LOCAP Pipeline, 58.5% ownership interest

                                                                                                18
Product Pipelines
Integrated network delivering refined products to key market areas
Owns, leases, operates or has interest in:
 ~5,500 miles of product pipelines
 Strategically positioned to transport products from MPC refineries to
  MPC’s marketing operations
 Integrated with expansive network of refined product marketing terminals

Product Pipeline Joint-Interest Ownership:
 Explorer Pipeline, 24.5% ownership, originating from Port Arthur, Texas, to
  Hammond, Indiana

                                                                                19
Refining Logistics Overview
Integrated Tank Farm Assets Supporting MPC’s Operations

                             Tanks                                               Racks

              ~56 MMBBL storage                               Multiple rail and truck loading racks

                             Docks                                Gasoline Blending & Associated Piping

              Handle ocean- and river-going vessels           Piping to connect process units, tank
               at Gulf Coast refineries and asphalt             farms, terminals
               barges at Detroit refinery

        Annual EBITDA ~$400 MM                         Fee for Capacity Arrangement

     Acquired Feb. 1, 2018 from MPC

                                                                                                          20
Terminal and Storage Assets

   Facilities provide flexibility and logistics optionality
   Long-term, fee-based storage and terminal services agreements with MPC
   62 light product terminals with ~24 MMBBL of storage capacity
   Tank farms and caverns:
     – Own and operate 15 crude oil and product tank farms, and operate two leased tank farms
        with ~19 MMBBL of available storage capacity
     – Wood River Barge Dock with ~80 MBPD crude oil throughput capacity
     – Natural gas liquids storage caverns in Woodhaven, Michigan; Robinson, Illinois; and Neal,
        West Virginia

                                                                                                   21
Marine Transportation Operations
Highly predictable income and cash-flow stream

 Transports refined products and crude oil on the Ohio, Mississippi, and Illinois rivers and their
  tributaries and inter-coastal waterways
 256 barges, 20 towboats as of September 30, 2018
 Operates full-service marine shipyard on Ohio River, adjacent to MPC’s Catlettsburg, Kentucky,
  refinery
    – Responsible for preventive routine and unplanned maintenance of towing vessels, barges,
      and local terminal facilities
 Fee-for-capacity service agreement with MPC

                                                                                                      22
Organic Growth Capital Projects
Logistics & Storage Segment

Projects                                                              Description                                       Est. Completion Date

Ozark and Wood River-to-Patoka   Increasing pipeline capacity to 360 MBPD; provides crude sourcing optionality to
                                                                                                                              In Service
Pipeline Expansions              Midwest refineries

Robinson Butane Cavern           Displaces MPC’s third-party storage services and optimizes butane handling                   In Service

Texas City Tank Farm             MPC and third-party logistics solution                                                       In Service

Patoka Tank Farm                 MPC and third-party logistics solution                                                         4Q18

Marine Fleet Expansion           Displaces MPC’s third-party barges and supports increased demand                            2018/2019

Mt. Airy Terminal Expansion      Constructing 2nd 120 MBPD dock and incremental storage                                         2020

                                 Provide transport of up to 600 MBPD of crude from St. James, LA to the LOOP terminal
Swordfish Pipeline(a)                                                                                                           2020
                                 facility in Clovelly, LA

PGC Pipeline(a)                  600-mile crude pipeline from Permian Basin to Texas Gulf Coast                                 2020

Whistler Pipeline(a)             2.0 Bcf/d natural gas pipeline from Waha, Texas, to Agua Dulce market hub                      2020

BANGL Pipeline                   400-mile NGL pipeline from Permian Basin to Texas Gulf Coast                                   TBD
(a)Equity   method investment

                                                                                                                                           23
Gathering & Processing
Segment Overview
                                                                                                                                        • Ethane
                 Raw                               Gathering                                                                            • Propane
                                                                Processing     Mixed                 Fractionation               NGL
              Natural Gas                            and                                                                                • Normal Butane
                                                                  Plants       NGLs                    Facilities              Products • Isobutane
              Production                          Compression
                                                                                                                                        • Natural Gasoline
                                                                                    Gathering Capacity                      C2 + Fractionation Capacity
 We are well-positioned in the most prolific and                                      (~5.9 Bcf/d)                               (~610 MBPD)(a)
  attractive basins
          – Largest processor and fractionator in the Marcellus/Utica                                                                                     ~5%
            basins                                                                                 ~35%
                                                                                                                                                             ~5%
          – Strong footprint in STACK play and growing presence in
                                                                                       ~65%                                     ~90%
            Permian basin

 Top-rated midstream service provider since 2006 as
  determined by independent research provider
                                                                                                                     ~20%
 Primarily fee-based business with highly diverse
  customer base and established long-term contracts                                                                     ~5%             Marcellus/Utica
                                                                             Processing Capacity          ~75%
                                                                                 (~8.9 Bcf/d)
                                                                                                                                         Southwest
                                                                                                                                        Southern Appalachia
(a)Includes   condensate stabilization capacity

                                                                                                                                                                24
Marcellus/Utica Overview
3.8 Bcf/d Gathering, 6.6 Bcf/d Processing & 531 MBPD C2+ Fractionation Capacity

Marcellus/Utica continues to be the largest natural    OH                                                  PA
gas basin in the U.S. Current producer demand                                                        Bluestone
supports our buildout of incremental infrastructure:             Hopedale            Harmon Creek

  Forecasted Volumes       2018E        2020E           Cadiz                                  Houston
                                                                  Ohio Condensate
  Gathered                 3.0 Bcfd     4.4 Bcfd
  –Processed
     Processing:       7.0 Bcf/d
                           5.4 Bcfd     7.3 Bcfd                                       Majorsville

  – Fractionation:     631 MBPD                                 Seneca
  Fractionated           435 MBPD      600 MBPD
                                                                                      Mobley             Legend
                                                                                                                 Utica Complex
 Expect greater than 35% volume growth with                Smithburg               Sherwood                     Marcellus Complex
  disciplined capital investments deployed to meet                                                               NGL Pipeline
  demand on a just-in-time basis                                                                                 Purity Ethane

                                                                             WV                                  Pipeline

                                                                                                                                 25
Building Infrastructure to Support Processing & Fractionation
 Volume Growth
                                                                Marcellus/Utica Processing Capacity

         8                2018 plan increases processing capacity by 21% to ~7 Bcf/d                          Currently ~65% of processing capacity in the
                                                                                                              Marcellus/Utica basin

         6                                                                                                    2018 expected plant completions
 Bcf/d

                                                                                                              Harmon Creek
         4                                                                                                    Houston 1 (In-Service 1Q18)
                                                                                                              Majorsville 7 (In-Service 3Q18)
         2                                                                                                    Sherwood 9 (In-Service 1Q18)
                                                                                                              Sherwood 10 (In-Service 4Q18)
         0                                                                                                    Sherwood 11
                  2013                 2014                  2015                2016       2017      2018E

                                                              Marcellus/Utica Fractionation Capacity
       600                 2018 plan increases fractionation capacity by 19% to ~631 MBPD                     Currently ~60% of fractionation capacity in
                                                                                                              the Marcellus/Utica basin

       400                                                                                                    2018 expected plant completions
MBPD

                                                                                                              Harmon Creek C2
                                                                                                              Sherwood C2
       200                                                                                                    Hopedale IV C3+

         0
                   2013                 2014                 2015                2016       2017      2018E
                                                   Throughput           Year-End Capacity
 Note: 2013 through 2015 include MarkWest volumes prior to acquisition by MPLX

                                                                                                                                                            26
Gathering & Processing Segment
  Marcellus & Utica Operations
                                                                                                Processed Volumes(a)
 Gathered volumes averaged 3.1 Bcf/d,
                                                                                                                                                      Utilization of
  ~35% increase over 3Q 2017                                                                      Capacity at                        Average
                                                                                                                                                       Available
                                                                  Area                           End of Quarter                      Volume
                                                                                                                                                        Capacity
 Processed volumes averaged 5.5 Bcf/d,                                                            (MMcf/d)                         (MMcf/d)
                                                                                                                                                           (%)(b)
  ~10% increase over 3Q 2017
                                                     Marcellus                                        5,120                           4,609              90%
 Commenced operations of 200 MMcf/d                     Houston                                         720                            603               84%
  Sherwood 10 plant in October                           Majorsville                                   1,270                           1,081              85%
                                                         Mobley                                          920                            736               80%
 Expect to add 400 MMcf/d of incremental                Sherwood                                      1,800                           1,781              99%
  processing capacity in 4Q 2018 which                   Bluestone                                       410                            408              100%
  would take total regional capacity to slightly     Utica                                            1,325                             857              65%
  over 7 Bcf/d                                           Cadiz                                           525                            457               87%
                                                         Seneca                                          800                            400               50%
                                                     3Q 2018 Total                                    6,445                           5,466              85%
                                                     2Q 2018 Total                                    6,245                           5,162              83%
                                                   (a)Includes amounts related to unconsolidated equity method investments on a 100% basis
                                                   (b)Based on weighted average number of days plant(s) in service. Excludes periods of maintenance

                                                                                                                                                                       27
Gathering & Processing Segment
 Marcellus & Utica Fractionation

                                                                          Fractionated Volumes(a)
 Achieved 3Q 2018 fractionated                                                                                               Utilization of
                                                                              Capacity at                Average
  volumes of ~454 MBPD                                 Area                  End of Quarter              Volume
                                                                                                                               Available
                                                                                                                                Capacity
                                                                               (MBPD)(b)                 (MBPD)
 Achieved ~24% growth in quarterly                                                                                                (%)(c)

  fractionated volumes over 3Q 2017          3Q18 Total C3+                        287                     256                     89%

 Expect to add 20 MBPD of C2 capacity      3Q18 Total C2                          244                     198                     81%
  at both Sherwood and Harmon Creek
                                            2Q18 Total C3+                         287                     231                     80%
  and 60 MBPD of C3 capacity at
  Hopedale in 4Q 2018                       2Q18 Total C2                          244                     176                     72%
                                         (a)Includesamounts related to unconsolidated equity method investments on a 100% basis
                                         (b)ExcludesCibus Ranch condensate facility
                                         (c)Based on weighted average number of days plant(s) in service. Excludes periods of maintenance

                                                                                                                                            28
Southwest: Considerable Scale
2.1 Bcf/d Gathering, 1.7 Bcf/d Processing & 29 MBPD C2+ Fractionation Capacity

Western Oklahoma
Processing
                                 Oklahoma                     Southeast Oklahoma
                                                             Processing*
500MMcf/d                                                    112MMcf/d
Gathering                                                     Gathering
585MMcf/d                                                     755MMcf/d
                         Permian
                                                               *Represents 40% of processing capacity through the
                                                               Partnership’s      Centrahoma JV with Targa Resources
                                                               Corp.
                         Processing
                        400MMcf/d                              East Texas
  Gulf Coast                                                  Processing
 Processing
 142MMcf/d                                                     600MMcf/d
                                                               Gathering
 Fractionation
 29,000BPD                            Texas                    680MMcf/d
                                                                                                                       29
Expanding Position to Support Growing Production

                     Permian                                      Cana-Woodford                                                                    Arkoma-Woodford

                                     Permian
                                      Basin                                             Arapaho Complex                                                       Hickory Hills
                                                                                                                                                                 Plant
   Hidalgo Complex                                                                               Dewey
                                                                                                           Blaine    Kingfisher

     200 MMcf/d        Delaware                                                                  Rich-gasNewfield
                        Basin                                                                    pipeline STACK area
                                                                                Roger Mills               of
                                                                                               Custer     operationsCanadian
                                                                                                           Caddo
                                                                                                                                                              Tupelo Plant
    Argo Complex                                                                              Washita

200 MMcf/d – Q1 2018                                                          Beckham               Buffalo            Grady

                                                                                                    Creek
                                                                                                                                  McClain
                                                                                                   Complex
                                                                                                          Comanche                    Garvin

                                                                                                 Woodford Play
                                                                                                                       Stephens
                                                                                                 Meramec Play

            Hidalgo processing plant in Culberson County,       75 MMcf/d processing plant in STACK shale (Omega)                               Investment in two processing plants through our
             Texas, currently operating at near                   placed in service in July 2018                                                   Centrahoma joint venture with Targa Resources
             100% utilization
                                                                 Increasing capacity of Omega plant by 45 MMcf/d;                                These Southeast Oklahoma plants, Hickory Hills and
            200 MMcf/d processing plant in Delaware              constructing additional 120 MMcf/d processing plant                              Tupelo, will add 270 MMcf/d of natural gas
             Basin (Argo) placed in service in 1Q 2018                                                                                             processing capacity and are expected to contribute
                                                                 Constructing rich-gas and crude oil gathering
                                                                                                                                                   earnings in 4Q 2018
            Expect to add three additional 200 MMcf/d            systems with related storage and logistics facilities
             processing plants (Torñado, Apollo, Preakness)                                                                                       MPLX will maintain 40% ownership in the expanded
                                                                                                                                                   joint venture

                                                                                                                                                                                               30
Gathering & Processing Segment
  Southwest Operations
                                                                                               Processed Volumes(a)
 Gathered volumes averaged 1.6 Bcf/d,
  ~14% increase over 3Q 2017                                                                      Capacity at
                                                                                                                                Average
                                                                                                                                                          Utilization of
                                                                                                    End of                                                 Available
                                                                    Area                                                        Volume
                                                                                                    Quarter                                                 Capacity
 Processed volumes averaged 1.5 Bcf/d,                                                            (MMcf/d)
                                                                                                                               (MMcf/d)
                                                                                                                                                               (%)(b)
  ~11% increase over 3Q 2017
                                                      West Texas(c)                                    400                         238                          60%
 Commenced operations of 75 MMcf/d                   East Texas                                       600                         434                          72%
  Omega plant in Western Oklahoma                     Western OK                                       500                         428                          86%
  (STACK) in July
                                                      Southeast OK(d)                                  262                         262                         100%
 Expect to add 270 MMcf/d of processing              Gulf Coast                                       142                         117                          82%
  capacity through Centrahoma JV(a) in 4Q
                                                      3Q 2018 Total(d)                               1,904                        1,479                         78%
  2018
                                                      2Q 2018 Total(c) (d)                           1,820                        1,401                         77%
                                                      (a)Includes amounts related to unconsolidated equity method investments on a 100% basis
                                                      (b)Based  on weighted average number of days plant(s) in service. Excludes periods of maintenance
                                                      (c)Includes correction to volumes reported in 2Q 2018 earnings materials
                                                      (d)Includes Centrahoma volumes sent to third parties. Processing capacity and utilization based on the higher of the
  (a)MPLX   will own 40% of new processing capacity      partnership’s portion of Centrahoma JV or the average volume processed

                                                                                                                                                                             31
Recap: Gathering & Processing Contract Structure
Durable long-term partnerships across leading basins

                                   Marcellus                              Utica                                 Southwest
Resource Play          Marcellus, Upper Devonian          Utica                                    Haynesville, Cotton Valley, Woodford,
                                                                                                   Anadarko Basin, Granite Wash, Cana-
                                                                                                   Woodford, Permian, Eagle Ford

Producers              Include Range, Antero, EQT, CNX,   Include Antero, Gulfport, Ascent, EQT,   Include Newfield, BP, Cimarex,
                       Penn Energy, Southwestern, and     and others                               Chevron, PetroQuest and others
                       others

Contract Structure     Long-term agreements initially     Long-term agreements initially           Long-term agreements initially
                       10-15 years, which contain         10-15 years, which contain renewal       10-15 years, which contain renewal
                       renewal provisions                 provisions                               provisions
Volume Protection      70% of 2018 capacity contains      27% of 2018 capacity contains            15% of 2018 capacity contains
(MVCs)                 minimum volume commitments         minimum volume commitments               minimum volume commitments

Area Dedications       4.1 MM acres                       3.9 MM acres                             2.0 MM acres
Inflation Protection   Yes                                Yes                                      Yes

                                                                                                                                           32
2018 Organic Growth Capital Projects
 Gathering & Processing Segment

                                                                   Est. Completion                                                    Est. Completion
Processing and Fractionation      Shale Resource       Capacity                       Gathering
                                                                         Date                                                               Date
                                                                                      Marcellus/Utica Rich- and Dry-Gas
                                                                                                                                           Ongoing
Sherwood 9 Processing Plant(b)       Marcellus        200 MMcf/d     In Service       Gathering(a)

                                                                                      Western Oklahoma - STACK Rich-
Houston 1 Processing Plant(c)        Marcellus        200 MMcf/d     In Service       Gas and Oil Gathering
                                                                                                                                           Ongoing

Argo Processing Plant                Delaware         200 MMcf/d     In Service
                                                                                                                                      Est. Completion
                                                                                      Other
Omega Processing Plant             Cana-Woodford      75 MMcf/d      In Service                                                             Date

                                                                                      NGL Pipeline Expansions                              Ongoing
Majorsville 7 Processing Plant       Marcellus        200 MMcf/d     In Service
                                                                                      Agua Blanca gas pipeline(d)                         In Service
Sherwood 10 Processing Plant(b)      Marcellus        200 MMcf/d     In Service
                                                                                      Hickory Hills/Tupelo gas processing
                                                                                                                                             4Q18
Sherwood C2 Fractionation            Marcellus        20,000 BPD       4Q18           plants (Southeast Oklahoma)(e)

Sherwood 11 Processing Plant(b)      Marcellus        200 MMcf/d       4Q18
                                                                                     (a)Utica Rich- and Dry-Gas Gathering is a joint venture between
Harmon Creek Processing Plant        Marcellus        200 MMcf/d       4Q18
                                                                                        MarkWest Utica EMG’s and Summit Midstream LLC.
                                                                                        Dry-Gas Gathering in the Utica Shale is completed through
Harmon Creek C2 Fractionation        Marcellus        20,000 BPD       4Q18             a joint venture with MarkWest and EMG.
                                                                                     (b)Sherwood Midstream investment
                                                                                     (c)Replacement of existing Houston 35 MMcf/d plant
Hopedale IV C3+ Fractionation     Marcellus & Utica   60,000 BPD       4Q18          (d)White Water Midstream investment
                                                                                     (e)Centrahoma JV investment

                                                                                                                                                       33
2019+ Announced Projects
Gathering & Processing Segment

 Continuing to execute on build out in both the Marcellus/Utica and Permian to meet industry
  needs
        Complex Name                                         Location      Capacity     Est. Completion Date

        Sherwood 12 Processing Plant(a)                      Marcellus   200 MMcf/d            2019

        Sherwood 13 Processing Plant(a)                      Marcellus   200 MMcf/d            2019

        Torñado Processing Plant                             Delaware    200 MMcf/d            2019

        Apollo Processing Plant                              Delaware    200 MMcf/d        1st Half 2020

        Omega 1 Processing Plant Expansion                    STACK       45 MMcf/d            2019

        Omega 2 Processing Plant                              STACK      120 MMcf/d            2019

        Preakness Processing Plant                           Delaware    200 MMcf/d            2021

        Smithburg Processing(a) – site layout for 6 plants   Marcellus   1,200 MMcf/d           TBD
        (a)Sherwood   Midstream investment

                                                                                                               34
MPLX Outlook

 2019 Distribution Growth: expect $0.01 per unit increase each quarter(1)
 Forecast (1), excluding acquisitions and dropdowns:

             ($ billion)                                                                                            2019E                    2020E
             Net Income                                                                                               $2.2                   $2.5
             Adjusted EBITDA(a)                                                                                       $3.9                   $4.4
             Net cash provided by operating activities                                                                $3.2                   $3.8
             Distributable Cash Flow (DCF)(a)                                                                         $3.1                   $3.5
             Organic Growth Capital Expenditures(b)                                                                   $2.2                   $2.0

         (a)Non-GAAP    measure calculated before the distribution to preferred units. See reconciliation in appendix.
         (b)Guidance   excludes expenditures incurred related to acquisitions and non-affiliated JV members’ share of capital expenditures

(1)Assumes   MPLX and ANDX operate as standalone companies

                                                                                                                                                     35
Appendix

           36
Reconciliation of Adjusted EBITDA and
 Distributable Cash from Net Income
($MM)                                                               1Q16   2Q16   3Q16   4Q16   1Q17   2Q17   3Q17   4Q17    1Q18    2Q18    3Q18
Net income                                                          (14)    72    194    182    187    191    217    241     423     456     516    (a)ThePartnership makes a distinction
   Provision (benefit) for income taxes                              (4)    (8)      -      -      -     2      1     (2)      4       1       3      between realized or unrealized gains
   Amortization of deferred financing costs                          11     12     11     12     12     13     13     15      16      15      14      and losses on derivatives. During the
                                                                                                                                                      period when a derivative contract is
   Net interest and other financial costs                            57     52     53     53     66     74     80     81     114     136     139
                                                                                                                                                      outstanding, changes in the fair value of
Income from operations                                               50    128    258    247    265    280    311    335     557     608     672      the derivative are recorded as an
   Depreciation and amortization                                    136    151    151    153    187    164    164    168     176     188     201      unrealized gain or loss. When a
   Non-cash equity-based compensation                                 2      4      3      1      3      3      4      5       4       5       6      derivative contract matures or is settled,
   Impairment expense                                               129      1       -      -      -      -      -      -       -       -       -     the previously recorded unrealized gain
                                                                                                                                                      or loss is reversed and the realized gain
   (Income) Loss from equity method investments                      (5)    83     (6)     2     (5)    (1)   (23)   (49)    (61)    (50)    (64)
                                                                                                                                                      or loss of the contract is recorded.
   Distributions/adjustments related to equity method investments    38     40     33     39     33     33     65    100      90     112     112
   Unrealized derivative (gains) losses(a)                            9     12      2     13    (16)    (3)    17      8      (7)      8      17    (b)The Adjusted EBITDA and DCF
   Acquisition costs                                                  1     (2)      -      -     4       -     2      5       3        -       -     adjustments related to the Predecessor
Adjusted EBITDA                                                     360    417    441    455    471    476    540    572     762     871     944      are excluded from adjusted EBITDA
                                                                                                                                                      attributable to MPLX LP and DCF prior
   Adjusted EBITDA attributable to noncontrolling interests          (1)      -    (2)      -    (1)    (2)    (2)    (3)     (2)     (4)     (7)
                                                                                                                                                      to the acquisition dates.
   Adjusted EBITDA attributable to Predecessor(b)                   (57)   (66)   (64)   (64)   (47)      -      -      -       -       -       -
Adjusted EBITDA attributable to MPLX LP                             302    351    375    391    423    474    538    569     760     867     937
   Deferred revenue impacts                                           3      4      1      8      8      9      8      8       9       2      13
   Net interest and other financial costs                           (57)   (52)   (53)   (53)   (66)   (74)   (80)   (81)   (114)   (136)   (139)
   Maintenance capital expenditures                                 (13)   (20)   (25)   (26)   (12)   (23)   (24)   (44)    (25)    (33)    (40)
   Equity method investment capital expenditures paid out            (1)      -      -    (2)    (2)      -    (2)    (9)    (11)     (5)     (6)
   Other                                                              1       -    (2)      -     1      1      2      2        -       -      1
   Portion of DCF adjustments attributable to Predecessor(b)          1      2      5       -     2       -      -      -       -       -       -
Distributable cash flow attributable to MPLX LP                     236    285    301    318    354    387    442    445     619     695     766
   Preferred unit distributions                                        -    (9)   (16)   (16)   (16)   (17)   (16)   (16)    (16)    (20)    (19)
Distributable cash flow available to GP and LP unitholders          236    276    285    302    338    370    426    429     603     675     747

                                                                                                                                                                                              37
Reconciliation of Adjusted EBITDA and Distributable Cash
  from Net Cash Provided by Operating Activities
($MM)                                                            3/31/16 6/30/16 9/30/16 12/31/16 3/31/17 6/30/17 9/30/17 12/31/17 3/31/18 6/30/18 9/30/18

Net cash provided by operating activities                        321     670     975     1,491    377    844     1,338   1,907     450    1,290   2,027      (a)The Partnership makes a distinction
   Changes in working capital items                              (13)    (9)     59      (66)     51       1     (41)     (147)    178     33      78          between realized or unrealized gains
                                                                                                                                                               and losses on derivatives. During the
   All other, net                                                (17)    (22)    (18)    (26)     (16)   (32)    (43)     (28)     (3)     14        5
                                                                                                                                                               period when a derivative contract is
   Non-cash equity-based compensation                              2       6       9      10        3      6      10       15       4        9      15         outstanding, changes in the fair value of
   Net gain (loss) on disposal of assets                           -       -       1       1       (1)     1       1        -       -        -      (1)        the derivative are recorded as an
   Current income taxes                                            -       1       4       5        -      1       1        2       -        -       1         unrealized gain or loss. When a
   Net interest and other financial costs                         57     109     162     215       66    140     220      301      114     250     389         derivative contract matures or is settled,
                                                                                                                                                               the previously recorded unrealized gain
   Asset retirement expenditures                                   -       2       4       6        1      1       2        2       1        5       7
                                                                                                                                                               or loss is reversed and the realized gain
   Unrealized derivative losses (gains)(a)                        9       21      23      36      (16)   (19)     (2)      6       (7)       1      18         or loss of the contract is recorded.
   Acquisition costs                                              1       (1)     (1)     (1)       4     4        6       11       3        3       3
                                                                                                                                                             (b)The Adjusted EBITDA and DCF
   Other adjustments to equity method investment distributions     -       -       -       2        -      -      (5)     (10)     22      27       35
   Other                                                           -       -       -        -       2      -        -       -        -       1       -         adjustments related to the Predecessor
                                                                                                                                                               are excluded from adjusted EBITDA
Adjusted EBITDA                                                  360     777    1,218    1,673    471    947     1,487   2,059     762    1,633   2,577
                                                                                                                                                               attributable to MPLX LP and DCF prior
   Adjusted EBITDA attributable to noncontrolling interests       (1)     (1)     (3)      (3)     (1)    (3)      (5)     (8)      (2)     (6)    (13)        to the acquisition dates.
   Adjusted EBITDA attributable to Predecessor(b)                (57)   (123)   (187)    (251)    (47)   (47)     (47)    (47)       -       -       -
Adjusted EBITDA attributable to MPLX LP                          302     653    1,028    1,419    423    897     1,435   2,004     760    1,627   2,564
   Deferred revenue impacts                                       3        7      8        16       8     17       25      33        9      11      24
   Net interest and other financial costs                        (57)   (109)   (162)    (215)    (66)   (140)   (220)    (301)   (114)   (250)   (389)
   Maintenance capital expenditures                              (13)    (33)    (58)     (84)    (12)    (35)    (59)    (103)    (25)    (58)    (98)
   Equity method investment capital expenditures paid out         (1)     (1)     (1)      (3)     (2)     (2)     (4)     (13)    (11)    (16)    (22)
   Other                                                           1       1      (1)      (1)      1       2       4       6        -       -      1
   Portion of DCF adjustments attributable to Predecessor(b)      1        3       8        8       2      2        2       2        -       -       -
Distributable cash flow attributable to MPLX LP                  236     521     822     1,140    354    741     1,183   1,628     619    1,314   2,080
   Preferred unit distributions                                   -       (9)    (25)     (41)    (16)   (33)     (49)    (65)     (16)    (36)    (55)
Distributable cash flow attributable to GP and LP unitholders    236     512     797     1,099    338    708     1,134   1,563     603    1,278   2,025

                                                                                                                                                                                                  38
MPLX 2019-2020 Outlook – Reconciliation

         Adjusted EBITDA and Distributable Cash Flow from Net Income
        ($ billion)                                                 2019E     2020E

        Net income                                                     2.2       2.5
        Depreciation and amortization                                  0.9       1.0
        Net interest and other financial costs                         0.7       0.7
        Adjustment for equity investment earnings & distributions      0.2       0.2
        Other                                                          0.0       0.1
        Adjusted EBITDA                                                4.0       4.5
        Adjusted EBITDA attributable to noncontrolling interests      (0.1)     (0.1)
        Adjusted EBITDA attributable to MPLX LP                        3.9       4.4
        Deferred revenue impacts                                       0.1       0.1
        Net interest and other financial costs                        (0.7)     (0.7)
        Maintenance capital expenditures                              (0.2)     (0.2)
        Other                                                          0.0      (0.1)
        Distributable cash flow attributable to MPLX LP                3.1       3.5

                                                                                        39
MPLX 2019-2020 Outlook – Reconciliation

   Adjusted EBITDA and Distributable Cash Flow from Net Cash Provided by Operating Activities
            ($ billion)                                                2019E     2020E

            Net cash provided by operating activities                     3.2       3.8
            Changes in working capital items                              0.0      (0.1)
            Net interest and other financial costs                        0.7       0.7
            Unrealized derivative losses (gains)                         (0.0)     (0.0)
            Other                                                         0.1       0.1
            Adjusted EBITDA                                               4.0       4.5
            Adjusted EBITDA attributable to noncontrolling interests     (0.1)     (0.1)
            Adjusted EBITDA attributable to MPLX LP                       3.9       4.4
            Deferred revenue impacts                                      0.1       0.1
            Net interest and other financial costs                       (0.7)     (0.7)
            Maintenance capital expenditures                             (0.2)     (0.2)
            Other                                                         0.0      (0.1)
            Distributable cash flow attributable to MPLX LP               3.1       3.5

                                                                                                40
You can also read