INVESTOR PRESENTATION - GIBSON ENERGY
←
→
Page content transcription
If your browser does not render page correctly, please read the page content below

GIBSON ENERGY
INVESTOR PRESENTATION
January 2020

Company Snapshot
Building a leading oil-focused infrastructure business

                     GEI                                 $3.9B
                   TSX LISTED                           MARKET
                                                    CAPITALIZATION(1)

                                     $5.1B                                 15mm
                                     ENTERPRISE                             BARRELS OF
                                      VALUE(1)                              STORAGE(2)

                ~$1.0B                                 S&P: BBB –
              INFRASTRUCTURE
             CAPITAL DEPLOYED                      DBRS: BBB (low)
                SINCE 2017(3)

                                     ~5.0%                                   ~10%
                                   YIELD ON                              TARGET DCF PER
                                 $1.32/SHARE                             SHARE GROWTH
                               ANNUAL DIVIDEND(1)

(1) Based on December 31, 2019 closing price of $26.59 per share and net debt as defined in Gibson’s MD&A and financial statements.
(2) Includes 1.5 million barrels under construction at Hardisty.
(3) Includes sanctioned Infrastructure growth capital and acquisitions.                                                                    2
Note: This and subsequent slides contain forward-looking statements – Please refer to the Forward-Looking Statements notice on slide 28.
Oil Infrastructure Focused
~75% of 2020E EBITDA from core Terminals & Pipelines and ~80% Infrastructure

                                                                                                                                         2020E EBITDA Breakout(1)

                                                                                     OILSANDS
                                                                                                                                                               ~75% Terminals and Pipelines
                                                                                                                                                                       ~80% Infrastructure

                          EDMONTON TERMINAL
                          1.7 mmbbl existing storage

                                                                                                                                             Marketing
                                                                                                                                             ~20%
                                                                                          VIKING
           EDMONTON
                            HARDISTY
                                                                                                                        Other
                                    MOOSE JAW                         HARDISTY TERMINAL                                 Infrastructure
                                                                      12 mmbbl existing storage                         ~5%
   MOOSE JAW FACILITY                                                 1.5 mmbbl under construction                                                                              Hardisty
                                                                                                                        Canadian and
   ~22 kbbl/d current capacity                                                                                                                                                  Terminal
                                                                                                                        U.S. Pipelines
                                                                      DRU(2)                                                                                                    ~60%
                                                                                                                        ~5%
                                                                      Customer Agreements for
                                                                      50 kbbl/d of inlet capacity
                                                                                                                                Edmonton
                                                                                                                                ~10%

                     PERMIAN      PYOTE
                                             PYOTE PIPELINE

(1) 2020E assumes long-term run rate for Marketing of $80 million to $120 million per year.
(2) Construction of DRU (Diluent Recovery Unit) remains subject to economics being fully underpinned with long-term, take-or-pay agreements and receipt of various permits and regulatory approvals.
                                                                                                                                                                                                       3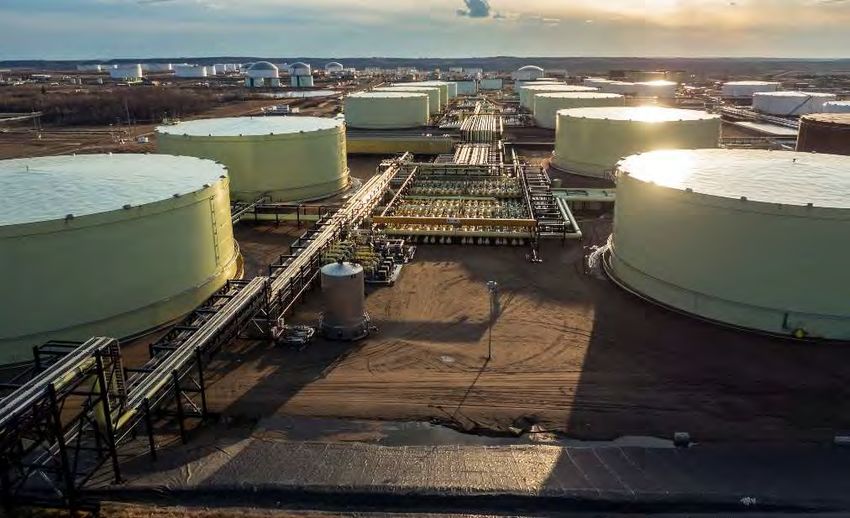
Focused Strategy
Premier oil infrastructure assets to underpin DCF per share and dividend growth
Leverage Terminals Position Complementary Growth
Terminals to represent ~70% of Target deploying at least $200 – $300
EBITDA(1,2) Oil million in Infrastructure capital per
Infrastructure year to reach target growth
Dominant market position at Hardisty Focus
Opportunities from the U.S. platform
Target sanctioning 2 – 4 tanks per and outside the fence in Canada to
year on a run-rate basis, with the supplement core tankage growth
potential for additional growth from
DRU development Target ~10% DCF
per Share Growth
Quality Cash Flows Strong Balance Sheet
~80% of EBITDA expected from Net Debt / Adj. EBITDA currently
Infrastructure (1,2) 2.6x, relative to 3.0x – 3.5x target(4)
Secure, Growing
~80% of EBITDA from stable, long- Fully-funded for all sanctioned
term take-or-pay or fee-for-service Dividend capital, with internal funding
contracts(1,2,3) capacity of approximately $400
million in 2020
Terminals EBITDA ~85% from
Investment Grade counterparties Investment grade credit ratings from
S&P: BBB– and DBRS: BBB (low)
(1) Refers to EBITDA before inclusion of finance lease costs and is not comparable to figures prepared prior to the application of IFRS 16.
(2) Based on 2020E and assumes long-term run rate Marketing contribution of $80 million to $120 million per year.
(3) Take-or-pay intercompany contracts currently represent approximately 20% of Infrastructure segment profit, with the proportion expected to decline over time. 4
(4) Calculated as Net Debt, less liability component of Convertible Debentures, divided by Adjusted EBITDA from Continuing Operations, as defined in Gibson’s MD&A for comparability with prior reporting.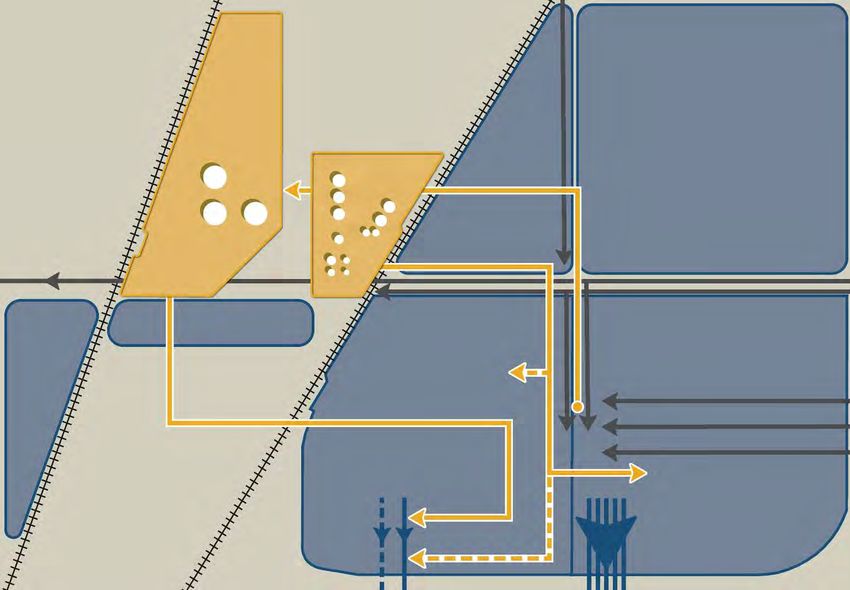
Complete Transformation of Business
Repositioned from diverse mix of business lines to focused energy infrastructure
                                                              2014(1,2)                                                2017(1,2)                                          2020E(2,3)

                                                                                                                                                                    ~75% Terminals &
                                          ~25% Terminals & Pipelines                               ~55% Terminals & Pipelines                                          Pipelines

 Segment
 EBITDA(1)
 From T&P and
 Infrastructure

                                                 ~30% Infrastructure                                      ~65% Infrastructure                                       ~80% Infrastructure

                                                   ~15% Take-or-Pay                                         ~45% Take-or-Pay                                        ~60% Take-or-Pay

 EBITDA(1)
 From Take-or-
 Pay or
 Stable Fee-
 Based

                                           ~30% Take-or-Pay or Stable                               ~65% Take-or-Pay or Stable                                  ~80% Take-or-Pay or
                                                  Fee-Based                                                Fee-Based                                             Stable Fee-Based
(1) 2014 and 2017 EBITDA adjusted for estimated finance lease payments to be comparable to 2020E under IFRS 16.
(2) Take-or-pay intercompany contracts currently represent approximately 20% of Infrastructure segment profit, with the proportion expected to decline over time.
(3) 2020E assumes long-term run rate for Marketing of $80 million to $120 million per year.
                                                                                                                                                                                          5
Hardisty Terminal – Best-in-Class Connectivity
Replicating Gibson’s competitive position not possible and cost prohibitive
Flexibility offered by Gibson’s existing best-in-class connectivity provides a wide moat at Hardisty
Key consideration for customers as it helps production volumes reach market at the best price
Leveraging existing interconnectivity results in cost advantage on new opportunities for Gibson relative to competitors
Gibson’s connectivity advantage built over decades and would be impossible to replicate today
Due to both cost and difficulties in securing connection agreements with competitors
Gibson has built all new third-party tankage placed into service in the last decade
Connections to Inbound Pipelines(1) Connections to Outbound Pipelines(1)
(total number) (total number)
12 12
10 10
8 8
6 6
4 4
2 2
0 0
GEI Peer A Peer B Peer C Peer D Peer E GEI Peer A Peer B Peer C Peer D Peer E
(1) Peers include Enbridge, Flint Hills, Husky, Inter Pipeline, and TransCanada (peers are not linked between charts). 6
Hardisty Terminal – Competitive Advantages
Replicating Gibson’s competitive position not possible and is cost prohibitive
Located at the heart of the Hardisty footprint
Land Position 240 acres of land holdings adjacent to existing tankage plus additional land surrounding
ensures decades of running room
Track record of placing new tankage into service on-time and on-budget
Cost Focus
Long useful life with limited maintenance capital required
Focused on terminal operation with primary objective of improving customers’ market
Independent access
No preference of where customers bring in or send their crude
Exclusive access to the only unit train rail terminal at Hardisty through joint venture with
USD
Rail Access Current capacity of over 180,000 bbl/d (>3 unit trains per day), with ability to expand
Development of the DRU would increase demand for rail access
7
Hardisty Terminal – Overview
Continue to grow at Hardisty at an attractive 5x – 7x EBITDA build multiple

                                                 COLD LAKE

N

                                     HARDISTY    TOP OF                                      Additional Phases
                                                THE HILL           Gibson connection to      Expect sanction run rate to remain at 2 – 4 per
    HARDISTY                           EAST                       180 mbbl/d rail facility
                                                                                             year based on current customer conversations
     WEST
                   HARDISTY
                   TERMINAL

                                                                         Phase 4 & Phase 4 Expansion
                                                                         Targeting Q4 2020 in-service

                                                                       PROVOST
                                                                                                12 mmbbl         1.5 mmbbl

                                                             TRANSCANADA
                                                             KEYSTONE / XL                                       1.5 mmbbl currently under
                                                                                                                 construction, representing
                                                                                                                 a ~12% expansion of the
       BELLSHILL                                                                                                 Terminal
                          ENBRIDGE
                           EXPRESS

                                                                                                 Existing
                                                                                                 Existing          Q4 2020
                                                                                                                   Q1 2020           Future
                                                                                                                                     Future
                                                                                                 Tankage
                                                                                                 Tankage       In-Service Date      Sanctions
                                                                                                                                    Sanctions

                                                                                                                                                8
DRU at Hardisty – On-Strategy Infrastructure
High-quality infrastructure project leveraging and extending Hardisty position
50%/50% joint venture between Gibson and U.S. Development Group (“USD”)
First DRU in Agreement in place with ConocoPhillips Canada for 50,000 bbl/d of inlet capacity, and in
Western discussions with other producers and refiners interested in DRU capacity
Canada
Construction remains subject to economics being fully underpinned with long-term, take-
or-pay agreements and receipt of various permits and regulatory approvals
Infrastructure required to support the long-term egress of oil sands production
Underpinned by a long-term, take-or-pay agreement with an investment grade customer
On Strategy
Leverages existing platform to attain target 5x – 7x EBITDA build multiple
Drives nearly a full year of targeted distributable cash flow per share growth
Further improves the Gibson Hardisty Terminal’s best-in-class connectivity, becoming the
Strengthens sole access point for DRU egress out of Western Canada
and Extends
Hardisty Customers at the DRU will require tankage at Gibson’s Hardisty Terminal
Platform
Extends contracted life at the Hardisty Unit Rail Facility
Believe that the first DRU to enter service will have a significant competitive advantage in
securing potential future expansions and providing an industry solution
Anticipate
Future Able to sanction in 50,000bbl/d increments, a good fit with brownfield oil sands projects
Expansions Provides additional confidence in the ability to continue to sanction growth at Hardisty
given the potential for further delays on alternative egress
9
DRU at Hardisty – Full Market Access Solution
Full market access solution to support construction of first DRU in Western Canada

        OIL SANDS                   1 Bitumen production from the oil sands shipped as
                                      dilbit via pipelines to Gibson’s Hardisty Terminal

         EDMONTON
                                                          DRU at Hardisty separates the majority of blended
               HARDISTY                                 2 condensate, creating DRUbitTM, a more concentrated
                                                          heavy oil specifically designed for rail transportation

                                                                        DRUbitTM loaded onto rail at the Hardisty Unit
                                                                    3
                                                                        Rail Facility

    The DRUbitTM is transported by rail to                                                   PORT ARTHUR TERMINAL
  4 the USD Port Arthur Terminal on the
    U.S. Gulf Coast                                                             N   PORT
                                                                                    ARTHUR        SABINE
                                                                                                  LAKE

    Once unloaded at USD’s Port Arthur
    Terminal, able to access the local refinery
  5
    market as well as a large network of refining
    and marine facilities via barge or tanker          PORT
                                                                                                      US GULF COAST
                                                      ARTHUR
                                                                                                                         10
DRU Hardisty – Location and Construction
Potential mid-2021 in-service at a cost of $200mm to $250mm net to Gibson(1)
Targeting in-service date as early as the second quarter of 2021
Total capital cost of the initial phase, net to Gibson, estimated to be between $200mm and $250mm (1)
Currently envision roughly two-third of spend to be incurred in 2020, with the remainder in 2021
Intend to secure a lump sum contract with performance guarantees for DRU facility to mitigate risk
Utilizes a standardized 50,000bbl/d inlet capacity DRU facility design to allow replication on future phases
Modularization where appropriate, allowing for fabrication where facilities and labor readily available
Hardisty Terminal and HURC Overview
ATHABASCA /
ATHABASCA TWIN
N DILBIT SENT ~4KM FROM HARDISTY TERMINAL TO
COLD LAKE / COLD THE HARDISTY UNIT TRAIN RAIL FACILITY
LAKE EXPANSION
DRU & HURC
~4KM
FACILITY
HARDISTY
CONDENSATE SEPARATED FROM DILBIT AT THE
TERMINAL DRU AND RETURNED TO THE HARDISTY TERMINAL
ENBRIDGE TC ENERGY
EXPRESS KEYSTONE
(1) Based on full Phase 1 inlet capacity of 100,000 bbl/d. Preliminary estimate of a single phase of 50,000 bbl/d would be roughly two-thirds the of total cost. 11Edmonton Terminal
Edmonton Terminal an attractive cash flow stream, although smaller scale
Edmonton Terminal benefits from advantageous positioning located next to two major refineries, access to both
the CN and CP railway lines and being near both major egress pipelines
Provides flexibility to offer both crude oil or refined products storage to customers
RAIL LINE SUNCOR
N RAIL LINE REFINERY
EDMONTON
TERMINAL
AOSPL
Waupisoo
KML / ENB and Access
COLD LAKE Connection Inbound COLD LAKE
PEACE PEACE
COLD LAKE
IMPERIAL
REFINERY ACCESS
CORRIDOR
Trans Mountain TRANS MOUNTAIN /
Connection(1) TRANS MOUNTAIN WAUPISOO
EXPANSION
ENBRIDGE
MAINLINE
(1) Trans Mountain Connection easily modified to connect to Trans Mountain Expansion once operational. 12U.S. Strategy
Seek to establish a platform for long-term infrastructure growth in the U.S.
CENTRAL BASIN Role in Portfolio
PLATFORM ADDITIONAL LEG PLAINS BASIN
N IN SERVICE Q3 2020 PIPELINE
Long-term goal to create an
WINK HUB
PLAINS / EXXON JV
additional platform for growth
MARATHON PERMIAN PIPELINE to help supplement tankage
WINK PIPELINE IN-SERVICE MID 2021 opportunities and sustain
momentum as existing base
EPIC PIPELINE becomes larger
IN-SERVICE Q1 2020
CONNECTION TO WINK HUB Current platform expected to
ENTERED SERVICE Q4 2019 PHILLIPS 66 GRAY OAK
PIPELINE IN-SERVICE Q1 2020
provide opportunity to deploy
up to $50 – $100 million per
ADDITIONAL LEG year, helping to drive corporate
IN SERVICE Q1 2020
FUTURE SYSTEM
growth
CONNECTION
Recent Progress
AREA OF
DEDICATION
Pyote East Pipeline, including
EXISTING PYOTE PIPELINE connectivity to third party
PYOTE EAST PIPELINE egress pipelines at Wink, placed
ENTERED SERVICE Q4 2019 into service on time and on
GEI Pipelines In Service
budget in October 2019
GEI Pipelines to be Commissioned
GEI Sanctioned Pipelines Recent agreements have
GEI Proposed Pipelines PLAINS CACTUS II increased dedicated acreage by
PIPELINE
Third Party Pipelines In Service nearly 200,000 acres
Third Party Pipelines Under Construction
Secured connections to several
egress pipelines at Wink
13Marketing Capabilities
Creates value for customers and drives volumes to Gibson’s Infrastructure assets
Refined Products leases the Moose Jaw Facility from the
Refined
Infrastructure segment, sourcing feedstocks and marketing the
Products refined products that are produced by the facility
Physically source hydrocarbons, providing increased liquidity and
Producer creating market access solutions for the company’s customers
Services
Drives volumes to both the Hardisty and Edmonton Terminals, as
Capabilities well as Gibson’s other infrastructure assets
Location, quality or time-based opportunities with focus on not
Asset being long or short on the underlying commodity or taking open
Optimization positions
14Segment Profit Outlook
Infrastructure to grow to ~80% of total segment profit by 2020E
Significant growth in the core Infrastructure segment over time, with a ~20% CAGR between 2011 and 2020E
Infrastructure expected to generate $300 – $320 million in segment profit in 2019E (1), $360 – $380 million in 2020E and
in excess of a $400 million run-rate by year-end 2020
Long-term run rate for Marketing segment profit estimated at $80 – $120 million
Segment Profit Outlook(2)
(C$ millions) Existing projects provide strong
$600
line of sight to sustained
Infrastructure growth through
$500 2020E
$400
$300
$200 Marketing Outperformance
Marketing Long-Term Run Rate(3)
$100 Divested Business
Core Infrastructure
$0 (1)
2011 2012 2013 2014 2015 2016 2017 2018 2019E 2020E 2021E 2022E 2023E
(1) 2019E Infrastructure Segment Profit excludes $15mm environmental provision reported in Q2 2019 and $11mm credit for the amendment of Gibson’s post-retirement benefits plan reported in Q3 2019.
(2) Segment profit illustratively adjusted for estimated finance leases under IFRS 16 for years 2017 and prior to improve comparability with current presentation. 15
(3) Long-term run rate for Marketing assumes $80 - $120mm per year going forward, where previously the range assumed was $60 - $80mm.Distributable Cash Flow Outlook
Sustained growth in core Infrastructure driving meaningful per share growth
Distributable Cash Flow With Illustrative Breakout By Business(1)
(C$ millions)
$400
Line of sight to delivering DCF $2.50
CAGR of ~10% between
2017A and 2020E…
$2.00
$300
…with future project
$1.50
sanctions expected to drive
attractive long-term growth
$200
per share
$1.00
Marketing Outperformance
$100
Marketing Long-Term Run Rate(2) $0.50
Divested Business
Core Infrastructure
$0 $0.00
2017A 2018A 2019E 2020E 2021E 2022E
(1) Distributable Cash Flow not reported on a segment basis. Segment breakout of Distributable Cash Flow presented for illustrative purposes assuming Corporate G&A, interest, and maintenance capex are
fully deducted from Infrastructure segment profit. Marketing shown net of lease costs and tax expenses.
16
(2) Long-term run rate for Marketing assumes $80 - $120mm per year for 2019 forward, where previously the range assumed was $60 - 80mm.Strong Financial Position
Leverage and payout ratio currently below target ranges
Obtained two Investment Grade ratings in 2019
New rating of BBB (low) with stable trend from DBRS
Upgraded to BBB- with stable outlook by S&P
Long-term funding model and continued delivery of the strategy is not contingent on cyclical cash flows
Projects sanctioned and under construction provide visibility to remaining within target leverage and payout ranges
Net Debt / Adj. EBITDA(1) Payout Ratio
(x) 120% (%)
5.0x
100%
4.0x
80%
3.0x
Targeting long-term 60%
Targeting long-term
2.6x at leverage of 3.0x – 3.5x 60% at payout of 70% to 80%
2.0x Q3 2019 Q3 2019
40%
1.0x
20%
0.0x 0%
2017A 2018A 2019E 2020E 2021E 2022E 2017A 2018A 2019E 2020E 2021E 2022E
(1) Calculated as Net Debt, less liability component of Convertible Debentures, divided by Adjusted EBITDA from Continuing Operations, as defined in Gibson’s MD&A for comparability with prior reporting. 17Contract Quality & Balance Sheet Comparison
Attractive contract quality and best-in-class leverage relative to peer group
Proportion Take-or-Pay & Fee-for-Service(1) Net Debt / 2018A EBITDA(2)
(%) (x)
100% 6.0x
80%
4.0x
60%
40%
2.0x
20%
0% 0.0x
Peer A Peer B GEI Peer C Peer A Peer B Peer C GEI
(1) Gibson Proportion Take-or-Pay & Fee-for-Service based on 2020E and assumes a long-term run rate for Marketing of $80 million to $120 million per year; Peer Proportion Take-or-Pay & Fee-for-Service
per most recent public disclosure as at December 31, 2019.
(2) Senior Debt Ratio as shown in Gibson’s MD&A. in Gibson’s MD&A; Peer ratios per public disclosure. 18
Note: Peers include Inter Pipeline, Keyera and Pembina (peers are not linked between charts).Governing Principles
Committed to maintaining a strong financial position by managing to key targets
Committed Target Performance
High Quality
>80% segment profit from take-or-pay and high-
Contract
Cash Flows
~80% by 2020E(1)
Quality of
quality fee-for-service contracts
Structure
Creditworthy >85% of exposures under long-term contracts Reached 85% in 2018
Counterparties are with investment grade counterparties
Strong
Net Debt / Adjusted EBITDA of 3.0x – 3.5x(2) 2.6x at Q3 2019
Flexibility
Financial
Balance Sheet
Maintain &
S&P: BBB- rating
Improve Secured Two Investment Grade ratings
DBRS: BBB (low) rating
Credit Ratings
Capital Funding Fund growth capital expenditures with Capital program fully-funded
Strategy maximum 50% – 60% debt
Funding
Model
Sustainable Sustainable long-term payout of 70% – 80% of DCF
60% at Q3 2019
Payout Ratio Infrastructure cash flows cover 100% of payout ratio
(1) 2020E based on a long-term run rate for Marketing of $80 million to $120 million per year and includes internal contracts.
(2) Calculated as Net Debt, less liability component of Convertible Debentures, divided by Adjusted EBITDA from Continuing Operations, as defined in Gibson’s MD&A for comparability with prior reporting. 19Funding Position Through 2020
Fully-funded for all sanctioned capital, with capacity to fund incremental growth
2018 & 2019 Sources and Uses(1,2) 2020 Sources and Uses (1,2,3)
(C$ millions) (C$ millions)
Meaningfully strengthened …leading to internal funding capacity
the balance sheet in 2018 of approximately $400 million of
Disposition Proceeds and 2019… infrastructure growth in 2020.
2019 Growth Capital
2019 Retained DCF Further Capacity to
& Associated 2020 Retained DCF
& Associated Fund Capital in 2020+
Leverage
Leverage
2020 Growth
2018 Retained DCF 2018 Growth Capital 2018-2019 Capital
& Associated Carry-Over
Leverage
1 2 3 1 2 3
2018 & 2019 DCF & Leverage $800 - $875 2018 & 2019 Carry-Over $225 - $275
Proceeds from Dispositions 325 - 325 2020 DCF & Leverage 325 - 400
Total Sources $1,125 - $1,200 Total Sources $550 - $675
Dividends (380) - (380) Dividends (190) - (190)
Growth Capital (525) - (550) Growth Capital (275) - (325)
Total Uses ($900) - ($925) Total Uses ($475) - ($525)
Funding Surplus $225 - $275 Funding Surplus $75 - $150
(1) Assumes target leverage of 50-60% on Infrastructure investment.
(2) Illustrative funding analysis may not be additive to maintain narrower aggregate ranges. 20
(3) Assumes long-term run rate for Marketing of $80 - $120mm.Growth Capital Outlook
Long-term target of $200 to $300 million of Infrastructure growth per year
Contract Structure Investment Outlook
Hardisty & Long-term take-or-pay and stable fee- 2 – 4 tanks per year
based, with weighted average remaining $20 – 30mm per year inside the fence
Edmonton
contract life of nearly 10 years $100 – 200mm per year total, with
Terminals ~85% Investment Grade counterparties upside from development of DRUs
Long-term area of dedication Extend reach of Pyote system
Majors, mid-majors and PE backed Seek additional regional opportunities
US Strategy entities Potential Wink Hub opportunities
Up to $50 – 100mm per year
Long-term stable fee-based; varies by play Likely to sanction a project every few
Outside the Seek to underpin with take-or-pay and/or years
Fence area of dedication; varies WCSB opportunities more limited
Canada Size of counterparties depends on play $0 – 50mm per year
Total Corporate >80% Long-Term, stable fee based Long-term target of ~$200 - $300mm
21Long-Term Capital Allocation Priorities
Near-term focus on remaining fully-funded; steady dividend growth longer-term
Target payout ratio of 70% – 80% over the long-term
Fund Dividend
Fund the Business
Dividend to be fully covered by stable, long-term Infrastructure cash flows
Significant value creation through investment in long-term
Fund Infrastructure infrastructure with high-quality contracts and counterparties
Growth Expect to deploy capital at 5x – 7x EBITDA, with a focus on ensuring
appropriate risk adjusted returns when allocating capital
Absent near-term Infrastructure investment opportunities,
surplus cash flows from Marketing best returned to
Share Buybacks shareholders via share buyback rather than dividend
Return Capital to
Shareholders
Not expected in near-term given current opportunity outlook
Intention to provide steady, long-term dividend growth
to shareholders
Dividend Growth
Pace of dividend growth to be driven in part by outlook
for capital growth to ensure fully-funded position
22Key Takeaways
Continue to deliver on all facets of the strategy, with visibility to further growth
Delivery Since January 2018 Investor Day Go Forward Deliverables
Target investing $200mm – $300mm per year
Sanction 2 – 4 Tanks
Infrastructure
2 – 4 tanks per year on a run-rate basis
per Year (vs. 1 – 2)
Growth
Up to $50mm – $100mm per year in U.S.
Sanction Infrastructure
Infrastructure Growth $50mm in Canada outside the fence
Outside Terminals Upside growth from DRU development
Divest Non-core
Focused Asset
Assets
Continue to target investment solely into
Base
Infrastructure
Focus Capital on Remain focused on organic opportunities
Infrastructure Growth
Reduce Leverage &
Strong Balance
Leverage to remain with target 3.0x – 3.5x Debt /
Payout EBITDA range longer term
Sheet
Maintain payout of 70% – 80%, growing dividend only
Fund Capital Growth when fully underpinned by Infrastructure
Internally Remain fully-funding for all sanctioned growth
23APPENDIX
2020 Capital Expenditure Budget
Expected to be in the range of $275 million to $325 million
Capital Outlook Expect to sanction 2 to 4 tanks a year on run-rate
basis in current environment
Expect $275 – $325 million of Growth Capital in
2020 Total DRU capital cost of the initial 100,000 bbl/d
Total (1)
$300 phase, net to Gibson, estimated to be in the range
of $200 – $250 million
Hardisty Terminal(2,3) $220 Preliminary estimate of a single phase of 50,000
Edmonton Terminal $20 bbl/d would be roughly two-thirds the of total
cost
U.S. Infrastructure $50
Currently envision roughly two-third of spend to
Other $10 be incurred in 2020, with the remainder in 2021
Expect $25 million of Upgrade and Replacement
Capital in 2020
Expect to deploy $20 – $30 million per year on
“inside the fence” opportunities at Terminals
Continue to advance commercial opportunities in
both Canada and the US
(1) Individual categories not additive to total to maintain a narrower aggregate range.
(2) DRU capital based on currently contracted 50,000 bbl/d of inlet capacity.
(3) Construction of the DRU remains subject to certain conditions, including obtaining agreements to underpin the economics of the project and receipt of required regulatory approvals, including from the 25
Alberta Energy Regulator.
.Capital Funding Approach and Maturity Profile
Disciplined funding approach to ensure strong financial position
Long-Term Funding Approach Maturity Profile(1)
$800 (C$ millions)
on ≈
3.0x – 3.5x 5.0x – 7.0x 50% – 60% Senior Unsecured
TARGET CORPORATE EBITDA BUILD TARGET LEVERAGE ON 5.250% Notes
DEBT/EBITDA INFRASTRUCTURE $600 Senior $560mm Credit Facility Senior
MULTIPLE
≈ at GROWTH ($0mm Drawn)(2) Unsecured
3.60%
Notes
Implied Capital Targets on Infrastructure Growth $400
Run-Rate Target
Capital Implied Required
EBITDA Leverage on
Deployed Leverage Retained DCF
at 5x - 7x Investment
(C$mm) (C$mm) (C$mm) (x) (C$mm)
$200 Unsecured
$200 $30 - $40 $100 - $120 3.0x - 3.5x $80 - $100
5.250%
Convertible
$250 $35 - $50 $125 - $150 3.0x - 3.5x $100 - $125
Debenture
$300 $45 - $60 $150 - $180 3.0x - 3.5x $120 - $150
$350 $50 - $70 $175 - $210 3.0x - 3.5x $140 - $175
$0
2019E 2020E 2021E 2022E 2023E 2024E
2024E 2029E
(1) Redemption Notice delivered to holders of the 2022 Notes on September 17, 2019. The Company redeemed all of the 2022 Notes on October 17, 2019. 26
(2) Floating rate revolving credit facility; drawn balance as at September 30, 2019.Infrastructure Growth Capital
Invested $1.75B in Infrastructure 2011-2020E, including 11.5 mmbbl of tankage
Infrastructure Growth Capital Expenditure 2011A - 2020E
(C$ millions) 2020E
2019E $275 - $325
~$250 - $280
$243
$221 $219
$184
$147
$101
$62
$41
2011A 2012A 2013A 2014A 2015A 2016A 2017A 2018A 2019E 2020E
2 Tanks, 0.6 mmbbl
2 Tanks, 0.6 mmbbl
2 Tanks, 0.8 mmbbl
3 Tanks, 1.2 mmbbl
2 Tanks, 0.6 mmbbl
5 Tanks, 2.3 mmbbl
2 Tanks, 0.8 mmbbl
3 Tanks, 1.1 mmbbl
Viking Pipeline, ~120 km
Pyote East Pipeline, ~25 km
4 Tanks, 2.0 mmbbl
Infrastructure Placed Into Service
3 Tanks, 1.5 mmbbl
Infrastructure Under Construction
DRU, In-Service 2021
27Forward-Looking Statement Notice
Certain statements contained in this presentation constitute forward-looking information and statements (collectively, “forward-looking statements”) including, but not limited to, management’s expectations with respect to the business and
financial prospects and opportunities of Gibson Energy Inc. or its subsidiaries (“Gibson” or the “Company”), forecast operating and financial results of Gibson and its respective business segments for year end 2020 and future periods, business
and funding strategy and plans of management (including targeted timing), anticipated growth (including segment growth and annualized growth rate projections) and the sources of financing thereof, allocation of capital, capital investment and
the amount, sources and timing thereof, objectives of or involving Gibson, expectations of future market conditions, expectations regarding existing and future counterparties, capital allocation, and sources thereof, competitive position, capital
targets, pipeline expansion opportunities and areas for potential growth and costs and timing thereof, the anticipated in-service dates of various projects, including but not limited to Hardisty top of the hill expansions, the Pyote pipeline
extension and connection to Wink, TX, the sanction and construction of the Hardisty DRU Project, Gibson’s ability to grow its U.S. business and the timing thereof, Gibson’s ability to sanction additional tankage, anticipated impact of commodity
prices, projections for 2020 and future years and Gibson's plans and strategies to realize such projections, expectations and targets for segment operations, growth capital, fixed charges, refined product sales, segment profit and contribution to
EBITDA and cash flows, EBITDA, cash flows, distributable cash flow, debt and net debt to Adjusted EBITDA ratios, payout ratio, anticipated leverage, nature of parties contracting with Gibson and contract life, increased crude oil production and
exploration activity on shore in North America, including from the Canadian oil sands, management’s expectations with respect to a share buyback ability to pay dividends and the amount and sources of dividend payments and Gibson's
anticipated market share.
These statements relate to future events or the Company’s future performance. All statements other than statements of historical fact are forward-looking statements. The use of any of the words ‘‘anticipate’’, ‘‘plan’’, ‘‘contemplate’’,
‘‘continue’’, “aim”, “target”, “must”, “commit”, ‘‘estimate’’, ‘‘expect’’, ‘‘intend’’, ‘‘propose’’, ‘‘might’’, ‘‘may’’, ‘‘will’’, ‘‘shall’’, ‘‘project’’, ‘‘should’’, ‘‘could’’, ‘‘would’’, ‘‘believe’’, ‘‘predict’’, ‘‘forecast’’, ‘‘pursue’’, ‘‘potential’’ and ‘‘capable’’ and
similar expressions are intended to identify forward-looking statements. The forward looking statements reflect Gibson's beliefs and assumptions with respect to, among other things, general economic trends, industry trends, commodity prices,
capital markets, the governmental, regulatory and legal environment in the various jurisdictions in which Gibson's conducts and will conduct its business, Gibson's ability to obtain qualified personnel, owner-operators, lease operators and
equipment in a timely and cost-efficient manner or at all, Gibson's ability to generate sufficient cash to meet its current and future obligations, achievability of leverage and payout targets and timing thereof, the number of oil sands projects
sanctioned and storage days producers require, Gibson's ability to obtain financing for its capital programs on acceptable terms or at all, the successful and timely implementation of capital projects in a manner consistent with financial
expectations, expectations regarding the sources of funding of growth initiatives, Gibson’s financial results for year end 2020, Gibson’s ability to generate sufficient cash flow to meet Gibson’s current and future obligations, Gibson's future debt
levels, Gibson’s dividend policy, Gibson’s ability to grow its U.S. business in a manner consistent with expectations, Gibson’s ability to complete all anticipated divestiture transactions on acceptable terms, product supply and demand including
demand for tankage, costs, and other assumptions inherent in management’s expectations of future operating and financial results of Gibson and its respective business segments and other forward-looking statements identified herein.
Forward-looking statements involve known and unknown risks, uncertainties and other factors that may cause actual results or events to differ materially from those anticipated in such forward-looking statements. Although the Company
believes these statements to be reasonable, no assurance can be given that these expectations will prove to be correct and such forward-looking statements included in this presentation should not be unduly relied upon. The Company’s actual
results could differ materially from those anticipated in these forward-looking statements as a result of, among other things, risks inherent in the businesses conducted by Gibson, regulatory decisions, competitive factors in the industries in
which the Company operates, prevailing economic conditions, the number of oil sands projects sanctioned and storage days producers require world-wide demand for crude oil and petroleum products, volatility of commodity prices, currency
and interest rates fluctuations, product supply and demand including demand for tankage, risk that actual financial results for the fiscal year ending December 31, 2020 may be different from the estimates disclosed herein, changes in credit
ratings applicable to Gibson, operating costs and the accuracy of cost estimates, exposure to counterparties and partners, including ability and willingness of such parties to satisfy contractual obligations in a timely manner, future capital
expenditures, Gibson's ability to obtain necessary regulatory approvals, the successful and timely implementation of capital projects or stages thereof, changes to Gibson's business plans or strategy, Gibson’s ability to access various sources of
debt and equity capital, generally, and on terms acceptable to Gibson, Gibson’s ability to complete anticipated divestiture transactions on acceptable terms, Gibson’s ability to finance growth and sustaining capital expenditures, changes to
Gibson’s dividend plans or strategy and other factors, many of which are beyond the control of the Company. Readers are cautioned that the foregoing lists are not exhaustive. For a full discussion of our material risk factors, see “Risk Factors” in
the Company’s Annual Information Form dated March 4, 2019 as filed on SEDAR and available on the Gibson website at www.gibsonenergy.com.
The purpose of the estimated year end 2020 financial information contained herein including but not limited to, estimates for such period, and future periods, of distributable cash flow and sources thereof, segment EBITDA, sources of EBITDA,
capital allocations, segment profit and net debt to EBITDA ratios, is to assist investors, shareholders, and others in understanding certain financial metrics relating to expected year end 2020 financial results for the purpose of evaluating the
performance of Gibson's business for such period and future periods. This information may not be appropriate for other purposes. Gibson has not completed its financial review process and related assessments for the fiscal year ending
December 31, 2019. The results and conclusions of these assessments, along with the known and unknown risks, uncertainties and other factors referred to above and described in Gibson's publicly available securities laws filing available at
www.sedar.com, could impact Gibson's estimates, and actual financial results, for the fiscal year ending December 31, 2020 and the information related to such period and future periods contained herein and any such impact could be material.
Segment profit, EBITDA, Adjusted EBITDA and distributable cash flow information presented for year end 2019 and onwards in the presentation excludes any impact of early adoption of IFRS 16 – Leases.
The forward-looking statements contained in this presentation represent the Company’s expectations as of the date hereof, and are subject to change after such date. The Company disclaims any intention or obligation to update or revise any
forward-looking statements whether as a result of new information, future events or otherwise, except as may be required by applicable securities laws.
This presentation contains statistical data, market research and industry forecasts that were obtained from government or other industry publications and reports or based on estimates derived from such publications and reports and
management’s knowledge of, and experience in, the markets in which the Company operates. Government and industry publications and reports generally indicate that they have obtained their information from sources believed to be reliable,
but do not guarantee the accuracy and completeness of their information. Often, such information is provided subject to specific terms and conditions limiting the liability of the provider, disclaiming any responsibility for such information,
and/or limiting a third-party’s ability to rely on such information. None of the authors of such publications and reports has provided any form of consultation, advice or counsel regarding any aspect of, or is in any way whatsoever associated
with this presentation. Actual outcomes may vary materially from those forecast in such reports or publications, and the prospect for material variation can be expected to increase as the length of the forecast period increases. While
management believes this data to be reliable, market and industry data is subject to variations and cannot be verified due to limits on the availability and reliability of data inputs, the voluntary nature of the data gathering process and other
limitations and uncertainties inherent in any market or other survey. Accordingly, the accuracy, currency and completeness of this information cannot be guaranteed. The Company has not independently verified any of the data from third-party
sources referred to in this presentation or ascertained the underlying assumptions relied upon by such sources. This presentation may also contain references to non-GAAP measures. These measures have been described and presented in order
to provide shareholders and potential investors with additional information regarding Gibson’s liquidity and its ability to generate funds to finance its operations. Readers are encouraged to review our most recent Management’s Discussion and
Analysis, available at www.gibsonenergy.com for a full discussion of the use of each measure.
28You can also read