Securing profitable growth in more challenging times - Roadshow presentation - Covestro Investor Relations

Page created by Elizabeth Woods
 
CONTINUE READING
Securing profitable growth in more challenging times - Roadshow presentation - Covestro Investor Relations
Securing profitable growth
in more challenging times
Roadshow presentation

covestro.com    Q1 2019 │IR Roadshow Presentation
Securing profitable growth in more challenging times - Roadshow presentation - Covestro Investor Relations
Securing profitable growth in more challenging times
Covestro key investment highlights

       Above GDP volume growth
          driven by innovation and sustainability trends, also embodied by non-financial targets

       Leading and defendable global industry positions
          as innovation and cost leader

       More than half of sales generated by resilient businesses
          supporting value-creating base earnings

       Management focus on driving efficiency
          with streamlined structures to better adapt to market needs, focus on cost discipline and new incentive targets

       Use of cash focused on shareholder value
          with commitment to progressive dividend policy and focused capex for best value-creation

2          Q1 2019 │ IR Roadshow Presentation
Securing profitable growth in more challenging times - Roadshow presentation - Covestro Investor Relations
Global leader in high-tech material solutions
Covestro at a glance

Sales split by segments                                         Sales split by regions                                                      Sales split by end-markets
% of 2018 Group sales                                           % of 2018 Group sales                                                      % of 2018 Group sales
                                                                Core volume growth in %, CAGR 2015-2018

                                                                                                                                              Sports / Leisure,
                                                                                                                                                                                             Automotive /
                                                                           China                                                             Cosmetics, Health,
                 CAS                       Polyols                                                                                                                                          Transportation
                                                                            21%                                                              diverse industries
                        16%          ~20%                                                                                                                                               20%
                                                                                                                         EMLA                                     26%
                                                                                                                          43%
                                                                      APAC
                                                                       33%                  GLOBAL
                                                          PUR
                                             ~20% MDI                                      Vol. +4.1%                                                                                         18%       Wood/
               28%                                                                                                                                             8%
        PCS                                                                                                                                   Chemicals                                                Furniture

                                                                                                                                                                    12%
                              5%   ~10%                                                                              Germany                                                      16%
                                                                                                                                                       Electrical/
                                       TDI                                                                             12%
                         Other                                                  US                                                                     Electronics
                                                                                                                                                                                  Construction
                                                                               19%
                                                                                                 NAFTA
                                                                                                  24%

                     €14.6bn Sales                                                     ~5 million tons                                                      Employees ~16,800 FTEs
       Driven by innovation and sustainability trends                        PUR and PCS nameplate capacity                                             Headquarters in Leverkusen, Germany

3                    Q1 2019 │ IR Roadshow Presentation          Notes:   Based on Covestro Annual Report 2018; EMLA = Europe, Middle East, Africa, Latin America; NAFTA = USA, Canada, Mexico; APAC = Asia, Pacific
Securing profitable growth in more challenging times - Roadshow presentation - Covestro Investor Relations
Industries grow above global GDP
Structural growth drivers

UN SDGs(a)                                                           Needs to be served                                           Industry demand outlook(b) 2018e – 2023e
    related to climate change:                                                                                                                       ('000kt)                  CAGR

                                                                       • Zero emission concepts                                                                  17.6           4-5%
                                                                                                                                                                                               ~21.9
                                                                       • Low-energy buildings

                                                                                                                                            PU(c)
    related to increasing mobility:                                                                                                                             2018e                          2023e
                                                                       • Energy-efficient mobility
                                                                       • Lightweight transportation                                                                            CAGR
                                                                       • E-mobility, autonomous driving                                                                                          ~5.5
                                                                                                                                                                  4.5           ~4%

                                                                                                                                            PC
    related to growing population:
                                                                       • Food preservation
                                                                       • Low-cost durable goods                                                                 2018e                          2023e
                                                                       • Medical applications
                                                                                                                                                                               CAGR
                                                                                                                                                                                                 ~4.2
    related to increasing urbanization:                                                                                                                           3.4           ~4%

                                                                                                                                            CAS(d)
                                                                       • Affordable housing
                                                                       • Living comfort
                                                                       • Public infrastructure
                                                                                                                                                                2018e                          2023e

4                     Q1 2019 │ IR Roadshow Presentation   Notes:   (a) Most impacted goals out of 17 Sustainable Development Goals, set by the United Nations’ “2030 Agenda for Sustainable Development”
                                                                    (b) Assumes global GDP CAGR 2018–2023e of 2-3% as per Covestro estimates; (c) Comprises MDI, TDI and polyether polyols
                                                                    (d) Shows PU raw materials industry demand in coatings, adhesives and sealants (excl. architectural/textile coatings and solvent-borne polyacrylates);
                                                                    additionally TPU, elastomers and PC/TPU films
Securing profitable growth in more challenging times - Roadshow presentation - Covestro Investor Relations
Non-financial ambition supports growth strategy
Covestro non-financial targets 2025

       Our R&D project portfolio is aligned with UN Sustainable Development Goals

       100% of suppliers compliant with our sustainability requirements

       Reduce specific greenhouse gas emissions by 50% by 2025

       Ten million people in underserved markets benefit from our business solutions

       Getting the most out of carbon

5          Q1 2019 │ IR Roadshow Presentation
Securing profitable growth in more challenging times - Roadshow presentation - Covestro Investor Relations
Product innovation as long-term growth driver
Addressing ever-changing customer needs for new material solutions

Need                                         Overall market                 Relevant market                            Covestro solutions

More durable and economical                  Energy consumption             Offshore wind energy                       Novel materials for wind power plants: PU resins for rotor blades, PU-based
wind power plants                            CAGR: ~3%                      CAGR: ~19%                                 coatings, elastomers for sea cables

Energy- and cost-efficient                   Construction                   Polyurethane insulation                    Raw materials for PU foam (rigid and in spray form) enabling highly efficient
buildings                                    CAGR: ~2%                      CAGR: ~5%                                  insulation

Reduction of high energy                     Luminaire                      Luminaire LED
                                                                                                                       Polycarbonates in LED lenses, light guides, heat sinks
consumption of lighting                      CAGR: ~3%                      CAGR: ~12%

Eco-friendly produced                        Coating ind. furniture         Water-based ind. furniture
                                                                                                                       New bio-based hardener for water-based wood coatings
furniture                                    CAGR: ~3%                      CAGR: ~5%

Sustainable and functional                   Textile coating                Relevant textile coating                   Waterborne, solvent-free materials for functionalized textiles in diverse
fashion                                      CAGR: ~6%                      CAGR: ~11%                                 applications

More and better cooling                      Refrigerators                  Refrigeration insulation foam              Raw materials for particularly effective insulating foams: 40% smaller pores
devices                                      CAGR: ~3%                      CAGR: ~8%                                  allow up to 10% better insulation

Reduced weight and                           Global car production          Relevant car applications                  Attractive alternatives to conventional materials: polymers to replace glass
increased comfort                            CAGR: ~3%                      CAGR: ~5%                                  and metal

6                  Q1 2019 │ IR Roadshow Presentation            Sources:    Covestro CMD 2017 presentation “Innovation”, pages 6-13
Securing profitable growth in more challenging times - Roadshow presentation - Covestro Investor Relations
Global leader across its entire portfolio
Production capacities and world-wide industry positions

                                                               #1 in Polyurethanes                                            #1 in Polycarbonates                                  #1 in Coatings, Adhesives, Specialties

                                                                                                                                                                                Aliphatic                         Polyurethane
                                           MDI                              TDI             Polyether polyols                               PC                                isocyanates                          dispersions
    Capacity share in 2018(a)

                                       Others                                                                                                                                       Others
                                        11%                        Others                                                           Others                                           13%
                                                                    25%                   Others                                     21%                                                                                  17%
                                                                                  29%                                                                   29%
                                                                                           50%                                                                                                 49%
                                                                                                                 12%                                                                                     Others
                                                                                                                                                                                                          58%

                                          18%

                                      Top 5: 89%                     Top 5: 75%                   Top 5: 50%                         Top 5: 79%                               Top 5: 87%                          Top 5: 39%
                                2023e: Top 5 share            2023e: Top 5 share         2023e: Further                     2023e: Top 5 expected                 2023e: Industry structure                2023e: Industry structure
                                expected to remain stable     expected to remain         consolidation expected,            to account for ~60%                   expected to remain stable                expected to remain stable
                                at 90%                        broadly stable at 73%      especially in China

                                                                                                                                                                   Entry requirements
                                       Global #3                      Global #1                    Global #2                          Global #1
    Covestro(a)

                                                                                                                                                                   • Economies of scope
                                                                                                                                                                   • Formulation and application know-how
                                        1,470kt                          775kt                      1,350kt                              1,490kt                   • Close customer relationships and long-term
                                                                                                                                                                     R&D collaborations
                                         6 sites                        3 sites                     9 sites                              5 sites                   • Operation of global business platform

7                                           Q1 2019 │ IR Roadshow Presentation          Note:      (a) Based on total nameplate capacity at year end 2018 relative to competitors
                                                                                        Source:    Covestro estimates
Securing profitable growth in more challenging times - Roadshow presentation - Covestro Investor Relations
Leading cost positions across business segments and regions
Cash cost positions

         North America                                                    Europe                                                                                                   Asia                                                                 Highlights
         Cash cost                                                        Cash cost                                                                                                Cash cost

                                                                                                                                                                                                                                                         • Covestro is one of the low-cost
                                                                                                                                                                                                                                                           producers in MDI
MDI(a)

                                                                                                                                                                                                                                                         • Capex for ongoing MDI

                                                                                                                                                                                       leader
                                                                                                                                                                                      Chinese

                                                                                                                                                                                                                Chinese
                                                                                                                                                                                                                laggard

                                                                                                                                                                                                                                              (landed
                                                                                                                                                                                                                                               China)
                                                                                                 Covestro
                                                                                                Uerdingen

                                                                                                                                                                                                                                            ME player
                                               North
                                           American
                                            follower

                                                                North
                                                             American
                                                              laggard

                                                                                                                Tarragona

                                                                                                                                                                                                                             Asian
                                                                                                                                                                                                                           laggard
                                                                                leader

                                                                                                                 Covestro
                                                                             European

                                                                                                                                   Covestro

                                                                                                                                                  European
                                                                                                                                                    laggard

                                                                                                                                                                       ME player
                                                                                                                                                                    (landed WE)
                                                                                                                                Brunsbuettel
               Covestro
               Baytown

                                                                                                                                                                                                    Covestro
                                                                                                                                                                                                     Caojing
                                                                                                                                                                                                                                                           expansion projects lead to
                                                                                                                                                                                                                                                           significant cash cost
                                                                                                                                                                                                                                                           improvements
                                                                                                                                                                                                                                                         • MDI industry with relatively flat
                                                                                                                                                                                                                                                           cost curves reflected by cash
                                                                                                                                                                                                                                                           cost advantage of ~20%
TDI(a)

                                                                                                                                                                                                                                                           between the best and the

                                                                                                                                                                                                    Chinese
                                                                                                                                                                                                    follower

                                                                                                                                                                                                                 (landed
                                                                                                                                                                                                                  China)

                                                                                                                                                                                                                           Chinese
                                                                                                                                                                                                                           laggard
                                                           North

                                                                                                                                                                                                               ME player
                                                       American
                                                        follower

                                                                                                                                                                                                                                               Asian
                                                                                                                                                                                                                                             laggard
                                                                                  Covestro
                                                                                 Dormagen

                                                                                                                                                                 ME player
                                                                                                                                                              (landed WE)
                                                                                                            European

                                                                                                                                      European
                                                                                                                                        laggard
                          Covestro
                          Baytown

                                                                                                                                                                                      Covestro
                                                                                                                                                                                       Caojing
                                                                                                                                                                                                                                                           average of 5 least competitive

                                                                                                             follower
                                                                                                                                                                                                                                                           plants
                                                                                                                                                                                                                                                         • Covestro is the global cost
                                                                                                                                                                                                                                                           leader in TDI and PCS
                                                                                                                                                                                                                                                         • Covestro cash cost advantage
                                                                                                                                                                                                                                                           of ~50% in TDI and ~30% in
PCS(b)

                                                                                                                                                                                                                                                           PCS compared to the average

                                                                                                                                                                                         Covestro
                                                                                                             Covestro
                                                                                                            Uerdingen

                                                                                                                                                                                                                                               Asian
                                                                                                                                                                                                                                             laggard
                                               North
                                           American
                                            follower

                                                                North
                                                             American
                                                              laggard

                                                                                                                                                                                      Map Ta Phut
                                                                                    ME player
                                                                                 (landed WE)

                                                                                                                                      European
                                                                                                                                       follower

                                                                                                                                                              European
                                                                                                                                                                laggard

                                                                                                                                                                                                      Asian
                                                                                                                                                                                                    follower

                                                                                                                                                                                                                           (landed China)
               Covestro
               Baytown

                                                                                                                                                                                                                Covestro
                                                                                                                                                                                                                 Caojing

                                                                                                                                                                                                                                ME player
                                                                                                                                                                                                                                                           of 5 least competitive plants

              Cash cost improvements based on investment projects

8                                    Q1 2019 │ IR Roadshow Presentation                            Notes:                   (a) Cost of production based on total raw material costs less co-product credits, variable and fixed conversion costs at 100% utilization based
                                                                                                                                on nameplate capacity for FY 2017
                                                                                                                            (b) FY2017 Cash cost ex gate, 82% utilization rate for all plants based on nameplate capacity; integrated players are shown without any margins
                                                                                                                                for BPA, phenol, acetone, etc.
Securing profitable growth in more challenging times - Roadshow presentation - Covestro Investor Relations
Synergies in scale, process technology and chemical know-how
One chemical backbone across all segments

    Infrastructure             Raw Materials                                     Core Units / Technology                                                          Final product

                                                                                                                                                                      Phosgene(d)
                                                                                                                  DNT                        TDA
                                              Toluene                                                        Dinitrotoluene             Diaminotoluene                  TDI                   Highlights
                                                                                                                                                                                              • State-of-the-art asset base
                                                                                                                                                                                                with leading process
    • Premises                         Nitric Acid (HNO3)                                                                                                                                       technology
    • Site                                                                                                                                                                                    • 8 main sites with world-
      development                                                                     MNB
                                                                                                                                                                      Phosgene(d)
                                                                                                                                                                                                scale production facilities
                                                                                                                Aniline                      MDA
    • Streets                                 Benzene                            Mono-Nitrobenzene                                    Methylene Dianiline               MDI                   • Critical raw materials with
                                                                                                                                                                                                no or limited merchant
    • Pipeline                                                                                                                                                                                  market sourced internally
      bridges                                          Propylene                                                                                                    Polyether                 • Synergies at all steps along
                                 Propylene                                                                                                                           Polyols
    • Storage tanks                                      Oxide                                                                                                                                  the value chain
    • Jetties                                                                                                                                                                                 Sales volumes 2018
                                 e.g. via            Hydrogen (H2)
    • Power supply               reformer        Carbon Monoxide (CO)                                                                                                                         • Core:     ~5,000kt
      & distribution                                                                                                                                                                          • Non-core: ~7,050kt
                                                            Cl2
    • Waste                     Chlorine(a)                                                                                                Phosgene(d)                Phosgene(d)
                                                        NaOH
      management                                                                                                                             DPC                       LPC(b)
                                                                                                                                      Diphenylcarbonate
    • Safety                                                                                                                                                     Polycarbonates
                                              Phenol                                                              BPA
                                                                                                              Bisphenol A                                              SPC(c)
                                              Acetone

                                   Purchased raw materials                Covestro activities

9                      Q1 2019 │ IR Roadshow Presentation               Notes:      Chart contains key feedstock only
                                                                                    (a) via Deacon or HCl-ODC technology and / or Chloralkali Electrolysis, (b) Interface process, (c) Melt process (d) produced from CO and Cl2
Securing profitable growth in more challenging times - Roadshow presentation - Covestro Investor Relations
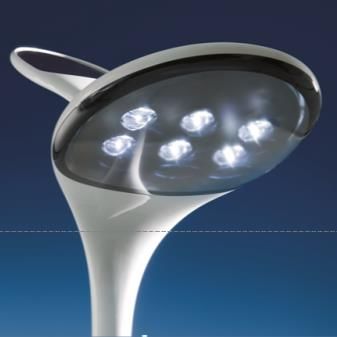
Over half of sales generated with resilient businesses
Product portfolio overview

Sales by segments                                                                                                      Highlights
% of 2018 Group sales

 Resilient businesses                                                                                                    • CAS business is resilient in sales and earnings due to
                                                                                                                           characteristics of niche ingredient chemicals
                                                                                                                         • Resilient portion of PCS business is driven by high-end
                                                                                                                           industry applications e.g. automotive, electrical,
                                       CAS                Polyols
                                       16%                 18%
                                                                                                                           healthcare
                                                                                             Resilience                  • Polyols business is resilient in sales and earnings as
                                                                                              in MDI                       demonstrated over the last decade
                                                                         MDI                   ~30%
      Resilience
                           PCS
                                                                       resilient                                         • Resilient portion of MDI business consists of special
                                                                         7%
       in PCS            resilient                                                                                         grades for downstream products that require formulation
        ~60%               17%                                                                                             know-how and customer interaction along the value chain
                                                                    MDI

                                     PCS

                                              Others     TDI
                                                                                     Supply/demand-
                                                                                   driven businesses

10                  Q1 2019 │ IR Roadshow Presentation         Note:        Resilience measured as standard deviation of contribution margin per kg versus respective average portfolio
Resilient businesses generate EBITDA of €1.3 – 1.6bn
Resilient vs. supply/demand-driven share of EBITDA

in € billion                                                                                                                     Highlights

                                                                        3.4                                                      • Resilient businesses(b) supports value-creating
                                                                                                        3.2                        base earnings
                                                                                                                                 • EBITDA generation between ~€1.3bn and ~€1.6bn
                                                                                                                                   per year under normal economic conditions
                                                                                                                                 • EBITDA from the resilient part of business portfolio
                                         2.0                                                                                       sufficient to cover the Covestro cost of capital
                                                                                                                                 • In 2015-2017, increase of earnings in resilient
               1.6
                                                                                                                                   share driven by higher proportion of differentiated
                                                                                                                                   PCS and higher margin in differentiated MDI
                                                                                                                                 • In 2018, slight decrease of earnings in resilient
                                                                        1.6                             1.5                        share driven by Polyols and CAS
               1.3                       1.4
                                                                                                                                 • In peak years 2017-2018, supply/demand-driven
                                                                                                                                   businesses increased share of EBITDA
                                                                                                                                   disproportionally
          2015(a)                      2016                            2017                            2018

        Supply/demand-driven share of EBITDA              Resilient share of EBITDA

11                   Q1 2019 │ IR Roadshow Presentation                Notes:   (a) EBITDA 2015 on adjusted basis
                                                                                (b) Resilient businesses as defined on page 10
Stable margins driven by differentiated product portfolio
CAS at a glance

     2,700+                                 5,000+                             3.3%                                               €2.4bn                                            €203m
 Products based                         Customers in                      Core volume                                       Sales                                              FOCF
 primarily on 6 monomers                10+ high-end industries           CAGR in 2015-2018(a)                              2018                                               2018

 Ingredients for                                                   Ingredients for                                                                          Ingredients for
     surface coatings                                                adhesives and sealants                                                                     specialties

12                 Q1 2019 │ IR Roadshow Presentation     Notes:    (a) All figures adjusted to reflect the transfer of the specialty elastomers business from the Polyurethanes segment to Coatings,
                                                                    Adhesives, Specialties segment as of January 1, 2018 as well as planned termination of trading activities and reduced contract manufacturing
CAS demonstrated solid underlying growth of 3.3% p.a.
High Growth Specialties businesses

CAS sales split by businesses                                                                                                   Highlights
Covestro sales share FY 2018, rounded
Core volume growth, CAGR 2015-2018(a)
                                           Diverse High                                                                           • Adjusted core volume growth of 3.3% CAGR in
                                         Growth Specialties
                                                                                                                                    2015-2018(a)
                                            Vol. +7%
                                Elastomers                                                                                        • Growth driven by all businesses except coatings
                                 Vol.+7%           4%                                                                               raw materials
                                            9%
                                                                                                                                  • High Growth Specialties businesses generate
                   Specialty Films                                                                                                  36% of sales: Thermoplastic Polyurethanes
                                       11%                                                                                          (TPU), Specialty Films and Elastomers
                       Vol. +5%                                                         Coatings
                                                                           44%        Raw Materials                               • Coatings raw materials businesses burdened by
                                                                                          Vol. 0%                                   weak end markets like marine, oil and gas as well
                  Thermoplastic                                                                                                     as refinishing
                                      12%
                  Polyurethanes
                    Vol. +8%

                                                         20%
                        Adhesives & Sealants
                           Raw Materials
                              Vol. +6%

13                  Q1 2019 │ IR Roadshow Presentation         Notes:   (a) All figures adjusted to reflect the transfer of the specialty elastomers business from the Polyurethanes segment to Coatings,
                                                                        Adhesives, Specialties segment as of January 1, 2018 as well as planned termination of trading activities and reduced contract manufacturing
Strategic focus on increasing resilience
PCS at a glance

     1,000                                 #1                               6.1%                                           €4.1bn                       €468m
 PC grades for                        Producer globally and            Core volume                                    Sales                            FOCF
 broadest offering                    inventor of PC(a)                CAGR in 2015-2018                              2018                             2018

 Mobility                      Electronics              Consumer                               Electrical                              Mobility           Healthcare
 e.g. exterior                 e.g. robot housing       electronics                            e.g. LED street                         e.g. charging      e.g. drug delivery
                                                        e.g. adapter                           lamp                                    station

14               Q1 2019 │ IR Roadshow Presentation    Notes:   (a) Based on nameplate capacity at year end 2018 as per Covestro estimates
Growing share of resilient business to 65% long term
PCS product portfolio

Development of resilient portion of PCS volumes                                                                                      Covestro highlights
Covestro sales volumes in kt

                                                 ~ flat                                                                               Product portfolio improvement
                                                                               Covestro utilization
                     +15pp                                                                                                            • Goal to increase resilient portion of PC volumes
                                                                                                                                        to 65% long term
                                                 >4%
                                                                                Standard business                                     • Capacity growth and increasing share of resilient
                                                 CAGR                           >200kt                                                  business result in significantly higher volumes in
                         6%                                                     additional volumes sold                                 differentiated, high-requirement applications
                                                                                in 2023e vs 2013
                        CAGR                                                                                                          • Structural improvement of average
                                                                                Resilient business                                      contribution margin
                                                 ~8%
                                                            >60%                >600kt
                                                 CAGR                           additional volumes sold                               Higher asset utilization
                         9%         ~55%
                                                                                in 2023e vs 2013
            1,700kt            Covestro capacity(a)
                                                                                                                                      • Significantly higher output from unchanged
                                                                               No. of primary                                           number of primary production sites
              5                        5                      5                PC production sites

15                    Q1 2019 │ IR Roadshow Presentation              Notes:      (a) Nameplate capacity for PC resins at year end
Almost half of sales in resilient businesses
PUR at a glance

      1,000                                     #1                               3.8%                                               €7.4bn                                             €1.0bn
 Polyols grades                            Producer globally and           Core volume                                         Sales                                              FOCF
 for differentiation                       inventor of PU(a)               CAGR in 2015-2018(b)                                2018                                               2018

     Cold chain                      Construction             Cost leadership                        Comfort                                   Automotive                                Sustainability
     e.g. refrigerator               e.g. metal panel         e.g. process                           e.g. furniture                            e.g. instrument                           e.g. CO2-based
                                                              technology                             upholstery                                panel                                     polyether polyols

16                   Q1 2019 │ IR Roadshow Presentation     Notes:   (a) Based on total combined nameplate capacity for MDI, TDI and polyether polyols at year end 2018 as per Covestro estimates
                                                                     (b) Adjusted prior-year figures to reflect the transfer of the specialty elastomers business from the Polyurethanes segment to the CAS
                                                                     segment as of January 1, 2018
Polyols and resilient MDI business make up almost half of sales
PUR resilient business

Polyether polyols demonstrate inherently stable margins                                                      Resilient portion of MDI business(b)

                                                                                                                                        Joint sales of polyols and MDI          Specialty or downstream products
                                                                                                                                           e.g. CASE(c), automotive,          e.g. selected MDI grades (pre-polymers,
                                 2007 – 2018 Spreads
                                                                                                                                            construction, appliance                      blends, monomeric)
                          from around 800US$/t to 1,000US$/t

                                                                                                                                                                                Strong interaction with customers
                                                                                                                                           Formulations as market
                                                                                                                                                                                          along value chain
                                                                                                                                             access requirement
                                                                                                                                                                                    joint projects for e.g. window
                                                                                                                                          e.g. automotive, appliances
                                                                                                                                                                                          frames, wind mills

     2007   2008   2009   2010    2011    2012     2013     2014   2015      2016    2017      2018
                                                                                                                                          • Focus on three large-scale innovation hubs in Pittsburgh, Leverkusen
                                                                                                                                            and Shanghai

                                                                                                               Large-scale innovation
                                  Global polyols price(a)          Global propylene price(a)
                                                                                                                                             ̶   Formulation know-how and tailor-made systems
 • Resilient industry margins over the last decade reflective of overall                                                                     ̶   Full scope of application development
   Covestro polyether polyols profitability                                                                                                  ̶   Cost-efficient business structures
 • Single capacity addition with little influence on global supply and                                                                    • Centralized systems hubs in Europe and North America benefit from
   demand dynamics                                                                                                                          economies of scale and cost-efficient feed from world-scale MDI and
 • Spreads not materially impacted by high volatility of propylene prices                                                                   polyether polyols assets
 • Propylene oxide supply and demand dynamics create local pricing                                                                        • Systems business in ME and APAC handled by local system houses
   opportunities in the short term

                                                                    Notes:    (a) The global average polyols / propylene prices have been calculated based on the polyols / propylene prices in Europe,
17                  Q1 2019 │ IR Roadshow Presentation                        US and China and weighting this average against the respective demand in those regions
                                                                              (b) Resilience measured as standard deviation of gross margin vs average portfolio
                                                                              (c) CASE: Coatings, adhesives, sealants and elastomers
Supply/demand-driven businesses point towards mixed picture
Historical industry development and outlook

       Covestro                 Industry demand development                                  Industry supply development                                      Industry highlights
      S/D-driven share of
                               (kt)(a)                           CAGR                       (kt)(b)                              CAGR
      2018 Group sales                          CAGR
                                                                                HIGH
                                                                                                             CAGR                                   HIGH      • Structurally sound demand of ~5% driven by solid
                                                                 ~5%            at 7%                                            ~5%                at 6%       GDP growth and substitution trends
                                                5.0%                                                          5.8%
                                                        7,150                   LOW                                     8,130                       LOW       • Major additions(c) expected until 2023e: Wanhua and
MDI

                                                                                                                                                    at 4%
                                                                                at 4%                                                                           BASF
                                                                                                                                                              • Covestro additions: Brunsbüttel (200kt, 2020e),
                     14%
                                                                                                                                                                Caojing (100kt, 2021e) and Tarragona (50kt, 2022e)
                                         2013          2018e            2023e                         2013              2018e              2023e

                                                                 CAGR                                        CAGR                CAGR                         • Ongoing ramp-ups: Sadara, BASF and Wanhua
                                                CAGR
                                                                                                                                                    HIGH      • Major additions(c) expected until 2023e: Juli Heshan,
                                                                 ~4%                                          0.6%               ~6%
                                                2.6%                            HIGH                                                                at 7%       Lianshi and Fujian SEEC
                                                                                at 4.5%
                                                                                                                                                              • Announced closure of BASF, Schwarzheide
TDI

                                                        2,360                                                           2,720
                                                                                                                                                    LOW
                                                                                LOW                                                                 at 4%     • Potential industry consolidation in APAC
                                                                                at 3.0%
               13%
                                         2013          2018e            2023e                         2013              2018e              2023e

                                                                 CAGR                                        CAGR                CAGR                         • Electric mobility and autonomous driving could
                                                CAGR                                                                                               HIGH
                                                                 ~4%            HIGH                                                               at 11%
                                                                                                                                                                accelerate demand growth above base case
                                                                                                              1.3%               ~9%
                                                4.6%                            at 5%                                                                         • Major additions(c) expected until 2023e: Cangzhou
                                                        4,540                                                           5,190                      LOW
PCS

                                                                                LOW                                                                at 6%        Dahua, Heng Yuan, Hubei Ganning, Lotte, Luxi,
                                                                                at 3%                                                                           SABIC-Sinopec, Shenma, Wanhua, ZPC, Zhong Lan
       11%                                                                                                                                                    • Covestro additions: Caojing (optional 4x 50kt, 2019e-
                                         2013          2018e            2023e
                                                                                                                                                                2022e) and new production line (130kt, 2022e)
                                                                                                      2013              2018e              2023e

                                                                            Notes:        (a) Assumes global GDP CAGR 2018–2023e of 2-3%
18                          Q1 2019 │ IR Roadshow Presentation                            (b) Based on historical and announced future nameplate capacities
                                                                                          (c) Based on corporate announcements
                                                                            Source:       Covestro estimates
2019 EBITDA development driven by pricing delta
Pricing delta development in EBITDA bridge

in € million                                                                                             Highlights

                                                       +1,245                                            • Pricing delta calculated by adding selling and raw
                                                                                                           material price effects on earnings
         +296                                                                                            • Raw material price movements are usually passed
                            +265                                                                           through directly to customers via selling price
                                                                          +65                              adjustments
                                                       1,922
                                                                                                         • Pricing delta is driven by industry utilization
        1,201
                                894                                                                        rates, thus mainly impacting Covestro’s
                                                                         641
                                                                                         Approx. range     supply/demand-driven share of EBITDA
                            -629                                         -576                            • Spike in 2017 due to limited supply additions,
                                                       -677
         -905                                                                                              followed by significant capacity ramp-up as of
                                                                                         -1,400 to
                                                                                           -1,800          mid-2018
                                                                                           -2,009
                                                                                                         • Anticipated negative pricing delta in 2019e leads
                                                                                         Approx. range     to expected below mid-cycle margins

        2015               2016                        2017             2018              2019e
                Pricing delta         Raw material price effect   Selling price effect

19                Q1 2019 │ IR Roadshow Presentation
Right strategy and thorough execution in different stages
Different stages since IPO

                                2015 – 2016                                              2017 – 2018                                                            2019 – 2021
                           Becoming independent                                          Riding ‘the wave’                                                      Driving efficiency

                  • Normal supply/demand conditions                    • Tight supply conditions                                            • Volatile conditions
     Industries

                  • Volume growth above global GDP                     • Volume growth benefitting from                                     • Volume growth above global GDP
                  • Margins approach mid-cycle levels                    restocking                                                         • Short-term, margins approaching
                                                                       • Margins on historic peak levels                                      trough levels

                  • Carve-out in record time, IPO in Oct.              • Priority on output maximization,                                   • Streamline standard businesses and
                    2015                                                 minimizing disruptions                                               extend differentiation
                  • Mirror Bayer’s organizational set-up               • Selective cost measures implemented                                • Maximize portfolio synergies
     Covestro

                  • Establish new Covestro culture                     • Set basis for long-term growth                                     • Execute cost-cutting, reduce
                  • New set of KPIs: CVG, FOCF and                     • Return excess cash to shareholders                                   headcount in non-production areas
                    ROCE(a)                                                                                                                 • Continue volume expansion based on
                  • Fill underutilized production assets                                                                                      cost leadership

20                        Q1 2019 │ IR Roadshow Presentation   Note:      (a) CVG = Core Volume Growth, FOCF = Free Operating Cash Flow, ROCE = Return on Capital Employed
Execute cost-cutting, reduce headcount in non-production areas
Expected cumulated savings and restructuring costs

Progress on “Perspective” program                                                                   Highlights
Approximations, in € million
                                                                                                    • Cumulated savings of around €350m planned
                                                                                           350
                                                                                                      until end of 2021e
                                                                                                    • 2018 slightly ahead of plan (+€8m) and
                                                                                           120        expected acceleration in 2019 (+€30m)
                                                                   230                              • Reduction of ~900 FTEs globally in non-production
                                                                                                      areas, to be carried out by way of socially
                                                                    90                                acceptable solutions
                                        140                                                         • Functional areas: E2E supply chain and
                                                                                           230        manufacturing; procurement; commercial
                                         92                                                           and general & administration
            48                                                     140
                                                                                                    • Driving efficiency by adapting business unit and
                                         48                                                           corporate level structure to market needs:
                                                                                                      streamline standard businesses, extend
           -48                          -50                        -55                                differentiation and maximize portfolio synergies
          2018                        2019e                       2020e                  2021e      • Expected increase of FTEs in production areas

     Restructuring costs per annum (EBIT)         Cost savings per annum   Cumulated cost savings

21                  Q1 2019 │ IR Roadshow Presentation
Entire organization aligned for performance
Full STI annual target achievement requires EBITDA above €2bn

Uniform bonus system                                  Three equally weighted Group metrics               Transparent ambition

 • Full alignment of all employees                     • Targets for 100% achievement:                   • Future core volume growth goal of 4%
   (including board) along the same KPIs                                                                   requires growth capex
 • Criteria with full focus on performance                    Core Volume                                • 100% target achievement for ROCE and
   and shareholder value creation                             Growth                +4.0%                  FOCF implies mid-cycle EBITDA above
                                                                                                           €2bn for 2019-21
 • 100% payout, as percentage of annual
   base salary, linked to hierarchy level
 • Total payout at Group level for 0%, 100%                   FOCF                  €800m
   and 250% achievement is €0m, ~€180m
   and ~€450m, respectively
 • Fixed hurdle rates for 2019-21 reflect                     ROCE above
                                                              WACC(a)                  8pp
   KPI values in mid-cycle conditions,
   based on historical review and expected
   future development                                  • For each metric, payout can range from
                                                         0% to 300%
                                                       • Max. payout capped at 250%

22              Q1 2019 │ IR Roadshow Presentation   Notes:   (a) WACC = Weighted Average Capital Cost
High volume leverage continuously contributes to EBITDA
Volume growth contribution to EBITDA

in € million,                                                                   Highlights
Core Volume Growth in %
                                                                                • Track record of growth above global GDP at ~4%
                                                                                  Core Volume Growth 2015-18 CAGR, with
                          267                                                     corresponding average volume leverage of 46%
                                                     232                        • Striving to grow in line with industry based on
                                                             216                  leading production cost position
                                                                                • Running capacity expansion program allows for
                                                                                  planned volume growth of ~4% CAGR 2019-23e
                                                                                • 100% target achievement in short-term incentive
                                                                                  (STI) program based on 4% Core Volume Growth
                                                                                  per annum
       77

                                                                       CAGR
      +2.7%               +7.5%                      +3.4%   +1.6%
                                                                        +4%

      2015                2016                       2017    2018    2019-23e

23              Q1 2019 │ IR Roadshow Presentation
Growth through debottlenecking projects and world-scale plant
Covestro planned capacity additions

           2019e                              2020e                              2021e                            2022e                        Beyond 2022e

                                                    MDI +200kt Brunsbüttel

                                                                                        MDI +100kt Caojing

                                                                                                                      MDI +50kt Tarragona
PUR

                                                                                                                                                  MDI +410kt Baytown(b)

              Polyols +60kt Channelview

                                                                                        Polyols +30kt St. Clara

                                                OPTION                              OPTION                         OPTION

              +50kt Caojing                         +50kt Caojing                       +50kt Caojing                 +50kt Caojing
PCS

                                                                                                                      +130kt(a) site TBD

                                                    Chlorine plant Tarragona
BACKBONE

                                                                                                                       Aniline plant Antwerp

                                                                                                                                                 Full backbone Baytown(b)

24                   Q1 2019 │ IR Roadshow Presentation          Note:   (a) New polycarbonates line
                                                                         (b) Planned for 2024e
2019 cash flow burdened by bonus and tax payments
Historical FOCF development and 2019 guidance

in € million                                                                                                                         Highlights 2018

                                                        1,843                                                                          • Solid EBITDA to FOCF conversion rate at 52%
                                                                             1,669
                                                                                                                                       • Working capital to sales ratio slightly up at
                                                                                                                                         16.2% in 2018 vs. 15.4% in 2017, within the
                            1,367                                                                                                        targeted range of 15–17%
                                                                                                       300-700
       1,186
                                                        3,435                3,200
                            2,014                                                                   1,500-2,000
       1,641

                 115                  25                                                                                             Guidance 2019
                 133                  165
                                      419                                               167                                            • FOCF to EBITDA conversion rate down to around
         509                                            475
                                                                              707                                                        20-35%
                 194         418                        518                                             ≥900(b)
                                                                                                                                       • Capex(b) of €≥900m up Y/Y with focus on growth
                                                        510                   574                                                        investments
                                                                89                      83
                                                                                                                                       • Cash outflow for 2018 bonus provisions
       2015(a)               2016                       2017                 2018                       2019e
                                                                                                                                       • Cash tax rate expected above P&L tax rate due
          EBITDA       Changes in working capital         Capex        Income taxes paid          Other effects(c)
                                                                                                                                         to phasing of tax payments

25                 Q1 2019 │ IR Roadshow Presentation                Note:   (a) EBITDA 2015 on adjusted basis
                                                                             (b) Cash-relevant capex
                                                                             (c) “Other effects “including cash outflow for bonus provisions
Use of cash with focus on value creation
Clear set of priorities

Commitment                                        Focus                             Opportunities

     Dividend policy                                Capex                            Portfolio                          Return to
                                                                                                                        shareholders

                          €
                                                                                                                                                  €
 • Progressive policy: increase                    • Covestro’s industry and cost   • Disciplined and focused           • Return excess cash to
   or keep at least stable                           leadership make growth           approach                            shareholders
 • For FY 2018, dividend                             investment the most value-     • Acquisitions with focus on        • New authorization for share
   payment of €2.40 per share:                       creating use of cash             high margin and                     buy-back program for up to
       ̶   increase of 9% Y/Y                      • Growth capex focuses             differentiated business areas       10% of share capital
                                                     mainly on CAS, MDI and         • Ongoing portfolio                   available for the next 5 years
       ̶   payout amount of €438m                    PCS                              optimization including
                                                   • Maintenance capex to             evaluation of potential
                                                     secure safe, reliable and        disposals
                                                     efficient operations
                                                                                    Decision based on highest value creation

26                 Q1 2019 │ IR Roadshow Presentation
Financial highlights
Q1 2019

covestro.com   Q1 2019 │IR Roadshow Presentation   27
Significant pricing pressure continues
Group results - Q1 2019 Highlights

Sales and Core Volume Growth                                                                   Highlights
in € million / changes Y/Y
                                                                                               • Core Volume Growth of -1.8% as expected due to
                               4.4%
                                                                            1.7%
                                                                                                 continued destocking and planned maintenance
          0.0%                                           0.2%                         -1.8%      shutdown
                                                                                               • Positive Core Volume Growth in MDI and TDI,
          3,779               3,863                      3,702              3,272     3,175      declining volumes in polyether polyols and PCS
         Q1 2018             Q2 2018                    Q3 2018            Q4 2018   Q1 2019   • Sales decreased by -16.0% Y/Y, driven by price
                                   Sales                   Core Volume Growth Y/Y
                                                                                                 (-18.3%)

EBITDA and Margin                                                                              Highlights
in € million / margin in percent
                                                                                               • Compared to prior year, EBITDA declined Y/Y due
         28.1%                25.5%                     23.2%                                    to pronounced negative pricing delta
                                                                                     13.9%
                                                                            9.0%               • Sequentially, EBITDA margin increased Q/Q to
                                                                                                 13.9% vs. 9.0%, mainly due to lower cost
          1,063                985                       859                 293      442

         Q1 2018             Q2 2018                    Q3 2018            Q4 2018   Q1 2019

                                   EBITDA                  EBITDA Margin

28                 Q1 2019 │ IR Roadshow Presentation
Polyurethanes – earnings below mid-cycle
PUR segment results – Q1 2019 Highlights

Sales and Core Volume Growth                                                                         Highlights
in € million / changes Y/Y
                                                                                                     • Stable core volumes of -0.2% Y/Y, with positive
                                                                                                       contributions from MDI and TDI, negatively
                                3.9%                                        2.3%                       impacted by polyether polyols
         -1.0%                                           -2.0%                         -0.2%
                                                                                                     • Sales decreased by -24.3% Y/Y, driven by
          1,950                1,966                     1,849              1,597      1,476           price (-29.4%)
        Q1 2018               Q2 2018                Q3 2018               Q4 2018    Q1 2019        • Positive volume effect in sales development
                                   Sales                   Core Volume Growth Y/Y
                                                                                                       (+3.0%) due to product mix effects

EBITDA and Margin                                                                                    Highlights
in € million / margin in percent
                                                                                                     • Compared to prior year, EBITDA declined Y/Y due
         32.7%                 29.7%
                                                         23.4%                                         to pronounced negative pricing delta
                                                                            7.0%
                                                                                       10.6%
                                                                                                     • Sequentially, EBITDA margin increased Q/Q to
                                                                                                       10.6% vs. 7.0%, mainly due to lower cost
          637                   583                       432                          157
                                                                            111
        Q1 2018               Q2 2018                Q3 2018               Q4 2018    Q1 2019

       EBITDA attributable to one-time items & fly-up TDI margins         EBITDA     EBITDA Margin

29                  Q1 2019 │ IR Roadshow Presentation
Polycarbonates – impacted by automotive
PCS segment results – Q1 2019 Highlights

Sales and Core Volume Growth                                                                         Highlights
in € million / changes Y/Y
                                                                                                     • Negative Core Volume Growth of -6.3% Y/Y due to
                                                                                                       demand drop in automotive, accounting for around
          2.7%                 5.3%                      2.6%               1.6%                       1/3 of sales, and continued destocking
                                                                                       -6.3%
                                                                                                     • Sales decreased by -16.7% Y/Y driven by price
         1,033                 1,056                     1,038               924        860            (-12.8%) and volume (-2.9%)
        Q1 2018               Q2 2018                Q3 2018               Q4 2018    Q1 2019        • Additional negative portfolio effect Y/Y (-3.6%)
                                   Sales                   Core Volume Growth Y/Y

EBITDA and Margin                                                                                    Highlights
in € million / margin in percent
                                                                                                     • Compared to prior year, EBITDA declined Y/Y due
         29.3%                 27.0%
                                                         30.3%                                         to pronounced negative pricing delta and lower
                                                                           14.4%
                                                                                       18.0%           volumes
                                                                                                     • Sequentially, EBITDA margin increased Q/Q to
          303                   285                       315                133        155            18.0% vs. 14.4%, mainly due to lower cost
        Q1 2018               Q2 2018                Q3 2018               Q4 2018    Q1 2019

       EBITDA attributable to one-time items                              EBITDA     EBITDA Margin

30                  Q1 2019 │ IR Roadshow Presentation
Coatings, Adhesives, Specialties – strong earnings
CAS segment results – Q1 2019 Highlights

Sales and Core Volume Growth                                                                          Highlights
in € million / changes Y/Y
                                                                                                      • Stable core volumes of -0.1% Y/Y, despite weak
                                                                                                        coatings industry, accounting for close to 1/2 of
                              5.8%                      7.2%
                                                                                              0.2
                                                                                              0.15      sales
         -1.3%                                                             -1.8%     -0.1%    0.1
                                                                                              0.05
                                                                                              0       • Sales increased by +5.9% Y/Y driven by price
                                                                                              -0.05

          592                  629                      606                534       627
                                                                                              -0.1
                                                                                              -0.15
                                                                                                        (+1.7%) and volume (+1.1%)
                                                                                              -0.2

        Q1 2018              Q2 2018                Q3 2018              Q4 2018    Q1 2019           • Additional positive FX impact Y/Y (+3.1%)
                                   Sales                  Core Volume Growth Y/Y

EBITDA and Margin                                                                                     Highlights
in € million / margin in percent
                                                                                                      • Compared to prior year, EBITDA increased Y/Y by
                                                                                                        7.4% driven by volumes and positive pricing delta
         23.0%                                                                       23.3%
                              22.1%                     20.8%
                                                                           11.8%
                                                                                                      • Sequentially, EBITDA margin increased Q/Q to
                                                                                                        23.3% vs. 11.8%, mainly due to lower cost
          136                  139                       126                63        146

        Q1 2018              Q2 2018                Q3 2018               Q4 2018   Q1 2019

                                 EBITDA                  EBITDA Margin

31                 Q1 2019 │ IR Roadshow Presentation
Negative price effects decrease sales despite stable volumes
Q1 2019 – Sales bridge

in € million                                                                         Highlights

      3,779        +33                                                               Stable volumes
                                                                                     • Sales volume expansion (in €) by +0.9% Y/Y
                                                         +90                3,175
                                                                                     • Sales volume expansion above core volume
                                                                                       growth mainly due to product mix effects
                                       -690                      -37
                                                                                     Negative pricing
                                                                                     • Lower selling prices negatively impacted sales by
                                                                                       -18.3% Y/Y, driven by PUR and PCS
                                                                                     • Positive pricing development in CAS
                                                -16.0%
                                                                                     Positive FX
                                                                                     • FX benefited sales by +2.4% Y/Y mainly due to
                                                                                       stronger USD and CNY
                                                                                     Portfolio impact
                                                                                     • Sales reduced by -1.0% Y/Y due to disposal of US
                                                                                       polycarbonates sheets as of 1st August 2018

     Q1 2018     Volume                Price             FX    Portfolio   Q1 2019

32             Q1 2019 │ IR Roadshow Presentation
Q1 earnings with pronounced negative pricing delta
Q1 2019 – EBITDA bridge

in € million                                                                                                               Highlights
                                    Pricing delta
                                      -€659m                                                                                 Positive volume leverage
                +33
      1,063
                                                                                                                             • Mainly driven by product mix effects
                                                                                                                             Pronounced decline in contribution margin
                                                                                                                             • Negative pricing delta in PUR and PCS mainly
                                                                                                                               resulting from higher competitive pressure
                                                                                                                             Other items
                                                                                                                             • Lower bonus provisions
                                                               +11
                                                                                                                             • Positive impact from accounting change (IFRS 16)
                                                    +31                                              442
                                                                                  -6                                         • Negative impact from higher maintenance costs
                                -690                                                                                           and capex-related expenses
                                                                                                                             Positive Q/Q development
                                                -58.4%
                                                                                                                             • Mainly driven by cost reductions
                                                                                                                             • Positive volume leverage counterbalanced by
                                                                                                                               negative pricing delta
     Q1 2018   Volume           Price        Raw material       FX          Other items          Q1 2019
                                                price

33             Q1 2019 │ IR Roadshow Presentation           Note:    (a) Method of calculation: EBITDA volume contribution / sales volume contribution
IFRS 16 adoption leads to significant increase of net debt
March 31th 2019 – Total net debt

in € million                                                                                                                            Highlights

                                                                                              222                2,726                   • Application of IFRS 16 increased net financial debt
                                                      642                 15                                                               by €642m(b)
                                                                                                                                         • Pension provisions increased by €222m mainly
                                                                                                                 1,059                     resulting from lower discount rates in Germany
     1,793        45                9                                                                                                    • Total net debt to EBITDA ratio(a) of 1.1x end of Q1
     348
                                                                                                                                           2019 vs. 0.6x end of 2018

                                                                                                                 1,667
     1,445

 Dec. 31, 2018   FOCF            Interest           IFRS 16             Others             Changes         March 31, 2019
                                                   adjustment (b)                         in pension
                                                                                          provisions

                              Net financial debt                    Pension provisions

34               Q1 2019 │ IR Roadshow Presentation                  Notes:      (a) Method of calculation: Total net debt on March 31, 2019 divided by EBITDA of last four quarters
                                                                                 (b) Reflecting increase in lease liabilities in the course of IFRS 16 adoption as of March 31, 2019
Below mid-cycle earnings in challenging economic environment
Historical EBITDA development and FY 2019 guidance

in € million,                                                                                                          Underlying assumptions
Core Volume Growth in %
                                                                                                                        Low-end scenario
                                                 3,435                                                                  • Further price decline compared to January 2019 especially
                                                                     3,200                                                in TDI
                                                                                                                        • Low end of CVG(b) range due to lower GDP growth
                                                                                                                          and/or unplanned production constraints
                                                                                                                        • Unfavorable FX impact(c)
                                                                                                                        High-end scenario
                          2,014                                                         1,500-2,000
                                                                                                                        • Price increases compared to January 2019 especially
      1,641                                                                                                               in MDI
                                                                                                                        • Solid demand across all industries, however upside to
                                                                                                                          CVG(b) limited due to constrained available capacity
                                                                                                                        • Favorable FX impact(c)
                                                                                             Low- to
      +2.7%               +7.5%                      +3.4%           +1.6%                     mid-
                                                                                              single

     2015(a)              2016                       2017            2018                   2019e

35              Q1 2019 │ IR Roadshow Presentation           Note:   (a) EBITDA 2015 on adjusted basis
                                                                     (b) CVG = Core Volume Growth
                                                                     (c) Basic assumptions FY 2019: Exchange rate of EUR/USD ~1.15, RMB/EUR ~7.9 and a global GDP growth of 2.9%
FY guidance confirmed in a challenging environment
FY 2019 guidance as per April 29th, 2019

                                                                                  FY 2018                                                            Guidance FY 2019

 Core Volume Growth                                                                  +1.6%                                         Low- to mid-single-digit percentage increase Y/Y

 FOCF                                                                              €1,669m                                                                 €300 – 700m

 ROCE                                                                                29.5%                                                                   8% – 13%

 Additional financial expectations                                                FY 2018                                                            Guidance FY 2019

 EBITDA FY                                                                         €3,200m                                                              €1,500 – 2,000m

 EBITDA Q2                                                                          €985m                                                            Around Q1 2019 level

                                                                                                                                                             ~€750m
 D&A                                                                                €620m
                                                                                                                                                      (previously: ~€700m)

 Financial result                                                                   €-104m                                                               €-100 to -120m

 P&L (effective) tax rate                                                            26.1%                                                                    24 - 26%

 Capex(a)                                                                           €707m                                                                     ≥€900m

36                  Q1 2019 │ IR Roadshow Presentation   Note:   (a) Cash-relevant capex
                                                                  Basic assumptions FY 2019: Exchange rate of EUR/USD ~1.15, RMB/EUR ~7.9 and a global GDP growth of 2.6%
Upcoming IR events
Find more information on investor.covestro.com

Reporting dates

     • July 24, 2019                                        Half-Year Financial Report 2019
     • October 28, 2019                                     Q3 2019 Interim Statement
     • February 19, 2020                                    Annual Report 2019

Sellside dinner event
     • May 7, 2019                                          Sellside Round Table with CEO, Frankfurt

Broker conferences
     • May 10, 2019                                         JP Morgan Investor Forum, Amsterdam
     • May 22, 2019                                         Berenberg Conference USA, Tarrytown
     • May 22, 2019                                         Morgan Stanley ChemTech Day, London
     • June 4, 2019                                         Commerzbank, mBank Chemical Event, Warsaw
     • June 5 – 6, 2019                                     Deutsche Bank, dbAccess, German, Swiss & Austrian Conference, Berlin
     • June 6 – 7, 2019                                     Barclays Select Conference, Sonoma

37                     Q1 2019 │ IR Roadshow Presentation
Disclaimer

This presentation may contain forward-looking statements based on current assumptions and
forecasts made by Covestro AG.
Various known and unknown risks, uncertainties and other factors could lead to material
differences between the actual future results, financial situation, development or performance of the
company and the estimates given here. These factors include those discussed in Covestro’s public
reports, which are available on the Covestro website at www.covestro.com.
The company assumes no liability whatsoever to update these forward-looking statements or to
adjust them to future events or developments.

38          Q1 2019 │ IR Roadshow Presentation
You can also read