Nyrstar Investor Presentation - August 2018
←
→
Page content transcription
If your browser does not render page correctly, please read the page content below
Nyrstar Investor Presentation

August 2018
Important notice

 This presentation has been prepared by the management of Nyrstar NV (the "Company"). It does not constitute or form part of, and should not
 be construed as, an offer, solicitation or invitation to subscribe for, underwrite or otherwise acquire, any securities of the Company or any
 member of its group nor should it or any part of it form the basis of, or be relied on in connection with, any contract to purchase or subscribe for
 any securities of the Company or any member of its group, nor shall it or any part of it form the basis of or be relied on in connection with any
 contract or commitment whatsoever
 The information included in this presentation has been provided to you solely for your information and background and is subject to updating,
 completion, revision and amendment and such information may change materially. Unless required by applicable law or regulation, no person
 is under any obligation to update or keep current the information contained in this presentation and any opinions expressed in relation thereto
 are subject to change without notice. No representation or warranty, express or implied, is made as to the fairness, accuracy, reasonableness
 or completeness of the information contained herein. Neither the Company nor any other person accepts any liability for any loss howsoever
 arising, directly or indirectly, from this presentation or its contents
 This presentation includes forward-looking statements that reflect the Company's intentions, beliefs or current expectations concerning, among
 other things, the Company’s results of operations, financial condition, liquidity, performance, prospects, growth, strategies and the industry in
 which the Company operates. These forward-looking statements are subject to risks, uncertainties and assumptions and other factors that
 could cause the Company's actual results of operations, financial condition, liquidity, performance, prospects, growth or opportunities, as well
 as those of the markets it serves or intends to serve, to differ materially from those expressed in, or suggested by, these forward-looking
 statements. The Company cautions you that forward-looking statements are not guarantees of future performance and that its actual results of
 operations, financial condition and liquidity and the development of the industry in which the Company operates may differ materially from
 those made in or suggested by the forward-looking statements contained in this presentation. In addition, even if the Company's results of
 operations, financial condition, liquidity and growth and the development of the industry in which the Company operates are consistent with the
 forward-looking statements contained in this presentation, those results or developments may not be indicative of results or developments in
 future periods. The Company and each of its directors, officers and employees expressly disclaim any obligation or undertaking to review,
 update or release any update of or revisions to any forward-looking statements in this presentation or any change in the Company's
 expectations or any change in events, conditions or circumstances on which these forward-looking statements are based, except as required
 by applicable law or regulation
 This document and any materials distributed in connection with this document are not directed to, or intended for distribution to or use by, any
 person or entity that is a citizen or resident or located in any locality, state, country or other jurisdiction where such distribution, publication,
 availability or use would be contrary to law or regulation or which would require any registration or licensing within such jurisdiction
 The distribution of this document in certain jurisdictions may be restricted by law and persons into whose possession this document comes
 should inform themselves about, and observe any such restrictions. The Company’s shares have not been and will not be registered under the
 US Securities Act of 1933 (the “Securities Act”) and may not be offered or sold in the United States absent registration under the Securities Act
 or exemption from the registration requirement thereof
                                                                                                                                                         2
Table of Contents

            I.   Introduction

            II. Key investment highlights

            III. Financial and operating results

            IV. Delivering a strong future for Nyrstar

            V. Appendix

                                                         3
Nyrstar today
      Global multi-metals business, with a market leading position in zinc and lead, and growing positions
      in other base and precious metals
                                                                       Geographically diverse smelters operating in OECD countries1

                 LTM3 Revenue
                  EUR 3.7bn

               LTM3 Underlying
                  EBITDA
                 EUR 214m

             c. 4,100 employees

              LTM3 production
             1,028kt zinc metal
             139kt zinc in conc.

                       Second largest zinc metal producer globally…                                                        …with consistent long term production

                                       2017 zinc smelter production2 (kt Zn)                                  Metal (kt)
                    1,192
                                     1,019            1,011                                                     195                179      178     185                    1,050-1,100
                                                                                                                           158                              187    171
                                                                         801

                                                                                          583
                                                                                                     457       1,125                               1,115
                                                                                                                           1,084   1,088   1,097           1,015   1,019

                 Korea Zinc         Nyrstar         Glencore         Hindustan            Nexa      Boliden    2011        2012    2013    2014    2015     2016   2017    2018 Zinc
                                                                        Zinc            Resources                                                                          Guidance

           Market                                                                                                                   Lead   Zinc
                      9.1%           7.5%              7.4%            4.5%               4.5%       3.4%
           Share2
1Excludes corporate offices and mining assets where sale has been agreed or completed
2Wood Mackenzie Q2-18 Global zinc long-term outlook figures other than Nyrstar
3 LTM – last 12 months from July 2017 to June 2018                                                                                                                                  4
Source: Wood Mackenzie; Nyrstar company information
Table of Contents

            I.   Introduction

            II. Key investment highlights

            III. Financial and operating results

            IV. Delivering a strong future for Nyrstar

            V. Appendix

                                                         5
Key investment highlights

Key investment highlights

 #1   Strong progress on key strategic initiatives

 #2   Excellence in smelting and mining

 #3   Robust industry backdrop

 #4   Significantly enhanced liquidity, capital structure and maturity profile

 #5   Expert management and Board

 #6   Strategic relationship with supportive cornerstone shareholder

                                                                                                         6
Key investment highlights

       #1       Strong progress on key strategic initiatives
Proactive operational and financial initiatives to transform Nyrstar into the leading global multi-metals business

                                               • Project optimised in 2017 to accelerate and de-risk ramp-up
                                               • First feed to TSL furnace achieved end October 2017. All major systems including slag
        Port Pirie                               caster and acid plant are in operation
      Redevelopment                            • Proportion of residue in feed for the new TSL furnace, at 57% during the month of July
                                                 2018, ahead of the fully ramped-up target of 40%
                                               • Underlying EBITDA uplift of ~ €130m per annum from 20201

                                               • North American mines retained as a core component of the Nyrstar business
          Extract
                                               • Middle Tennessee successfully restarted and ramped-up
      maximum value
       from mining                             • Restart of Myra Falls in progress with first production in Q3 2018
                                               • Full Potential optimisation review completed - targeting ~200kt of Zinc production by 2019

         Optimise                              • Full potential assessments completed across all five zinc smelters by end Q3 2017
       zinc smelting                           • Low-capex initiatives set to deliver substantial improvements in production and operating
                                                 costs identified for delivery in 2018 and subsequent years

     Supported by
                                                            Strengthened                              Strong macro
                                                            balance sheet                             fundamentals

                                                                                                                                              7
1   Uplift vs 2016 Underlying EBITDA applying 2016 macros
Key investment highlights

         #2          Excellence in smelting and mining
                      Clearly defined business model in metals processing generates significant gross profit from
                      diverse sources

                                                                                                        Diverse sources of smelting gross profit

                                        •     Paid to the smelters by miners in the form of concessions
        Treatment                              – Consistent source of gross profit driven by the annual
         charges                                 benchmark TC                                                                                                                                        LTM Metals Processing sources of gross profit1
          (“TC”)                               – Small proportion (5-10%) of purchases are at spot treatment
                                                 charge terms                                                                                                                                                    By-product                     Zinc and
                                                                                                                                                                                                                   Sales                        Lead TCs
                                                                                                                                                                                                                    14%                            36%
                                         •    Metal produced over and above the content the smelter has
                                              paid for in concentrates purchased
                                               – Nyrstar’s operational excellence helps extract maximum free
        Free metal
                                                 metal to supplement earnings from the TC
                                                                                                                                                                                         Zinc and lead
                                               – Free metal set to increase once Port Pirie is fully operational                                                                           Premium
                                                 as higher value feedstock is processed                                                                                                       16%

                                        •     Sales of refined metal made above the LME zinc and lead
          Metal                               reference price
        premiums                               – Significant portion of zinc / lead production above commodity
                                                 grade due to strong R&D and technical know-how
                                                                                                                                                                                                           Zinc and lead free
                                                                                                                                                                                                                 Metal
                                                                                                                                                                                                                 34%
                                        •     Extraction of additional metals and by-products from the
                                              concentrates                                                                                                                                                                     Total2:
            By-
                                               – High quality assets extract significant amounts of high value
         products                                by-products from the feedstock
                                                                                                                                                                                                                             EUR 1,120m
                                               – Exposure set to increase once Port Pirie is fully ramped-up

1   LTM – last 12 months from July 2017 to June 2018; Note that the percentages in the chart refer to the gross profit contributed by each source as a percentage of Gross Profit excluding Other Gross Profit (total of EUR 990m)
2   Includes Other Gross Profit of EUR (98)m                                                                                                                                                                                                                 8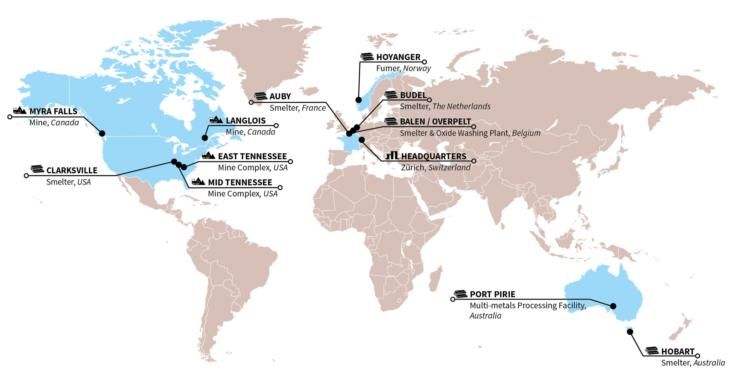
Key investment highlights

         #2       Excellence in smelting and mining
                  Project and earnings uplift overview
Redevelopment allows Nyrstar to leverage the zinc smelter network                         Monthly volume of feed treated in TSL furnace

•        Major milestones reached on Port Pirie Redevelopment project with all            % Residue in feed             Quarterly TSL feed rate (kt)
         major systems now commissioned and ramp up on track
              -     Volume of material treated continues to ramp-up ahead of
                    schedule
              -     Proportion of residue in feed for the new TSL furnace, at                                           54%              57%
                    57% during the month of July 2018, ahead of the fully
                    ramped-up target of 40%
              -     Blast furnace optimisation during Q2’18 planned                                       37%
                                                                                                                                          78
                    maintenance shut removed bottlenecks
              -     Sufficient internally generated residues (c. 400kt) stockpiled
                                                                                                                          48
                    on-site to feed the TSL furnace for the coming several years
•        Two year ramp up significantly de-risked                                                          21
                                                                                          0.5
              -     Continuous operating time increasing every month since
                    commencement of ramp-up in December 2017;                            Q4’17           Q1’18          Q2’18            Q3’18
                                                                                                                                      proforma on
                    Sinter plant / old acid plant operation extended to allow parallel                                                 July actual
                    operation with TSL furnace and new acid plant in 2018

        Projected increase in throughput - greater ability to use residues                 Revised Underlying EBITDA uplift profile1
                                                                                                      Optimisation expected to
                                                                            620kt                   drive run-rate earnings uplift
                                                                                                     in the region of EUR 130m
                                                                                                       p.a. compared to 2016
         Internal                                                          260                                                               ~ EUR130m
                                                                                                                                                 Full
                                   360kt                                                                                  ~ EUR 100m           ramp-up
    Primary Pb                      60

                                                                           360                            ~ EUR 40m
                                   300
                                                                                         ~ EUR 0m
                                                                                          2017              2018               2019             2020+
                                  2016                                     2020+
    1Against 2016 Underlying EBITDA using 2016 macroeconomic assumptions
    Source: Company information                                                                                                                          9
Key investment highlights

      #2    Excellence in smelting and mining
            Latin American assets divested , North American mines core to business
• Latin American Mining assets sold (5 mines), with additional upside through price participation at El Toqui, earn-out at Coricancha
    and royalty at Campo Morado
• Divestment process concluded in Q3 2017 with the North American mines to be held as a core component of the Nyrstar business
• Myra Falls mine restart commenced in August 2017 and proceeding as planned with production in Q3’18 and first shipments in Q4’18
              Total restart capex of EUR c.70m; copper prepay of USD 30m partially funding the restart capex
•      North American mining operations continue to increase their quarterly run rate of EBITDA generation and are expected to
       generate robust free cash flow in 2018
•      All Mining free zinc for 2019 (166kt) hedged during Q2 2018 at c. USD 3,000/t

            Zinc in concentrate production (kt)                                                 Full indicative potential - North American mines

            Myra Falls to commence zinc                                    Production                                                                     C1 cash cost
            in conc. production in Q3’18                                   (kt)                                                                             (USD/t)
                                                             160 - 180
                                                                           220                                                                                   2,500

                                                                           200
                 +28%                                                      180

                                   123                                     160
                                                                                                                                                                 2,000
                                                                           140
                  27
     96
                                                                           120

                                                                           100

                                                                            80
                                              Middle                                                                                                             1,500
                Restart
                                              Tennessee                     60
                of
                                              ramped-up
                MTN                                                         40
                                              production
                                                                            20

                                                                             0                                                                                   1,000
    2016      Restarts and         2017     Restart and    2018 Guidance                2016A          2017A           2018F               2019F      2020F
               operational                   operational
             improvements                  improvements                                                   C1 cash cost (USD/t)
                                                                                                          Zinc contained production (kt)                                 10
Key investment highlights
#2 Excellence in smelting and mining
Full potential review of zinc smelting network completed in Q3 2017
• Zero to low-capex operational excellence initiatives identified for implementation over the coming years, focusing on:
Zinc smelter asset integrity;
Asset management;
Metallurgical excellence;
Productivity improvements
• Low capex debottlenecking initiatives to drive output to 1.2m tonnes per annum by 2020 on a consistent basis
• Operating cost reductions to be achieved by:
Production volume increases over a reduced fixed cost base; and
External spend optimisation
Zinc metal production (kt) Full indicative potential – Zinc smelters
Zn market metal DOC
(kt) (EUR/t)
1’015 1’019
-29 39 1,300 600
-47 1,200
550
1,100
1,000 500
Unplanned outages: Hobart 900
(13kt), Budel (30kt) and
800 450
Clarksville (5kt)
700
400
600
500 350
Planned outages at
400
Balen (11kt), Budel
300 300
(9kt), Clarksville (3kt)
and Hobart (6kt) 200
250
100
0 200
2016 Planned Unplanned Operational 2017 Operational 2018 2016A 2017A 2018F 2019F 2020F
maintenance outages Improvements improvements Guidance
Zinc market metal production (kt)
outages in 2018
11
Wood Mackenzie industry cost curve data used for global comparison zinc smeltersKey investment highlights
#3 Robust industry backdrop Strong macro
fundamentals
Continued robust demand
Key Sources of Demand(1) Global Slab Zinc Consumption(2)
Zinc (kt)
• The construction industry is the largest end consumer and 20,000
accounts for c. 50% of overall demand
• Zinc is used for its corrosion resistance in galvanised 16,000
steel, which accounts for c. 60% of zinc first use
• China is the biggest consumer of zinc accounting for c. 48% 12,000
of global demand
• Urbanisation and industrialisation in China has 8,000
resulted in a sharp increase in per capita zinc
consumption (from 4.8kg per head in 2015 to an 4,000
estimated 6.0kg per head by 2031)
0
2000 2005 2010 2015 2020 2025 2030 2035
China Asia (ex. China) Russia and Caspian
Europe North America Other
• Continued positive global industrial production growth
Demand • World consumption growth is forecast to average 1.9% p.a. from 2018 to 2023 with consumption
expected to grow from 14.4Mt in 2017 to 16.2Mt in 2023
outlook
(3)
• Ongoing urbanisation and industrialisation of the developing world will be a key driver
• Growing demand requires the construction of new smelter capacity around the end of the decade
(1) AME (3) WoodMckenzie LTO Q2 2018 12
(2) Wood MackenzieKey investment highlights
#3 Robust industry backdrop Strong macro
fundamentals
Additional concentrate production will return the market to balance
LME zinc price
LME Zinc price (USD/t) SHFE zinc stocks (USD/t)
(kt)
800 LME Zinc stocks 3,500
700
3,000
600
500
2,500
400
2,000
300
200
1,500
100
0 1,000
Jul- Jan- Jul- Jan- Jul- Jan- Jul-
2015 2016 2016 2017 2017 2018 2018
• The average annual requirement for new mine production is 500kt/a from 2017 to 2024
• Global mine production is forecast to increase by 10% in 2018 with 1,255kt of new production and
Supply expected to stabilise over the medium to long term. Major capacity additions in 2017 include:
outlook
(1) • Antamina 165kt, Rampura Agucha 150kt, Sindesar Khurd 50kt, Bisha 50kt and Penasquito 35kt
• Although still tight this additional capacity will move the concentrates market to balance in 2018, with a
small surplus expected in 2019. Tightness is forecast to continue through to 2020
(1) Source: Wood Mackenzie long term outlook Q2 2018 13Key investment highlights
#3 Robust industry backdrop
Zinc Market and Treatment Charges Treatment charges and metal price relationship
• Mines and Smelters operate in a symbiotic relationship of
dependence at the top end of the zinc market: • Concentrate surplus
• Surplus metal and
concentrates • Power shifts to
• They share zinc price exposure through free metal(1) and • LME price falls
smelters
• TCs increase
escalators on treatment charges(2), negotiating these TC • Mines cut production
• Smelters increase
terms between each other production
• Over the medium term zinc smelters receive a relatively • Concentrates draw • Metals draw down
constant share of the total value, with the zinc price having down • LME price increases
been positively correlated with TCs in the past • Power shifts to • Miners increase
miners production
• TCs fall
• Over the short term however, market dynamics influence the We are here
balance between metal prices and the treatment charges
Treatment Charge and LME zinc price
negotiated between smelters and mines
Share %
• The 2018 benchmark zinc TC, settled at the end of April 100
2018, of USD 147/dmt represents an historical low as 90
percentage of the payable zinc price 80
70
60
• As the bottleneck moves from concentrates to refining
50
capacity pricing power shifts to smelters, possibly leading to 40
a period of sustained high prices and rising TCs 30
20
10
0
1995
1996
1997
1998
1999
2000
2001
2002
2003
2004
2005
2006
2007
2008
2009
2010
2011
2012
2013
2014
2015
2016
2017
Smelter Share, % Mine Share, %
(1) Zinc smelters only pay for 85% of the metal contained in concentrates, but are able to recover approximately 96%. The difference is free metal
(2) Escalators and de-escalators were set at 0% for the 2017 and 2018 benchmark terms
14Key investment highlights
#3 Robust industry backdrop
Proactive approach to risk management
During the implementation of the transformation and turnaround strategy, the company has taken prudent measures
to mitigate downside risk on Zinc price and currency
4,000 H2’18: $3,842 Call
Upside from $3,117 Zinc Price
3,500 Upside from $2,800 H1’18: $3,094 Call Zinc hedge collars were effected to
ZINC PRICE
3,000 $2,437 Call protect 50% of free metal in H2 2018
Q2-Q4’17: $2,543 Call
2,500 $2,496 Call on the recent market move higher
H2’18: $2,600 Put
2,000 Q2-Q4’17: $2,172 Put H1’18: $2,300 Put 100% of Zinc Mining free zinc for 2019
$2,100 Put $2,127 Put (166kt) hedged during Q2 2018 at c.
1,500 USD 3,000/t
Jan.16 Jul.16 Jan.17 Jul.17 Jan.18 Jul.18 Jan.19 Nyrstar will continue to implement zinc
price and FX hedges on a rolling 6-9
month basis to protect downside risk
1.30
EUR-USD FX RATE
1.15 Call 1.14 Call
1.18 FX
1.20
1.10 Call EUR-USD hedges have been entered
1.10 into for H2 2018 and H1 2019 at 1.18
1.08 Put covering 100% of total transactional
1.05 Put
1.00 expenses
1.00 Put
0.90
Jan.16 Jul.16 Jan.17 Jul.17 Jan.18 Jul.18 Jan.19 AUD-USD hedges cover 100% of
total transactional expenses for H2
2018 and H1 20191
AUD-USD D FX RATE
0.85 H2’16: 0.83 Call
2017: 0.81 Call 2018: 0.80 Call
0.80 CAD-USD hedges cover 100% for H2
2018 and FY 20192
0.75
2018: 0.69 Put
0.70 H2’16: 0.68 Put H1’17: 0.68 Put
Other
0.65 H1’17: 0.62 Put All FX and commodity exposure for
0.60 Myra Falls hedged until end 2019
Jan.16 Jul.16 Jan.17 Jul.17 Jan.18 Jul.18 Jan.19
1 100% of H2 2018 AUD-USD exposure buying 0.70 puts and selling 0.80 calls; 100% of H1 2019 AUD-USD exposure is hedged with a fixed forward at 0.76
2 100% of H2 2018 CAD-USD exposure buying 1.32 puts and selling 1.36 calls; 100% of 2019 CAD-USD exposure is hedged with a fixed forward at 1.32Key investment highlights
#4 Significantly enhanced liquidity, capital structure and maturity profile
Further funding activities planned to extend maturities and maintain strong liquidity position
Outstanding balances at 30 June 2018 (€m) Continued proactive approach to balance sheet management
Drawing Capacity
Maturity
€m €m • Continue to monitor the market for additional opportunistic
Structural Debt financings to further strengthen the balance sheet, extend the
2018 Convertible Bond 29 29 Sept 2018 existing maturity profile and maintain strong liquidity
2019 High Yield Bond 350 350 Sept 2019
• Rollover prepays to offset amortisation profile
2022 Convertible Bond 115 115 July 2022
2024 High Yield Bond 500 500 Mar 2024 • Issuance of new HY bond to address 2019 maturity
Structural Debt 994 994
Outstanding maturity / anticipated amortisation profile
Working Capital Facilities
KBC
SCTF 300 600 Dec 2021
Loan from Related Party (Trafigura) 0 215 Dec 2019 €50m Trafigura facility
KBC 0 50 July 2019 All Prepays
Working capital facilities 300 865 €31m SCTF
€215m
HY Bonds
Prepays in Other Financial Liabilities / Convertible bonds
Deferred Income
Zinc Prepay (May-2018) – 12 month grace 107 May 2021 €124m
Silver Prepay PPR 34 Aug 2019
Silver Prepay (Apr-18) – 6 month grace 43 Apr 2019
Silver Prepay (Jun-17) – 10 month grace 26 Sep 2018 €600m
Silver Prepay (Dec-17) – 10 month grace 52 July 2019 €500m
Silver Prepay (Dec-17) – 12 month grace 9 Dec 2018
€350m
Copper Prepay (Dec-17) – 12 month grace 26 Dec 2021
€78m
Prepays 296
€115m
€62m
Perpetual Securities1 €29m
Perpetual Securities 185 2018 2019 2020 2021 2022 2023 2024
16
1 In May 2018, Nyrstar elected to defer repayments of the Perpetual Securities and remains in full compliance with its contractual obligations relating to the financing arrangementsKey investment highlights
#5 Expert management and Board
Nyrstar Management Committee
Hilmar Rode Michel Abaza Frank Rittner Sebastião Balbino Willie Smit
Chief Executive Officer Chief Financial Officer Chief Technical Officer Chief Commercial Officer Chief HR Officer
Superior operational expertise
• Strengthening of Board and management since November 2015
• Management team are fully committed to Nyrstar’s stated strategy
• Focus on operational excellence with knowledge of bringing complex metals projects into production
• Hilmar Rode appointed as CEO to draw on his significant metals processing experience to bring operational and
technical best practices to Nyrstar:
– Over 20 years of industry experience
– Recently led the successful transformation at Minera Escondida
– Led the restructuring and business optimisation of Kazzinc
• Michel Abaza, previously Corporate Treasurer at Safran Group joined Nyrstar as CFO in July 2018
17Key investment highlights
#6 Strategic relationship with supportive cornerstone shareholder
Trafigura support demonstrated through a variety of commercial and financial agreements
• This has effect for as long as Trafigura holds at least 20% but less than 50% of the shares in Nyrstar
Relationship
• Ensures all business dealings to continue on arm’s length basis and on normal commercial terms
Agreement
• Trafigura has two dependent directors on Nyrstar’s six person board
• Long term purchase agreements for approximately one third of Nyrstar’s zinc concentrate requirements
(600Kdmt per annum) and zinc metal off-take sales agreements for approximately one fifth of Nyrstar’s
Commercial zinc metal production (200Kt per annum) with a prepayment mechanism
Agreements
• Based on market prices with annually agreed premiums and TCs
• Provides Nyrstar with additional certainty of supply and leverages Trafigura’s strong marketing presence
• Trafigura WC Facility upsized to US$250m on a committed basis and extended on similar terms to end
2019
Capital • Nyrstar’s May 2018 US$125m zinc prepayment facility (ultimately upsized to US$150m in July 2018)
Commitment • Supported Nyrstar’s February 2016 €274m rights offering by underwriting up to €125m and participated
in the November 2017 €100m placement to maintain equity holding at c. 24.6%
• Leverage Trafigura’s financial relationships to achieve more beneficial terms for Nyrstar
18Table of Contents
I. Introduction
II. Key investment highlights
III. Financial and operating results
IV. Delivering a strong future for Nyrstar
V. Appendix
19Financial and operating results
Financial summary up to H1’18 Underlying EBITDA (€’m)
120
110
94
€m H1-17 H1-18 %
Revenue 1,806 1,930 124 7% 118
Metals Processing 117 88
MP U. EBITDA 117 118 1 1%
Mining U. EBITDA 15 28 13 87%
Mining1 32
Other U. EBITDA (22) (26) (5) 18% 15 28
Group Underlying EBITDA 111 120 9 8% Other (26) (26)
(22)
DD&A (77) (75) 2 (3%)
H1-174 H2-174 H1-18
Underlying Adjustments 2 (16) (18) -
Result from discontinued Capex (€’m)
35 (4) (39) (111%)
operations
Net financial expense (65) (71) (6) 9% 201
FX gain/(loss) (35) (5) 31 (86%) 161 40
Income tax (expense)/ benefit 9 1 (8) (89%) 134
Port Pirie Redevelopment 64 2
Loss for the period (21) (49) (29) 133%
124 68
Capex Metals Processing 78
MP Sustaining 59 55 (5) (7%) Mining1 63
19 37
Port Pirie Redevelopment 64 2 (61) (97%)
H1-17 H2-17 H1-18
MP Growth 17 13 (4) (24%)
Mining 19 63 44 232% FFO and FCF (€’m)
Group Capex 161 134 (27) (17%)
18
Funds From Operations (FFO) (111) 18 129 (116%) -76
-111
Free Cash Flow (FCF) (159) (58) 101 (64%) -193 -58 (FCF)
-47
Net Debt4 986 1,198 212 22%
FFO
-158 (FCF)
Interest & Finance Costs
Net Debt, inclusive of Zinc
1,243 1,487 245 20% -73
Prepay and perpetual securities
1 Net Debt is short term and long term liabilities, exclusive of Zinc Prepay and perpetual securities, minus cash
-266 (FCF) 20
H1 2017 H2 2017 H1 2018Financial and operating results
H1 2018 - Consistent safety and operating performance
Lagging Safety Indicators3
Safety, Health & Environment
13.6
• Significant milestones for safety were achieved in
RIR
H1 2018 at the Auby and Balen smelters reaching 2
9.8 DART
million and 1 million work hours DART free,
respectively 7.2
6.4 6.5 6.8 7.1
• No environmental events with material business 9.7
consequences occurred in H1’18 6.8
5.2 4.3
3.9 3.8 4.1
Production
2014 2015 2016 2017 12mma H1 2017 H1 2018
• Zinc metal production of 528kt, up 2% over H1’17
and in-line with FY’18 guidance of 1.05 to 1.1 million
tonnes
• Lead production at Port Pirie of 69kt, down 18% vs. Zinc metal production Zinc in concentrate
Lead metal production at
H1’17 due to the major planned blast furnace per site (kt) Port Pirie (kt) per site (kt)
maintenance shut in Q2’18 which impacted +30%
production by 21kt +2% -18%
518 528 84 69
• Zinc in concentrate production of 69kt, up 30% on
Auby 82 78 11 Langlois
H1’17, primarily due to restart of MTN and 69
53
optimisation of ETN Balen 117 137 Middle
16 22
Tennessee
Budel 140 133 5
Clarksville 59 52 East
32 36
Tennessee
Hobart 121 129
H1-17 H1-18 H1-17 H1-18 H1-17 H1-18
21Financial and operating results
Group underlying EBITDA – H1 2018 on H1 2017
(€m)
Macro MP Mining
-€24m +€44m -€11m
51
9 Other 1
(34)
Group 42 Zinc Group
€111m (11) €120m
(7)
(42) 44
118 MP
MP 117
Mining 28 Mining
15
Other (22) (26) Other
H1’17 Metal Strategic FX TC rate/ Metals Mining Other & H1’18
EBITDA prices hedges Other Processing Eliminations EBITDA
macro5
H1’17 H1’18
Zinc price (USD/t) 2,690 3,257 21%
B/M Zn TC (USD/dmt) 172 147 (15%)
FX (EUR/USD) 1.08 1.21 12%
FX (EUR/AUD) 1.44 1.57 9%
Zinc metal (kt) 518 528 2%
Zinc in concentrate (kt) 53 69 30%
22Financial and operating results
Net Debt evolution over Q2 2018
€m
(1,592) Zn Prepay & Perp Notes
Net Debt (1,487)
(241) (1,439) 0
(49)
(28)
66 (82) (241) (290)
233
20 (57)
(1,351)
(1351)
(1,198)
1198 (1,198)
Net Debt Group Capex Interest & Working Change Other Net Debt Change in Change in Net Debt
Mar’18 EBITDA Tax Capital in Ag/Zn exclusive Zn Zn prepay Perp Notes inclusive Zn
Prepays Prepay and Prepay and
Perp Notes Perp Notes
Jun’18 Jun’18
• Working capital inflow of EUR 240m in Q2’18 more than Working Capital movement (€’m)
offsetting the EUR 155m outflow experienced in Q1’18 33 Inflow
Outflow
• Interest and capex in-line with expectations (13)
52
233
• Amortisation of silver prepays was more than offset by the
174
issuance of new prepays in Q2’18
• Cash balance at the end of H1 2018 of EUR 78m with (26) 13
immediately available liquidity of EUR 643m FX Price Inventory Receivables Payables Customer Working
Volume Prepays Capital
Inflow
23Table of Contents
I. Introduction
II. Key investment highlights
III. Financial and operating results
IV. Delivering a strong future for Nyrstar
V. Appendix
24Delivering a strong future for Nyrstar
Delivering a strong future for Nyrstar
Set to deliver Positive Free Cash Flow for 2018
• Nyrstar is set to become a cash flow positive business from 2018 on the basis of three key pillars:
– Locking in an earnings uplift of ~ EUR 130m1 per annum from the fully ramped-up Port Pirie Redevelopment with all major
systems including slag caster and acid plant now in operation
– Delivering a step change in operational performance to unlock the full potential of the existing zinc smelter asset base
– Extracting maximum value from Mining by optimising the North American mines, including the ramp-up of the restarted Middle
Tennessee Mines and restart of Myra Falls, to operate for strong free cash flow
• Balance sheet has been substantially strengthened utilising a diverse range of funding opportunities with liquidity of EUR 643m
at the end of June 2018
• Zinc industry macros are supportive and fundamentals look strong
– Expecting a period of sustained demand growth
– Supply response likely to be muted
– Metal stocks are low and declining
1 EUR 130m uplift against 2016 Underlying EBITDA using 2016 macroeconomic assumptions
25Table of Contents
I. Introduction
II. Key investment highlights
III. Financial and operating results
IV. Delivering a strong future for Nyrstar
V. Appendix
26Appendix
H1 2018 underlying EBITDA sensitivity - annualised
FY 2018 Estimated annual 2018 underlying EBITDA impact (€’m)
Change
Parameter average
+/-10% Metals
price/rate
Processing Mining Group
EUR:USD* 1.21 -/+ 10% +99 (81) +12 (10) +112 (91)
Zinc price $3,257/t -/+ 10% (37) +37 (32) +32 (69) +69
EUR:AUD* 1.57 -/+ 10% (33) +27 - - (33) +27
Zinc B/M TC $147/dmt -/+ 10% (21) +21 +3 (3) (18) +18
Silver price $16.65/oz -/+ 10% (5) +5 (0) +0 (6) +6
Copper price $6,917/t -/+ 10% (2) +2 (1) +1 (2) +2
Gold price $1,318/oz -/+ 10% (1) +1 - - (1) +1
Lead price $2,456/t -/+ 10% (1) +1 - - (1) +1
Lead B/M TC $99/dmt -/+ 10% (2) +2 - - (2) +2
EUR:CHF 1.17 -/+ 10% - - - - (5) +4
The sensitivities give the estimated effect on underlying EBITDA assuming that each individual price or exchange rate moved in isolation. The
relationship between currencies and commodity prices is a complex one and movements in exchange rates can affect movements in commodity
prices and vice versa. The exchange rate sensitivities include the effect on operating costs but exclude the effect on the revaluation of foreign 27
currency working capital. They should therefore be used with care.Appendix
Transformation EBITDA uplift driven by substantially increased
throughput and margin on internal zinc smelter residues
Indicative Port Pirie
Port Pirie throughput feed content1 Indicative margin per metal2
k dmt
Int. Int.
2016 2020 2016-20
Internal Residues Res. Res.
Pb Concentrates 620 Lead
3 30 Lead ~99%
(kt)
Silver
0.4 3.8 Silver 75-85%
(Moz)
Gold Blended
5 25 Gold 80-90% 2016-20
260 (koz) Margin
Copper
1 3 Copper 90-95%
(kt) Lead 12-21%
Zinc
360 10 25 Zinc ~15%
(kt) Silver 8-17%
60
Pb Pb Gold 15-16%
2016 2020 2016
Conc.’s Conc.’s
Lead Copper 90-95%
180 220 Lead ~10%
(kt)
360 Silver Zinc Uplift3 0.5-1.0%
300 15.0 20.0 Silver 5-7%
(Moz)
Gold
40 160 Gold 6-9%
(koz)
Copper
5 6 Copper 90-95%
(kt)
Zinc
2016 2020 15 18 Zinc ~90%
(kt)
1 Content values presented on rounded basis
2 Indicative margin represents approx. net value capture i.e. (Payable out – Payable in / Recoveries)
3 Blended Zinc margin uplift represents increase in average zinc free metal capture at segment level attributable to Port Pire Transformation
28Appendix
Increased throughput and increased margins provide a substantial
segment earnings uplift once ramped-up
1 Indicative production and consumption 2 Indicative margin %1 3 Prices2
2016 Average
Production 2016 2018 2019 2020 Margin 2016 2018 2019 2020 Prices
Lead (kt) 182 185 230 250 Lead 12% 19% 20% 21% Lead USD 1,872/t
Silver (Moz) 15 16 21 23 Silver 8% 12% 17% 17% Silver USD 17/oz
Gold (koz) 46 125 165 180 Gold 16% 16% 16% 16% Gold USD 1,250/oz
Copper (kt)
Zinc (kt, segment)
5
1016
6
1060
7
1060
8
1060
X Copper
Zinc
95%
0.50%
90%
1.0%
90%
1.0%
90%
1.0%
X Copper USD 4,863/t
Zinc USD 2,095/t
=
Acid (kt) 1357 1600 1725 1725 Acid n/a n/a n/a n/a Acid USD 40/t
2016 Avg Realised
Consumption 2016 2018 2019 2020
Pb TC
Pb conc. (k dmt) 300 280 340 360 USD 190/dmt
Int Res (k dmt) 60 150 210 260 n/a
4 Indicative Gross Profit uplift less DOC = EBITDA uplift (mEUR)
Indicative U.EBITDA Uplift 2018 2019 2020
Uplift in Gross Profit 66 138 164
Change in Port Pirie DOC3 (24) (34) (34)
Uplift in EBITDA 42 104 130
1 Margin represents increase in net value capture i.e. (Payable out – Payable in / Recoveries)
2 Uplift based on applying 2016 annual average metal prices, FX rates and 2016 commercial terms
3 Increase in Port Pirie DOC converted to EURm applying 2016 annual average EUR:AUD FX rate
29Appendix
2018 guidance
Production Capex
2017 2018 2017 2018
€’m
Actual Guidance Actual Guidance
Metals Processing
Zinc (kt) 1,019 1,050 – 1,100 Metals Processing 303 130 - 150
Mining - metal in concentrate Mining 56 70 - 90
Zinc (kt) 123 160 – 180
Group capex 362 200 - 240
• Estimated impact of maintenance shuts on 2018 Planned maintenance shuts
production have been taken into account when Smelter & production step Timing and duration Estimated
determining zinc metal guidance for 2018 impacted impact
Auby – roaster Q2: 2 weeks Nil
Balen – roaster #5 Q2: 1 week Nil
Balen – roaster #4 Q4: 4 weeks Nil
Budel – roaster #1 Q4: 2 weeks Nil
Clarksville – roaster Q3: 4 weeks 8,000 tonnes
Hobart – roaster #5 Q2: 3 weeks Nil
Port Pirie – blast furnace & slag Q2: 6 weeks 21,000 tonnes
fumer
Port Pirie – TSL furnace Q4: 1 week Nil
30For further information:
Anthony Simms
Head of Investor Relations & Insured Risk
D: +41 (0)44 745 8157
M: +41 (0)79 722 2152
E: anthony.simms@nyrstar.com
www.nyrstar.com
31You can also read