Review of FX Market Developments and Outlook - European Central ...
←
→
Page content transcription
If your browser does not render page correctly, please read the page content below
SECURITIES DIVISION

Review of FX Market Developments and Outlook

Prepared by a Goldman Sachs sales and trading desk, which may have a position in the products
mentioned that is inconsistent with the views expressed in this material. In evaluating this material, you
should know that it could have been previously provided to other clients and/or internal Goldman Sachs
personnel, who could have already acted on it. The views or ideas expressed here are those of the desk
and/or author only and are not an “official view” of Goldman Sachs; others at Goldman Sachs may have
opinions or may express views that are contrary to those herein. This material is not independent advice
and is not a product of Global Investment Research. This material is a solicitation of derivatives business
generally, only for the purposes of, and to the extent it would otherwise be subject to, CFTC Regulations     June, 2018
1.71 and 23.605.
SECURITIES DIVISION
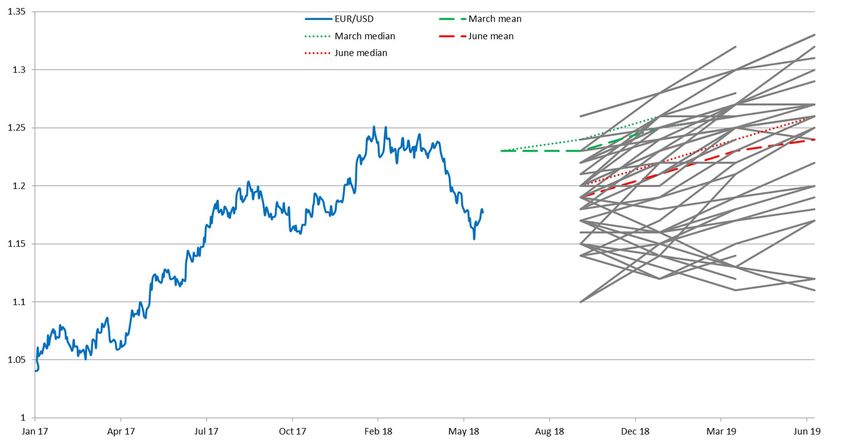
EUR/USD Consensus Forecasts
Expectations Marked to Market, but Bias Remains to the Topside, with Greater
Dispersion
Individual analyst forecasts
Source: Goldman Sachs Securities Division, Bloomberg
2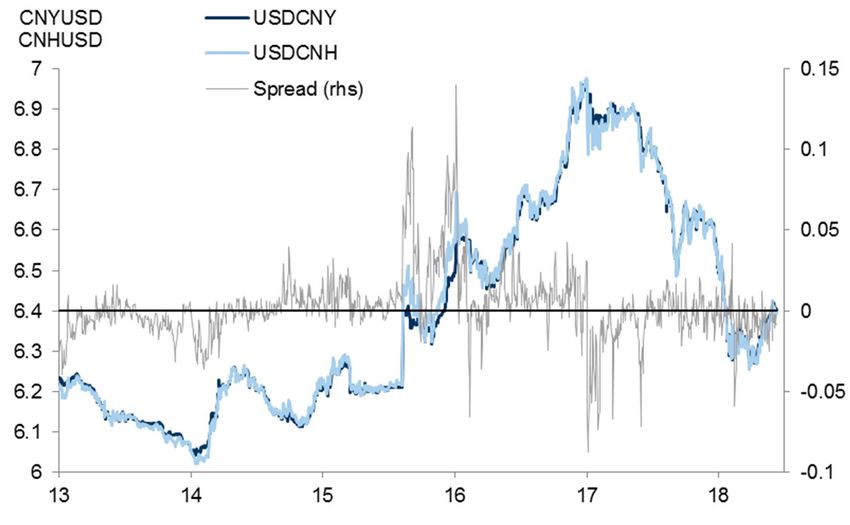
SECURITIES DIVISION
                     Front End Rates Divergence
                     Relative Rates Expectations Driving EUR/USD

Source: Goldman Sachs Securities Division, Bloomberg

                                                                                     3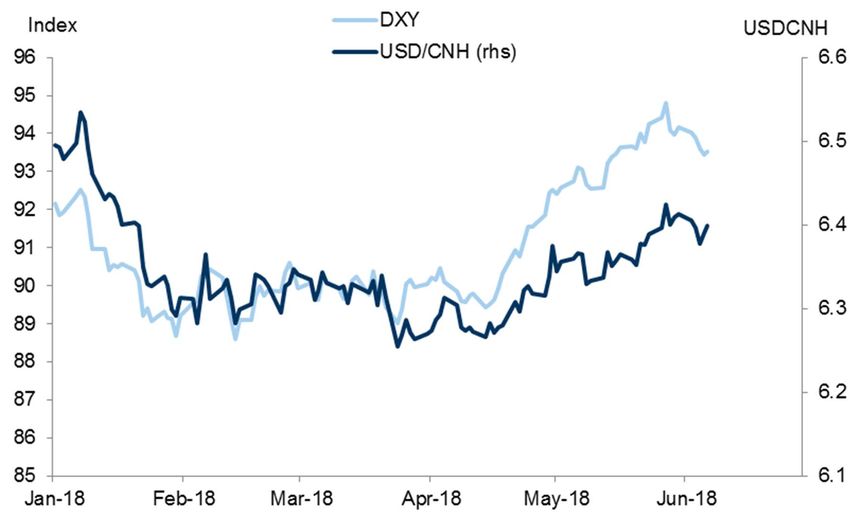
SECURITIES DIVISION
                    Growth Divergence
                    G3: Decoupling Again

 Percent change, annual rate                                                                 Percent change, annual rate
  4                                                                                                                   5

                                                                                                                      4

  3
                                                                                                                      3

                                                                                                                      2
  2

                                                                                                                      1

  1                                                                                                                   0

                                                                                                                      (1)
                                                                                      US CAI, 3mma
  0
                                                                                      DM CAI, 3mma                    (2)
                                                                                      EA CAI, 3mma
                                                                                      JP CAI, 3mma (right)            (3)
 (1)

                                                                                                                      (4)

 (2)                                                                                                                  (5)
       2010           2011               2012      2013   2014   2015   2016   2017              2018

Source: Goldman Sachs Global Investment Research

                                                                                                                           4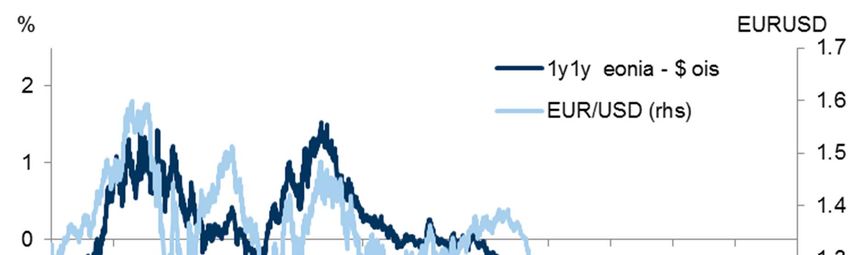
SECURITIES DIVISION
                     Positioning: CFTC
                     Partial Reversal from Multi-year Highs in USD Shorts

       50                                                                                                             50

       40                                                                                                             40
                                                                              USD

       30                                                                                                             30

       20                                                                                                             20

                                                                                                                             $bn
$bn

       10                                                                                                             10

        0                                                                                                             0

      (10)                                                                                                            (10)

      (20)                                                                                                            (20)

      (30)                                                                                                            (30)

      (40)                                                                                                            (40)

      (50)                                                                                                            (50)
         2014                             2015                       2016                       2017       2018
                IMM: Net Speculative USD Positioning     EUR   JPY   GBP    AUD     CAD   CHF      NZD

Source: CFTC, Goldman Sachs Global Investment Research

                                                                                                                                   5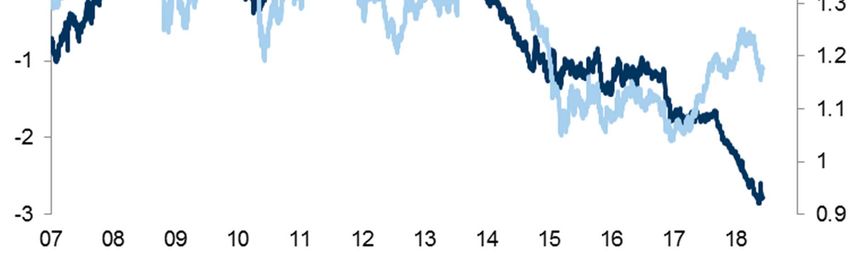
SECURITIES DIVISION
                    USD: Recent Moves Corrective
                    Rising Rate Differentials Don’t Necessarily Mean USD Strength

                       Index, Month of First Hike = 100
                                                                                Trade-Weighted USD During Fed Tightening Cycles (by starting month):
                       115
                                                                                                                                   Mar-83            Feb-88

                                                                                                                                   Feb-94            Jun-99
                       110
                                                                                                                                   Jun-04            Dec-15

                       105

                       100

                        95

                        90

                        85
                             -6     -4      -2      0       2      4       6       8      10      12     14      16      18     20      22      24      26    28     30
                                                                                Months Relative to First Hike
                       Note: Chart shows USD performance until start of Fed easing, except for 2004-06 cycle, where chart ends six months after last hike.

Source: Goldman Sachs Global Investment Research

                                                                                                                                                                                     6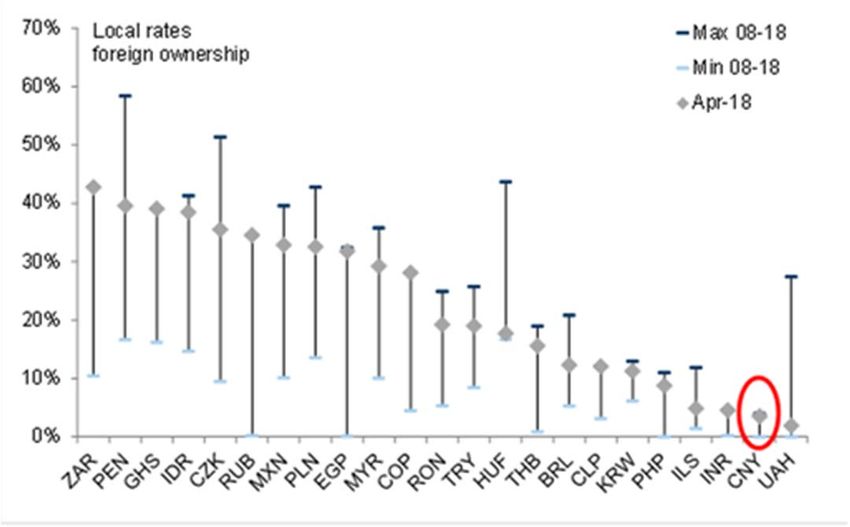
SECURITIES DIVISION
                    EUR: Lower Growth, Higher Risks
                    Decline in EUR FV Combination of Growth & Italy Risks

Source: Bloomberg, Goldman Sachs Global Investment Research

                                                                                              7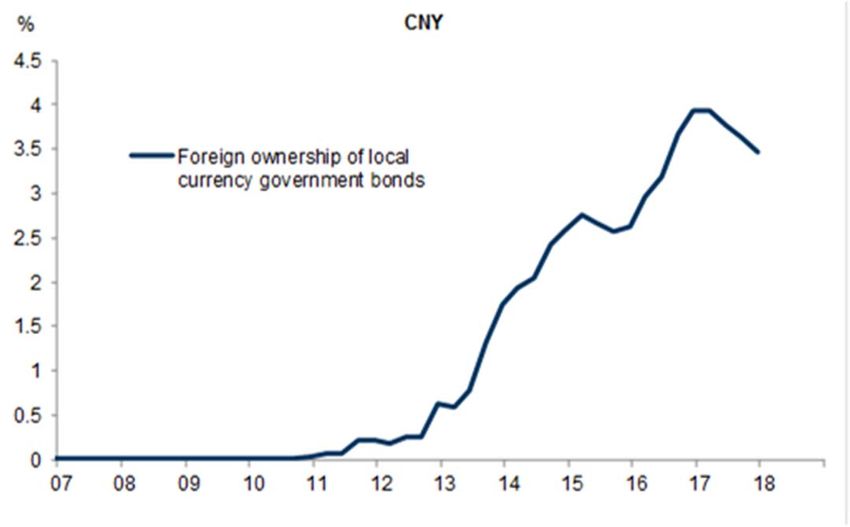
SECURITIES DIVISION
                    GBP: Trading a Supply Shock
                    Growth Underperforming Rest of G10

                                                               Current Activity Indicators, 3m avg
6.0%                                                                                                                              6.0%

5.0%                                                                                                                              5.0%

4.0%
                                                       Rest of G10 Range                                                          4.0%

3.0%                                                                                                                              3.0%

2.0%                                                                                                                              2.0%

1.0%                                                                                                                              1.0%

0.0%                                                                                                                              0.0%
  Jan-2014                              Jan-2015                           Jan-2016                     Jan-2017     Jan-2018
                                                                  UK                     Rest of G10 Average

Source: Bloomberg, Goldman Sachs Global Investment Research

                                                                                                                                     8
SECURITIES DIVISION
GBP: Trading a Supply Shock
Sterling Pulled by Volatile Rate Expectations
81
100
80
80
79
60 78
77
40
76
20
75
0 74
Aug-2017 Nov-2017 Feb-2018 May-2018
Market-implied probability of Bank Rate hike at August 2018 BoE meeting (left) Trade-weighted Sterling (right)
Source: Bloomberg, Goldman Sachs Global Investment Research
9SECURITIES DIVISION
JPY: BOJ Against the Wall
Shifting BoP Flows
Source: Bank of Japan, Japan Ministry of Finance. Goldman Sachs Global Investment Research
10SECURITIES DIVISION
CHF: EUR-specific Safe Haven
$850bn in Crisis Inflows, with Spikes on Europe Risk Events
80 80
Euro area tensions
Taper tantrum
60 GFC 60
ECB easing
40 40
20 20
CHF bn
CHF bn
0 0
(20) (20)
(40) (40)
(60) (60)
(80) (80)
2000 2002 2004 2006 2008 2010 2012 2014 2016 2018
CHF Net Private Capital Flows 4-quarter average
Source: Haver Analytics, Goldman Sachs Global Investment Research
11SECURITIES DIVISION
CAD: Back to Hiking Soon
Inflation On Target
Percent change, year ago Percent change, year ago
Bank of Canada Measures of Core Inflation
2.6 2.6
Trim Median Common BoC Target
2.4 2.4
2.2 2.2
2.0 2.0
1.8 1.8
1.6 1.6
1.4 1.4
1.2 1.2
1.0 1.0
0.8 0.8
2010 2011 2012 2013 2014 2015 2016 2017 2018
Source: Haver Analytics, Goldman Sachs Global Investment Research
12SECURITIES DIVISION
AUD: Next in Line
Lagging Higher Commodity Prices
AUDUSD Index
AUD/USD GS Terms of Trade Index (Right)
0.82 92
0.81
90
0.80
0.79 88
0.78
86
0.77
84
0.76
0.75 82
0.74
80
0.73
0.72 78
Jun-17 Aug-17 Oct-17 Dec-17 Feb-18 Apr-18 Jun-18
Source: Goldman Sachs Global Investment Research
13SECURITIES DIVISION
Emerging Markets FX
A Sharp USD Move Rather Than an EM Selloff
1% Cumulative mean % appreciation s ince Apr 16, 2018
0%
-1%
G10 vs. USD
-2%
EM (ex. CEE) vs. USD
-3%
-4%
-5%
Source: Thomson Reuters, Goldman Sachs Global Investment Research
14SECURITIES DIVISION
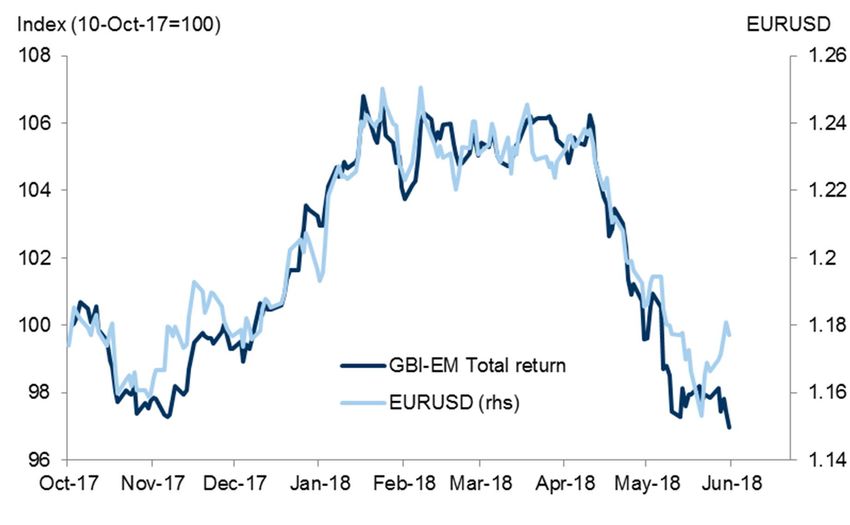
GBI-EM vs EUR/USD
EM Local Bond Total Returns Almost Entirely a Function of DXY
Source: Goldman Sachs, Goldman Sachs Global Investment Research
15SECURITIES DIVISION
Foreign Ownership is at Historical High
Positioning Remains a Key Vulnerability
70% Local currency bonds foreign 70%
Max 08-18
owners hip
Min 08-18
60% 60%
Last
50% 50%
40% 40%
30% 30%
20% 20%
10% 10%
0% 0%
Source: Haver Analytics, IMF, Asian Development Bank, Reserve Bank of India, Goldman Sachs Global Investment Research
16SECURITIES DIVISION
FX Forecasts and Forwards
Current 3-Month Horizon 6-Month Horizon 12-Month Horizon
05-Jun-18 Forward Forecast Forward Forecast Forward Forecast
G10
EUR/$ 1.17 1.18 1.15 1.19 1.20 1.21 1.25
£/$ 1.33 1.34 1.28 1.34 1.32 1.36 1.36
AUD/$ 0.77 0.77 0.78 0.77 0.80 0.77 0.82
NZD/$ 0.70 0.70 0.70 0.70 0.71 0.71 0.73
$/CAD 1.29 1.29 1.23 1.29 1.21 1.28 1.18
$/CHF 0.99 0.98 1.02 0.97 1.00 0.95 1.00
$/NOK 8.12 8.09 8.17 8.06 7.75 8.00 7.36
$/SEK 8.76 8.70 8.91 8.63 8.54 8.49 8.16
$/JPY 110 109 110 108 112 107 115
EMEA
$/CZK 21.98 21.87 22.17 21.77 20.63 21.45 19.40
$/HUF 273 271 274 269 258 266 244
$/PLN 3.65 3.65 3.65 3.64 3.42 3.62 3.24
$/RON 3.97 3.99 4.04 4.00 3.88 4.01 3.76
$/RUB 62.05 62.65 60.00 63.20 60.00 64.16 60.00
$/UAH 26.13 27.03 26.50 27.88 25.50 29.63 25.00
$/TRY 4.59 4.76 4.70 4.94 4.50 5.32 4.40
$/ILS 3.57 3.54 3.50 3.52 3.35 3.47 3.30
$/ZAR 12.57 12.72 11.75 12.87 11.50 13.15 11.00
$/NGN 361 365 350 369 350 381 350
Americas
$/ARS 25.0 27.3 24.0 29.3 24.0 32.7 26.0
$/BRL 3.73 3.77 3.50 3.80 3.30 3.85 3.10
$/MXN 20.0 20.3 19.0 20.6 19.0 21.2 18.5
$/CLP 632 631 610 632 590 632 570
$/PEN 3.27 3.28 3.23 3.28 3.18 3.30 3.15
$/COP 2870 2879 2750 2894 2700 2924 2650
Asia
$/CNY 6.41 6.44 6.30 6.47 6.25 6.51 6.20
$/HKD 7.85 7.83 7.85 7.82 7.85 7.80 7.85
$/INR 67.1 67.8 67.5 68.6 63.0 69.9 62.0
$/KRW 1071 1067 1070 1063 1050 1054 1020
$/MYR 3.98 4.00 3.95 4.01 3.80 4.03 3.65
$/SGD 1.34 1.33 1.32 1.33 1.30 1.33 1.28
$/TWD 29.8 29.5 29.8 29.3 28.5 28.9 28.0
$/THB 32.0 31.9 32.0 31.8 30.5 31.6 30.0
$/IDR 13865 14027 14000 14209 13100 14537 13000
$/PHP 52.5 53.0 51.3 53.3 51.5 54.0 52.0
Euro Crosses
EUR/GBP 0.88 0.88 0.90 0.88 0.91 0.89 0.92
EUR/CHF 1.16 1.16 1.17 1.15 1.20 1.15 1.25
EUR/NOK 9.50 9.53 9.40 9.57 9.30 9.65 9.20
EUR/SEK 10.24 10.24 10.25 10.24 10.25 10.25 10.20
EUR/CZK 25.7 25.8 25.5 25.8 24.8 25.9 24.3
EUR/HUF 319 319 315 320 310 321 305
EUR/PLN 4.27 4.30 4.20 4.32 4.10 4.36 4.05
EUR/RON 4.64 4.70 4.65 4.74 4.65 4.84 4.70
EUR/RUB 72.6 73.8 69.0 75.0 72.0 77.4 75.0
Source: Goldman Sachs Global Investment Research
Simulated results are for illustrative purposes only. GS provides no assurance or guarantee that the strategy will operate or would have operated in the past in a manner consistent with the above analysis. Past performance figures are not a reliable indicator of future
results
17SECURITIES DIVISION
FX Fair Values
Current 12-Month Horizon 12-Month Horizon
GSFEER GSDEER Average level GSFEER GSDEER Average
05-Jun-18 Forward Forecast Forward Forecast
G10
EUR/$ 1.17 1.21 1.25 1.01 1.30 1.20 -3% -6% 16% -10% -1%
GBP/$ 1.33 1.36 1.36 1.02 1.46 1.31 -2% -2% 31% -9% 5%
AUD/$ 0.77 0.77 0.82 0.68 0.82 0.77 0% -7% 13% -7% 0%
NZD/$ 0.70 0.71 0.73 0.63 0.71 0.68 0% -4% 12% -1% 4%
$/CAD 1.29 1.28 1.18 1.55 1.20 1.32 -1% -9% 20% -7% 2%
$/CHF 0.99 0.95 1.00 1.11 0.99 1.03 -3% 1% 13% 0% 4%
EUR/NOK 9.50 9.65 9.20 10.86 7.87 8.87 2% -3% 14% -17% -7%
EUR/SEK 10.24 10.25 10.20 7.70 8.52 8.25 0% 0% -25% -17% -19%
$/JPY 109.7 106.6 115.0 116.9 95.6 102.7 -3% 5% 7% -13% -6%
EM
EUR/CZK 25.7 25.9 24.3 23.6 27.6 26.3 1% -6% -8% 7% 2%
EUR/HUF 319 321 305 295 309 304 1% -4% -7% -3% -5%
EUR/PLN 4.27 4.36 4.05 3.12 4.00 3.71 2% -5% -27% -6% -13%
EUR/RON 4.64 4.84 4.70 - - - 4% 1% - - -
$/RUB 62.0 64.2 60.0 63.9 60.4 61.6 3% -3% 3% -3% -1%
$/TRY 4.59 5.32 4.40 4.95 2.70 3.45 16% -4% 8% -41% -25%
$/ILS 3.57 3.47 3.30 4.41 3.67 3.92 -3% -7% 24% 3% 10%
$/ZAR 12.6 13.2 11.0 14.8 9.7 11.4 5% -12% 18% -22% -9%
$/ARS 24.97 32.72 26.00 - - - 31% 4% - - -
$/BRL 3.73 3.85 3.10 2.83 3.38 3.19 3% -17% -24% -10% -14%
$/MXN 20.0 21.2 18.5 17.8 15.7 16.4 6% -8% -11% -22% -18%
$/CLP 632 632 570 658 583 608 0% -10% 4% -8% -4%
$/PEN 3.27 3.30 3.15 2.95 3.03 3.01 1% -4% -10% -7% -8%
$/COP 2870 2924 2650 3607 2563 2911 2% -8% 26% -11% 1%
$/CNY 6.41 6.51 6.20 10.08 5.49 7.02 2% -3% 57% -14% 10%
$/HKD 7.85 7.80 7.85 10.32 7.57 8.49 -1% 0% 32% -4% 8%
$/INR 67.1 69.9 62.0 71.9 67.1 68.7 4% -8% 7% 0% 2%
$/KRW 1071 1054 1020 1359 1248 1285 -2% -5% 27% 17% 20%
$/MYR 3.98 4.03 3.65 5.79 3.54 4.29 1% -8% 45% -11% 8%
$/SGD 1.34 1.33 1.28 1.59 1.46 1.50 -1% -4% 19% 9% 13%
$/TWD 29.8 28.9 28.0 35.9 29.6 31.7 -3% -6% 20% -1% 6%
$/THB 32.0 31.6 30.0 28.5 33.0 31.5 -1% -6% -11% 3% -2%
$/IDR 13865 14537 13000 14709 14372 14484 5% -6% 6% 4% 4%
$/PHP 52.5 54.0 52.0 91.2 48.7 62.9 3% -1% 74% -7% 20%
*Note: blue bar means currency is overvalued vs USD (or EUR)
red bar means currency is undervalued vs USD (or EUR)
Source: Goldman Sachs Global Investment Research
Simulated results are for illustrative purposes only. GS provides no assurance or guarantee that the strategy will operate or would have operated in the past in a manner consistent with the above analysis. Past performance figures are not a reliable indicator of future
results
18Analysis of FX Developments in China
19SECURITIES DIVISION
USD/CNH Performance YTD
Its All About the DXY
Source: Goldman Sachs Securities Division, Bloomberg
20SECURITIES DIVISION
Onshore / Offshore Spot Spread
Lower Volatility, Narrower Spread
Source: Goldman Sachs Securities Division, Bloomberg
21SECURITIES DIVISION
CNY’s Countercyclical Factor
Implicit Presence Remains
Source: Goldman Sachs Global Investment Research, Thomson Reuters
22SECURITIES DIVISION
CNY: Low Foreign Participation in
Local Currency Government Bonds
Source: Haver Analytics, Asia Development Bank, IMF, Reserve Bank of India, Goldman Sachs, Goldman Sachs Global Investment Research
23SECURITIES DIVISION
GS Projections of China’s Bond Inflows
Capital a/c Liberalisation and Fixed Income Inflow a Potential Game Changer
Going Forward
Source: PBOC, Goldman Sachs Global Investment Research
24SECURITIES DIVISION
China Macro Forecasts
Simulated results are for illustrative purposes only. GS provides no assurance or guarantee that the strategy will operate or would have operated in the past in a manner consistent with the above
analysis. Past performance figures are not a reliable indicator of future results
25SECURITIES DIVISION
Disclaimer
This message has been prepared by personnel in the Securities Division of one or more affiliates of The Goldman Sachs Group, Inc. ("Goldman Sachs") and is not the product of
Global Investment Research. It is not a research report and is not intended as such.
Non-Reliance and Risk Disclosure: This material is for the general information of our clients and is a solicitation of derivatives business generally, only for the purposes of, and to the extent
it would otherwise be subject to, CFTC Regulations 1.71 and 23.605. This material should not be construed as an offer to sell or the solicitation of an offer to buy any security in any
jurisdiction where such an offer or solicitation would be illegal. We are not soliciting any specific action based on this material. For the purposes of U.S. rules and regulations, it does not
constitute a recommendation or take into account the particular investment objectives, financial conditions, or needs of individual clients. Before acting on this material, you should consider
whether it is suitable for your particular circumstances and, if necessary, seek professional advice. The price and value of the investments referred to in this material and the income from
them may go down as well as up, and investors may realize losses on any investments. Past performance is not a guide to future performance. Future returns are not guaranteed, and a loss
of original capital may occur. We do not provide tax, accounting, or legal advice to our clients, and all investors are advised to consult with their tax, accounting, or legal advisers regarding any
potential investment. The material is based on information that we consider reliable, but we do not represent that it is accurate, complete and/or up to date, and it should not be
relied on as such. Opinions expressed are our current opinions as of the date appearing on this material only and only represent the views of the author and not those of
Goldman Sachs, unless otherwise expressly noted.
Conflict of Interest Disclosure: We are a full-service, integrated investment banking, investment management, and brokerage firm. The professionals who prepared this material are paid in
part based on the profitability of The Goldman Sachs Group, Inc., which includes earnings from the firm's trading, capital markets, investment banking and other business. They, along with
other salespeople, traders, and other professionals may provide oral or written market commentary or trading strategies to our clients that reflect opinions that are contrary to the opinions
expressed herein or the opinions expressed in research reports issued by our Research Departments, and our market making, investing and lending businesses may make investment
decisions that are inconsistent with the views expressed herein. In addition, the professionals who prepared this material may also produce material for, and from time to time, may advise or
otherwise be part of our trading desks that trade as principal in the securities mentioned in this material. This material is therefore not independent from our interests, which may conflict with
your interests. We and our affiliates, officers, directors, and employees, including persons involved in the preparation or issuance of this material, may from time to time have "long" or "short"
positions in, act as principal in, and buy or sell the securities or derivatives (including options) thereof in, and act as market maker or specialist in, and serve as a director of, companies
mentioned in this material. In addition, we may have served as manager or co manager of a public offering of securities by any such company within the past three years.
Not a Fiduciary: To the extent this material is provided to an employee benefit plan or account subject to the Employee Retirement Income Security Act of 1974, as amended ("ERISA") or
Section 4975 of the Internal Revenue Code of 1986, as amended (the "Code") (each, a "Benefit Plan Investor"), by accepting this material such Benefit Plan Investor will be deemed to have
represented, warranted and acknowledged that (1) the Benefit Plan Investor is represented by a fiduciary that is independent of Goldman Sachs and its affiliates (the "Independent Fiduciary"),
(2) the Independent Fiduciary is a bank (as defined in section 202 of the Investment Advisers Act of 1940 (the "Advisers Act")) or a similar institution that is regulated and supervised and
subject to periodic examination by a State or Federal agency; an insurance carrier which is qualified under the laws of more than one State to perform the services of managing, acquiring or
disposing of assets of a plan; an investment adviser registered under the Advisers Act or, if not registered as an investment adviser under the Advisers Act by reason of paragraph (1) of
section 203A, is registered as an investment adviser under the laws of the State in which it maintains its principal office and place of business; a broker-dealer registered under the Securities
Exchange Act of 1934; or an Independent Fiduciary that holds or has under management or control total assets of at least $50 Million; (3) the Independent Fiduciary is capable of evaluating
investment risks independently, both in general and with regard to the information contained in this material; (4) the Independent Fiduciary is a fiduciary under ERISA and/or the Code with
respect to, and is responsible for exercising independent judgment in evaluating, the information contained in this material; (5) neither Goldman Sachs nor its affiliates are undertaking to
provide impartial investment advice, or to give advice in a fiduciary capacity, in connection with the information contained in this material or with respect to any Benefit Plan Investor's
subsequent investment decisions; and (6) any financial interest of Goldman Sachs and its affiliates is or has been disclosed. To the extent this material is provided to any other recipient, this
material is provided solely on the basis that the recipient has the capability to independently evaluate investment risk and is exercising independent judgment in evaluating investment
decisions in that its investment decisions will be based on its own independent assessment of the opportunities and risks presented by a potential investment, market factors and other
investment considerations.
26SECURITIES DIVISION
Disclaimer
Not a Municipal Advisor: Except in circumstances where Goldman Sachs expressly agrees otherwise in writing, Goldman Sachs is not acting as a municipal advisor and the opinions or
views contained herein are not intended to be, and do not constitute, advice, including within the meaning of Section 15B of the Securities Exchange Act of 1934.
Legal Entities Disseminating this Material: This material is disseminated in Australia by Goldman Sachs Australia Pty Ltd (ABN 21 006 797 897); in Canada by either Goldman Sachs
Canada Inc. or Goldman Sachs & Co. LLC; in Hong Kong by Goldman Sachs (Asia) L.L.C. or by Goldman Sachs Asia Bank Limited, a restricted licence bank; in Japan by Goldman Sachs
Japan Co., Ltd.; in the Republic of Korea by Goldman Sachs (Asia) L.L.C., Seoul Branch; in New Zealand by Goldman Sachs New Zealand Limited; in Singapore by Goldman Sachs
(Singapore) Pte. (Company Number: 198602165W), by Goldman Sachs Futures Pte. Ltd (Company Number: 199004153Z) or by J.Aron & Company (Singapore) Pte (Company Number:
198902119H); in India by Goldman Sachs (India) Securities Private Limited, Mumbai Branch; in Ireland by Goldman Sachs Bank (Europe) Public Limited Company; in Europe by Goldman
Sachs International ("GSI"), unless stated otherwise; in France by Goldman Sachs Paris Inc. et Cie and/or GSI; in Germany by GSI and/or Goldman Sachs AG; in the Cayman Islands by
Goldman Sachs (Cayman) Trust, Limited; in Brazil by Goldman Sachs do Brasil Banco Múltiplo S.A.; and in the United States of America by Goldman Sachs & Co. LLC (which is a member of
FINRA, NYSE and SIPC) and by Goldman Sachs Bank USA. You may obtain information about SIPC, including the SIPC brochure, by contacting SIPC (website: http://www.sipc.org/; phone:
202-371-8300). GSI, which is authorised by the Prudential Regulation Authority ("PRA") and regulated by the Financial Conduct Authority ("FCA") and the PRA, has approved this material in
connection with its distribution in the United Kingdom and European Union. GSI, whose registered office is at Peterborough Court, 133 Fleet Street, London EC4A 2BB, appears in the FCA's
Register (Registration No.: 142888). GSI is registered as a Private Unlimited Company in England and Wales (Company Number: 2263951) and its VAT registration number is GB 447 2649
28. GSI is subject to the FCA and PRA rules and guidance, details of which can be found on the websites of the FCA and PRA at www.fca.org.uk and www.bankofengland.co.uk/pra. The FCA
is located at 25 The North Colonnade, Canary Wharf, London E14 5HS, and the PRA is located at Bank of England, 20 Moorgate, London EC2R 6DA. Unless governing law permits
otherwise, you must contact a Goldman Sachs entity in your home jurisdiction if you want to use our services in effecting a transaction in the securities mentioned in this material. This material
is not for distribution to retail clients, as that term is defined under The European Union Markets in Financial Instruments Directive (2004/39/EC), and any investments, including derivatives,
mentioned in this material will not be made available by us to any such retail client.
Phone recording: Telephone conversations with Goldman Sachs personnel may be recorded and retained.
Reproduction and Re-Distribution: Without our prior written consent, no part of this material may be (i) copied, photocopied or duplicated in any form by any means or (ii) redistributed.
Notwithstanding anything herein to the contrary, and except as required to enable compliance with applicable securities law, you (and each of your employees, representatives and other
agents) may disclose to any and all persons the U.S. federal income and state tax treatment and tax structure of the transaction and all materials of any kind (including tax opinions and other
tax analyses) that are provided to you relating to such tax treatment and tax structure, without Goldman Sachs imposing any limitation of any kind.
Information Not for Further Dissemination: To the extent this communication contains Goldman Sachs’ pricing information, such pricing information is proprietary and/or confidential and is
provided solely for the internal use of the intended recipient(s). You are notified that any unauthorized use, dissemination, distribution or copying of this communication or its contents,
including pricing information, in whole or in part, is strictly prohibited. Further, unless prohibited by local law, any use, review or acceptance of this information is subject to and manifests your
agreement with Goldman Sachs to use such information only in accordance with the terms set forth above. Goldman Sachs has caused its proprietary information to be delivered to you in
reliance upon such agreement.
Receipt of Orders: An order sent to Goldman Sachs by email or instant message is not deemed to be received by Goldman Sachs until a Goldman Sachs representative verifies the order
details with a phone call to the client or acknowledges receipt of the order via email or instant message to the client. Goldman Sachs does not accept client orders sent via fax or voicemail
systems.
27SECURITIES DIVISION
Disclaimer
Not a Valuation: Values herein are not customer valuations and should not be used in lieu of a customer valuation statement or account statement. These values may not reflect the value of
the positions carried on the books and records of Goldman Sachs or its affiliates and should not be relied upon for the maintenance of your books and records or for any tax, accounting, legal
or other purposes. The information provided herein does not supersede any customer statements, confirmations or other similar notifications.
Indicative Terms/Pricing Levels: This material may contain indicative terms only, including but not limited to pricing levels. There is no representation that any transaction can or could have
been effected at such terms or prices. Proposed terms and conditions are for discussion purposes only. Finalized terms and conditions are subject to further discussion and negotiation.
Backtesting, Simulated Results, Sensitivity/Scenario Analysis or Spreadsheet Calculator or Model: There may be data presented herein that is solely for illustrative purposes
and which may include among other things back testing, simulated results and scenario analyses. The information is based upon certain factors, assumptions and historical information that
Goldman Sachs may in its discretion have considered appropriate, however, Goldman Sachs provides no assurance or guarantee that this product will operate or would have operated in the
past in a manner consistent with these assumptions. In the event any of the assumptions used do not prove to be true, results are likely to vary materially from the examples shown
herein. Additionally, the results may not reflect material economic and market factors, such as liquidity, transaction costs and other expenses which could reduce potential return.
OTC Derivatives Risk Disclosures: Terms of the Transaction: To understand clearly the terms and conditions of any OTC derivative transaction you may enter into, you should carefully
review the Master Agreement, including any related schedules, credit support documents, addenda and exhibits. You should not enter into OTC derivative transactions unless you understand
the terms of the transaction you are entering into as well as the nature and extent of your risk exposure. You should also be satisfied that the OTC derivative transaction is appropriate for you
in light of your circumstances and financial condition. You may be requested to post margin or collateral to support written OTC derivatives at levels consistent with the internal policies of
Goldman Sachs.
Liquidity Risk: There is no public market for OTC derivative transactions and, therefore, it may be difficult or impossible to liquidate an existing position on favorable terms.
Transfer Restrictions: OTC derivative transactions entered into with one or more affiliates of The Goldman Sachs Group, Inc. (Goldman Sachs) cannot be assigned or otherwise transferred
without its prior written consent and, therefore, it may be impossible for you to transfer any OTC derivative transaction to a third party.
Conflict of Interests: Goldman Sachs may from time to time be an active participant on both sides of the market for the underlying securities, commodities, futures, options or any other
derivative or instrument identical or related to those mentioned herein (together, "the Product"). Goldman Sachs at any time may have long or short positions in, or buy and sell Products (on a
principal basis or otherwise) identical or related to those mentioned herein. Goldman Sachs hedging and trading activities may affect the value of the Products.
Counterparty Credit Risk: Because Goldman Sachs, may be obligated to make substantial payments to you as a condition of an OTC derivative transaction, you must evaluate the credit risk
of doing business with Goldman Sachs or its affiliates.
28SECURITIES DIVISION
Disclaimer
Pricing and Valuation: The price of each OTC derivative transaction is individually negotiated between Goldman Sachs and each counterparty and Goldman Sachs does not represent or
warrant that the prices for which it offers OTC derivative transactions are the best prices available, possibly making it difficult for you to establish what is a fair price for a particular OTC
derivative transaction; The value or quoted price of the Product at any time, however, will reflect many factors and cannot be predicted. If Goldman Sachs makes a market in the offered
Product, the price quoted by Goldman Sachs would reflect any changes in market conditions and other relevant factors, and the quoted price (and the value of the Product that Goldman
Sachs will use for account statements or otherwise) could be higher or lower than the original price, and may be higher or lower than the value of the Product as determined by reference to
pricing models used by Goldman Sachs. If at any time a third party dealer quotes a price to purchase the Product or otherwise values the Product, that price may be significantly different
(higher or lower) than any price quoted by Goldman Sachs. Furthermore, if you sell the Product, you will likely be charged a commission for secondary market transactions, or the price will
likely reflect a dealer discount. Goldman Sachs may conduct market making activities in the Product. To the extent Goldman Sachs makes a market, any price quoted for the OTC derivative
transactions, Goldman Sachs may differ significantly from (i) their value determined by reference to Goldman Sachs pricing models and (ii) any price quoted by a third party. The market price
of the OTC derivative transaction may be influenced by many unpredictable factors, including economic conditions, the creditworthiness of Goldman Sachs, the value of any underlyers, and
certain actions taken by Goldman Sachs.
Market Making, Investing and Lending: Goldman Sachs engages in market making, investing and lending businesses for its own account and the accounts of its affiliates in the same or
similar instruments underlying OTC derivative transactions (including such trading as Goldman Sachs deems appropriate in its sole discretion to hedge its market risk in any OTC derivative
transaction whether between Goldman Sachs and you or with third parties) and such trading may affect the value of an OTC derivative transaction.
Early Termination Payments: The provisions of an OTC Derivative Transaction may allow for early termination and, in such cases, either you or Goldman Sachs may be required to make a
potentially significant termination payment depending upon whether the OTC Derivative Transaction is in-the-money to Goldman Sachs or you at the time of termination.
Indexes: Goldman Sachs does not warrant, and takes no responsibility for, the structure, method of computation or publication of any currency exchange rates, interest rates, indexes of such
rates, or credit, equity or other indexes, unless Goldman Sachs specifically advises you otherwise.
All data references to Goldman Sachs Investment Research good as of 8th June 2018.
© 2018 Goldman Sachs. All rights reserved
29You can also read