Data Analysis of the T Tauri Star V1331 Cyg - Joshua Torres, Richard Olenick Ph.D, University of Dallas
←
→
Page content transcription
If your browser does not render page correctly, please read the page content below
Data Analysis of the T Tauri Star V1331 Cyg

         Joshua Torres, Richard Olenick Ph.D,

                     University of Dallas

Submitted in partial fulfillment of the Bachelor of Science degree at

                      the University of Dallas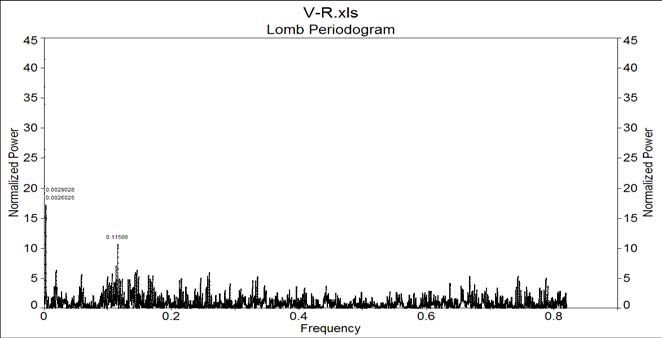
Abstract
       Light curves of V1331 Cyg provided by S.Yu. Melnikov are analyzed by

powerful period hunting, signal analysis software. V1331 Cyg is found to exhibit a

period variability of P ≅ 8.7668 days according to analysis of V, B-V, V-R and U-B light

curves. This, along with high resolution imaging of disks and jet outflows by Hojaev et.

al. and McMuldroch et. al., combine in the conclusion that V1331 Cyg is experiencing

uneven surface accretion that is rotated in and out of view at a period of 8.7668 days.

Background Theory
A. The Interstellar Medium
       Stars are born out of massive clouds of gas that float between the stars, known as

the interstellar medium (ISM). These clouds can contain matter that coalesced directly

out of the big bang, and/or they can contain matter that has been processed and expelled

back into the ISM through stellar wind and explosive events like supernovae. This

material, the remnants of old stars long gone and pure matter from the beginning of the

universe is the mixture that forms stars.

       About 70% of the material that exist between the stars is composed of three states

of hydrogen gas, the most dominant stellar fuel. These three states are neutral hydrogen,

ionized hydrogen, and molecular hydrogen in varying mixtures depending on pressure

and temperature in their environment.

       The element that makes up most of the remaining matter in the ISM, not

surprisingly due to its simplicity, is helium in varying states; molecular, atomic and

                                             2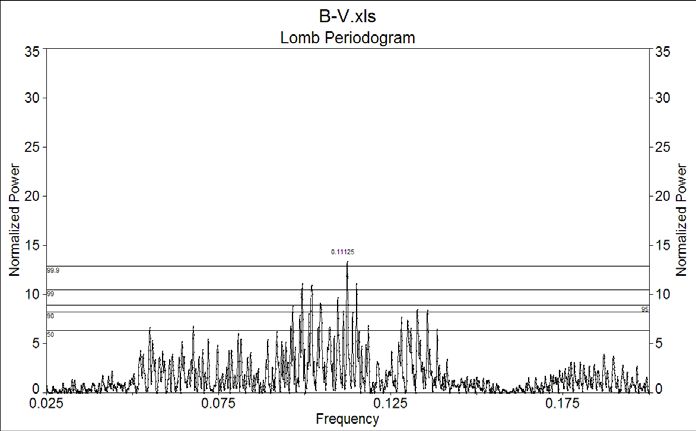
ionized. Hydrogen and helium are thought to be the only elements to have been formed

directly out off the big bang, the rest being produced in stellar nuclear reactions.

        Besides hydrogen and helium ISM contains a mixture of many other particles.

Graphite, a stable form of carbon is seen by its characteristic emission and absorption of

2175 angstrom light. Two other materials that exist in abundance are the molecules Si-O

and Si-O-Si. Light of 9.7 and 18.0 micrometers interacts with these molecules bending

and stretching the Si-O bonds in these molecules revealing their existence. Molecular Si

itself is often found as well.

        Polycyclic aromatic hydrocarbons (PAHs) are often found in the ISM. These are

thought to be in planer benzene ring like structures that exhibit vibrations between the C-

H and H-H bonds.

        All together the composition of ISM tends to be 70% hydrogen, about 28%

helium, with metals, such Si and C making up the last 2% of the potential in the universe.

        Ultraviolet light can break apart molecular hydrogen, dissolving the H-H bond.

Because of this, large molecular clouds can optically shield their interiors, resulting in a

molecular hydrogen center surrounded by atomic hydrogen. Also, it is thought that the

dust grains (and also PAHs) can provide a site when hydrogen molecules can meet and

bond. These sights provide an energy sink that can also absorb a photon that would

otherwise break the H-H bond in molecular hydrogen.

        Because of these processes clouds of ISM are thought to be large clouds of

molecular hydrogen surrounded by atomic and ionized hydrogen, with rare metals spread

throughout. This size and the distribution of this molecular hydrogen-hydrogen cloud

                                              3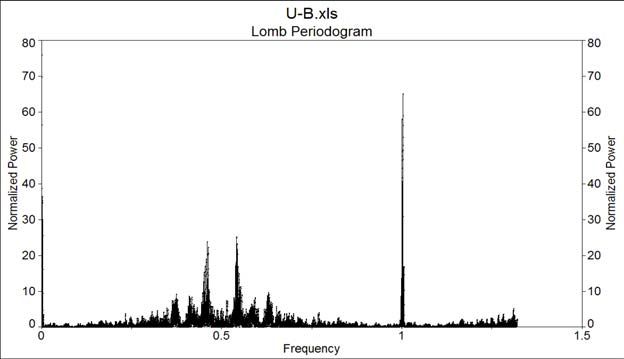
can depend largely on the incident intensity of near by starlight, while also depending on

the cloud density, temperature and rotation.

       Another important characteristic of ISM is that it is thought to contain weak

magnetic fields. This is hypothesized due to the fact that light emitted from ISM tends to

be slightly polarized, meaning that the molecules must be some how preferentially align

them together. One way to do this is to align them along a weak magnetic field. Also, a

week magnetic in the ISM field helps explain some star formation processes, yet to be

discussed.

B. Collapse of ISM and formation of Protostars
       With the nature of ISM being described the next question seems to be how and

why does this material begin to collapse? Ignoring rotation effects and magnetic fields,

the Viral Theorem describes the state of equilibrium for a stable and gravitationally

bound cloud;

                                 2K + U = 0        (The Viral Theorem)

                                               U = 2K

If the kinetic energy term dominates over the gravitational potential term then the

resultant energy will be positive and the cloud will expand and dissociate. However, if

the gravitational potential energy term dominates over the kinetic then resultant will be

negative and the cloud will contract.

       The total gravitational potential energy of a spherical cloud can be shown to be

approximately

                                               4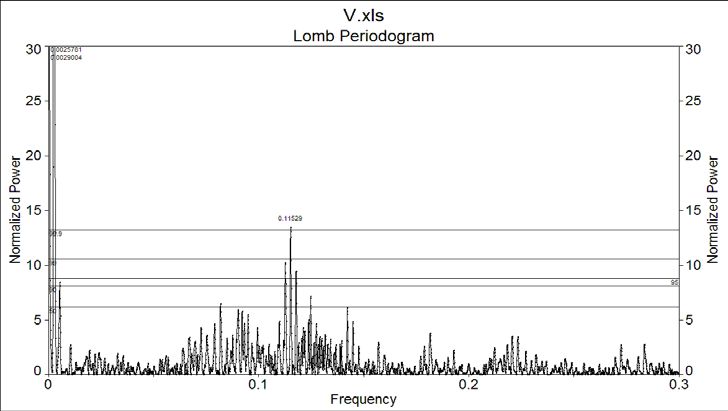
3 GM 2
U ≈−
5 R
(Spherical cloud gravitational potential energy)
where M and R are the mass and radius of the cloud. The total kinetic energy of the cloud
can be estimated as:
3
K= NkT (Kinetic energy of the cloud)
2
Where N is the total number of particles, T is the temperature and k is the Stefan-
Boltzmann constant. However, N is exactly:
M
N= (Total number of particles)
µ (mhydrogen )
where µ is the mean molecular weight and mhydrogen is the mass of atomic hydrogen.
Now using the viral theorem and the conditions for collapse ( 2 K < U ),
3MkT 3 GM 2
< (Conditions for collapse of ISM)
µ (mhydrogen ) 5 R
the radius of the cloud can be written as
1
3M 3
R = (Radius of the cloud)
4πρ
where ρ , the cloud density is assumed to be constant throughout. Substituting in the
Radius of the cloud and solving for the mass we get the value of cloud mass for collapse:
5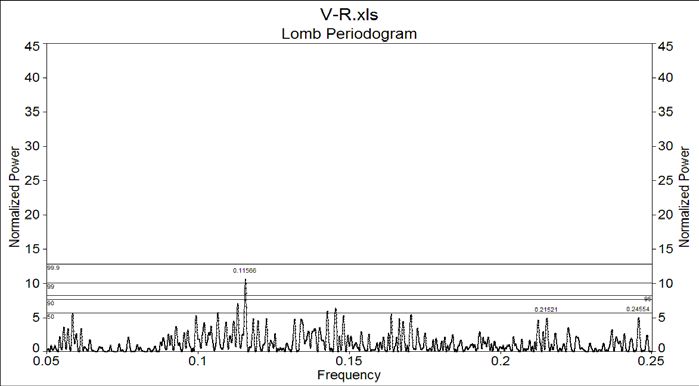
3 1
5kT 2
3 2
M ≅ (Approximate mass value of collapse)
Gµ (m ) 4πρ
hydrogen
This value is called the Jeans Mass. Substituting the mass for the radius we get the
condition of cloud radius for collapse:
1
15kT 2
R≅ (Approximate radius value of collapse)
4πµGρ (m )
hydrogen
This value is known as the Jeans Radius.
The exact starting cause of cloud collapse is not well known. A massive cloud
can have a somewhat spherical, dense inner core of molecular hydrogen due to pressure
and light shielding from an outer shell of atomic and ionized hydrogen. The collapse of
this core then is far more likely then the collapse of the entire cloud. The more massive
the cloud, the more likely the core will reach the Jeans Mass or Radius due to its density.
This coupled with shockwaves from supernovae or proximity to a star system, which
resulting in gravitational effects, solar radiation or solar wind, can lead to high density
and cloud collapse.
After a section of a cloud begins to collapse the material can be mostly considered
to be in isothermal (constant temperature) free fall with respect to its center of mass. The
pre-stellar material exists in this state until collapse is slowed by pressure gradients and
optical opacity. Both these effects are due to the increasing density of the cloud. This
high density causes collision of particles or pressure, and collection of outwardly radiated
light due to the loss of gravitational energy. These two effects tend heat the cloud and
6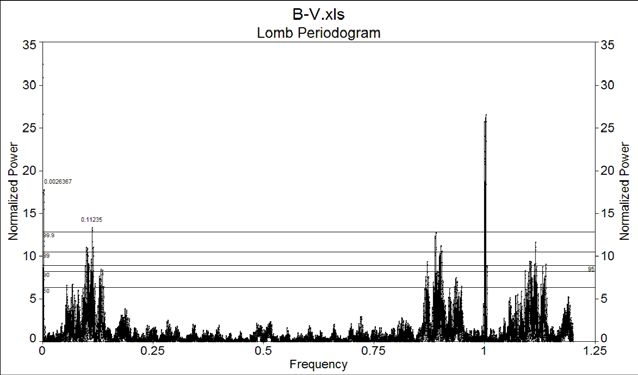
slow down collapse, which would be much faster if all the material was in free fall all the
way to its center of mass.
Ignoring the effects of pressure gradients and optical opacity, the time of free fall
for a cloud of ISM is approximately:
1
3π 1 2
t = (Time of free fall)
32 Gρ
Tanking into account density changes using the Ideal Gas Law:
PV = nRT (Ideal Gas Law)
where P is pressure, V is volume, T is temperature, n is the number of particles and R the
Rydberg constant. As well as the fact that density is mass per volume (M/V), the time of
free fall is:
3π nRT
t ≅ (Time of free fall)
32 GPM
where P is pressure, T is temperature; n is the number of particles, R the Rydberg
constant, G the gravitational constant, and M the mass of the collapsing cloud of ISM.
This equation shows how increasing pressure and temperature prolong initial cloud
collapse.
As the core of a massive cloud collapses, slight inhomogeneities in the initial
shape lead to large differences in pressure and temperature at different sites in the cloud.
This causes the cloud to fragment into many sites of contraction with different times of
free fall. This is why stars are frequently born in clusters.
The effects of rotation and magnetic fields on cloud collapse are major but not
vary well known. Rotation tends to slow down cloud collapse and to cause the formation
of rotating star clusters, rotating stars, and accretion disks. Magnetic fields can cause
7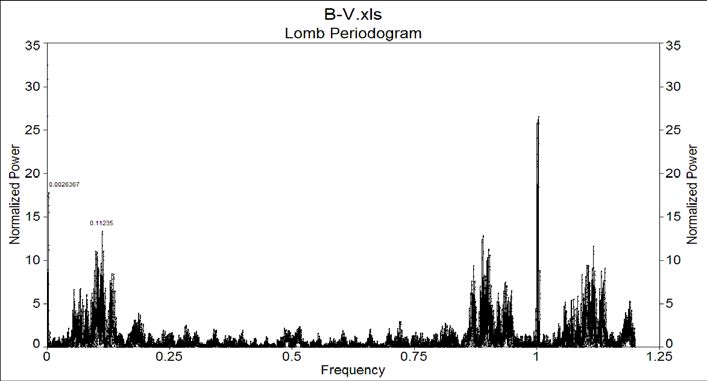
slight inhomogeneities in the initial cloud, which magnify during collapse, or acceleration

of charged particles along the magnetic field lines.        Also neglected were radiation

transport in the increasingly opaque cloud, vaporization of dust grains, and dissociation

of molecules and ionization of atoms. All these processes would tend to increase the time

of cloud collapse and complicate any quantitative analysis of the collapse.

       When the pressure becomes great enough the collapse of the core becomes

adiabatic (the temperature increases or the process is non-isothermal) and collapse is

resisted. This causes the formation of a slowly collapsing core of about 5AU (1AU is

equal to the distance of the earth to the sun). This stable central core is what is called a

protostar, and it contains much of what will be the final stellar material.

       The material out side of this protostar is still in free fall inwards towards the

center. This in falling material speeds up with respect to the static core. When the

material reaches the protostellar surface it is moving faster the local speed of sound and

the material becomes supersonic. The equation for the speed of sound in a medium is:

                               Vs = γRT (Local speed of sound)

In this equation T is temperature, R Rydberg the constant and γ the ratio of specific heats

in the material. The large change in the ratio of specific heats at the boundary of the

protostar causes the lowering of the speed of sound. Because of this the inward falling

material is made to be supersonic and shockwaves are emitted. These shockwaves cause

the in falling material to lose most of its kinetic energy to heat and light, this process is

the cause of most protostellar light.

       As the core slowly contracts and material falls inward the temperature of the

protostar rises. When the temperature reaches about 1000 K dust particles begin to

                                              8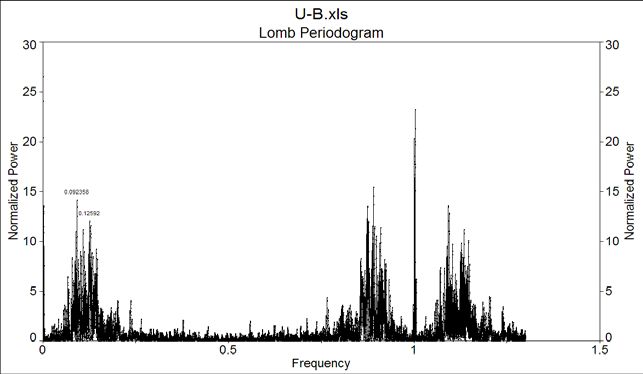
vaporize and opacity decreases. This allows a rapid release of light energy and causes a

second collapse of the protostellar core. At this stage the core material returns to quasi-

free fall again (isothermal contraction), at a rate faster then surrounding material.

       This happens until again pressure gradients and optical opacity become large

enough to once again stop free fall and hydrostatic equilibrium forms a smaller

protostellar core. Once again gravitational energy is converted into heat and the core is

heated due to its slow loss of gravitational energy (adiabatic contraction). Now again the

surrounding material falls inward faster then the protostellar core and large pockets of

this material once again crash into the protostar causing kinetic energy to be turned into

light and heat.

       Again the temperature of the cloud begins to rise. When the protostar reaches

around 2000 K gravitational energy from the star is used to break apart molecular

hydrogen bonds. This consumption of gravitational energy allows the star to again

collapse and approach free fall. The protostar contracts until all the molecular hydrogen

is dissociated and pressure and radiation are allowed to halt the collapse. At this point

the protostar is about 30% larger then its final main sequence value and it is at this time

and most of the protostellar processes are completed and in a short time nuclear reactions

will begin.

                                              9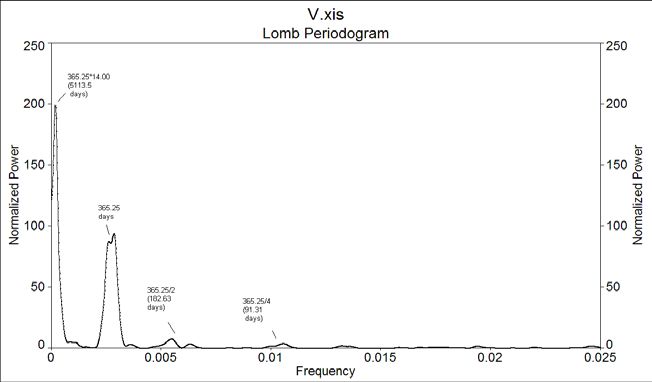
C. The T Tauri Stage - Pre-Main Sequence Evolution
       The outer layers of the contracting star now start to be dominated by the

negatively charged H- ion. This is due to the partial ionization of electron rich metals in

the star, which contribute electrons for hydrogen to absorb. This H- dominance raises the

opacity of the outer layers causing convection in the young star. This convection is

necessary for the release of large amounts of gravitational energy that can no longer be

radiated away due to the increased opacity. If the star did not become convective then

further collapse would be resisted and any further stellar evolution would be unattainable.

       As energy is transported to the surface through convection and expelled from the

star in the form of photons and high-energy solar wind (charged particles) the young star

continues collapsing. During this time the first nuclear reactions begin with deuterium

burning:

       (Deuterium burning)

       This reaction is the beginning of helium and energy production through fusion of

hydrogen nuclei. However, deuterium is in short supply at this time in the young star so

this process has only a slight effect on the stellar evolution.

       As the temperature continues to rise ionization in the core now raises the opacity

in that region. As this happens a radiative core develops and begins to engulf more and

more of the stars mass. This radiative core transports energy to the shrinking outer

convective zone, which in turn releases the energy into space. This more complex system

                                              10
of energy transportation allows the star to contract more, increase its luminosity and build
up temperature.
At about this time full out nuclear reactions can begin. The three steps of what is
called the PP I chain are the premier, and incredible, source of nuclear energy:
(The PP I chain)
The PP I Chain converts hydrogen into helium, high-energy gamma rays, electrons and
electron neutrinos. The number of solar reactions can be estimated by detection of solar
neutrinos on earth. Billions of these particles pass harmlessly through our bodies each
day. All of these neutrinos were produced in the sun.
Other nuclear reactions involve the conversion of carbon into nitrogen in the
highly temperature dependent CNO reactions:
(The CNO Process)
This process (which involves more then one step) converts carbon 12 into nitrogen 14
while producing five high-energy gamma rays, a significant amount of radiative energy.
Other processes occur with lesser frequency, all of the converting light elements into
heavier ones.
11Due to the PP I chain and CNO reactions nuclear energy has become so intense
that convection begins again in the core. This convection, however, is not adequate
enough in its release of energy and the star is forced to expand for the first time. This
expansion converts temperature energy into gravitational potential according to the viral
theorem. This expansion results in a slow luminosity drop down toward its main
sequence value.
When carbon 12 is exhausted the star reaches high enough pressure and
temperature to begin the development of the whole PP I chain and this dominates the
solar energy production. Gravitational energy, the cause of protostellar formation, is now
becoming insignificant, and the star is beginning to settle down onto the main sequence.
The T Tauri stage is slowly ending.
D. Disk Accretion and Jet Outflows
So far rotation and magnetic effects have been ignored in the protostellar and T
Tauri stages. These two effects have powerful applications to the formation of stars.
Rotation Effects
It any initial rotation in the ISM will be magnified several hundred times in the
collapse of a solar envelope due to the conservation of angular momentum. Because of
this magnification of the initial rotation and the fact that any angular momentum transfer
must be relatively inefficient during rapid collapse, the accretion tends to collapse into a
disk perpendicular (in the midplane) to the rotation axis.
The collapsing material loses kinetic energy to thermal temperature due to its own
viscosity and density, but still maintains its initial angular momentum. This material then
12collapses from an angle θ down to the rotating disk. If material with a specific angular
momentum h falls into orbit around a central object of mass M, then the radius of orbit is:
h2
R= (Radius of orbit)
GM
If the cloud core is rotating with angular momentum ω , then material with radius
R from the core and angle θ above the midplane has specific angular momentum:
h = ωr 2 sin θ (Material angular momentum)
Material with low angular momentum (small r and small θ ) will collapse in closer
to the forming star while material with high angular momentum will fall further out in the
disk. Material with a maximum angle θ = π /2 will fall to a maximum disk radius of:
r 4ω 4
rMax = (Maximum disk radius)
GM
This approximates the radius of the accreting disk.
Magnetic Field Effects
It was first hypothesized by Lynden-Bell and Pringle (1974) that material accreted
onto stellar surfaces in the form of massive, rotating, luminous disks. Their theory,
however, included the final accretion of the disk onto the star through a hot narrow
boundary layer around the surface star beneath the star. This portion of their theory has
sense been argued against. Observations of the abnormally large magnetic fields of
young Tauri stars as well as the recent mapping of periodic light variation of hot
continuum emission on the surface of the star have lead to the conclusion that matter
follows strong magnetic field lines down to the surface of the star.
This process is not quantitatively well known and the actual mechanics of the
process are hazy, but the basic principal is the temperature ionized material falls inward
13along the rotating disk into strengthening magnetic fields from the parent star. When the
field becomes strong enough the material is pulled of the disk and cascades along the
magnetic field lines down huge columns of matter to the surface of the star above and
below the midplane. This is an amazing process due to its own self propagating nature;
accreting matter forms magnetic fields in a stellar core, which then forces following
material to accrete in the more efficient manner of magneto-hydrodynamic accretion,
which in turn causes more accretion.
Supersonic Jet Outflows
Material approaches the central core at nearly free fall, picking up velocity as it
cascades down the magnetic field lines. By the time the material reaches the stellar
surface it is traveling much faster the local speed of sound. This results in a supersonic
boom at the surface of the star at the points of magnetic accretion. This focusing of sonic
booms causes the ejection of matter between the accretion points along the rotation axis
and out along the corresponding magnetic field lines. These jets exhibit speeds of about
100-300 km/sec and extend to about 100-1000 AU from the stellar surface. This process
results in clearing of the ISM along the rotation axis and in astounding astronomical
pictures. This process, powered by magnetic and rotational accretion, allows for the
ejection of energy that would otherwise slow the accretion process down, ejecting about
one tenth of the total accreting matter in the process.
14Data and Analysis Tools
The data used in this paper was graciously made available by S. Yu. Mel’nikov
from The Ulugh Beg Astronomical Institute in Tashkent, Uzbekistan. Data was collected
in the U, V, B and R wavelengths. The period of observation ranges from Julian Date
2446612 to 2449994 for a total observing period of 3381.83 days. Data was mostly taken
on successive nights with a mean break of 1.0127 days. The Nyquist frequencies for this
collection of data are 0.00029569 c/d and 0.98814 c/d, frequencies outside these limits
cannot be extracted from analysis of the data.
Data was analyzed using the signal analysis and filtering program Autosignal 1.6.
This program was used for spectral analysis of Mel’nikov’s unevenly sampled data and
removal of alias frequencies.
A. Locating and Eliminating Alias Frequencies
Spectral analysis of a photometric data signal collected using normal astronomical
imaging techniques inherently results in alias frequencies that obscure any true signal in
the data. Hayley Richman (1991) accurately singled out several alias signals in the well-
sampled light curves of cataclysmic variable stars. Richman showed that all light curves
contained both alias frequencies due to data sampling and terrestrial periods.
The data sampling of a light curve at a rate once per day, which is demanded by
day light, leads to a strong alias frequency of 1 c/d in the spectrum of the curve. This is
often the strongest period found in a light curve and can be seen in the spectra of V1331
Cyg.
15This signal is difficult to remove due to its power and low frequency, and can also
cause sister peaks due to spectral leakage of its high power. However, due to its
proximity to our Nyquist frequency, which cut off our knowledge of periods in the data,
this alias signal has little effect in analyzing this light curve of V1331 Cyg.
Three terrestrial alias frequencies can be found in long-term light curves. Both
the lunar synodic and sidereal periods of 29.550 days and 27.319 days can both be found
in long term light curves, as is shown in this power spectrum of V1331 Cyg, as well as
spectral leakage into frequencies at n ×ν .
16This signal is from the addition of bright lunar to the image of the star, which varies at
the sidereal and synoptic periods.
Also found in the light curves of variable stars is a period of 365.25 days, the
earth’s rotation period. This period is due to changes in the viewing time of observations.
While sampling a stars magnitude over long periods the star will rise in the morning at
one time of the year and in the evening. This difference in ambient light adds a signal to
the light curve. A strong spike of one year can be seen in V1331 Cyg’s light curve, along
with spectral leakage from the strong peak.
Discovery of any true signals in the light curve of V1331 Cyg depend on the
uncovering and removal of these alias frequencies form the power spectrum.
17B. Periods Found in The Light Curve of V1331 Cyg
After removal of the synodic, sidereal and yearly periods from the power spectrum of
V1331 Cyg, the periods could be extracted from the light curve.
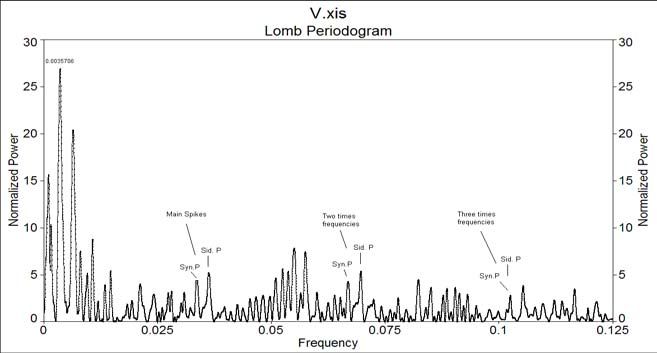
In visual light curve;
Close up of frequency 0.11529 peak with certainty levels;
18After removal of alias signals a frequency of 0.11529 c/d, or 8.6738 days, exists with
99.9% certainty in the resulting power spectrum.
In the B-V light curve;
A close up of 0.11125 frequency peak with certainty levels;
19A frequency of 0.11125 c/d, or 8.9888 days, exists with 99.9% certainty in the resulting
power
In the V-R light curve;
A close up of the 0.11566 frequency peak;
A frequency of 0.11566 c/d, or 8.6460 days, exists with 99% certainty in the resulting
power spectrum. Averaging the three peaks results in a 0.11406 c/d (8.7668 day) signal.
20In the U-B light curve;
This power spectrum has two strong peaks around the 0.11406 frequency peak that was
found in the other light curves. This, however, is most probably due to strong spectral
leakage into neighboring frequencies, as is apparent in the twin peaks around the 1c/d
windowing peak. Also, upon removal of the 0.11406 frequency signal from the U-B
power spectrum results in a new spectrum, as shown below:
21The dual peaks around 0.50000 c/d, or 2.0000 days, represent the day sampling alias
frequency divided by two. The power spectrum now contains no strong peaks except for
the day alias peak and its mirror component peaks. Therefore, the original U-B power
spectrum contains an approximate period around the 8.7668-day period found in the other
data, but most likely contains large amounts of noise, which partially buries the signal.
Causes of Light Variation in V1331 Cyg
High-resolution aperture synthesis maps of the emission of CO from V1331 Cyg
by McMuldroch et. al. (1993) revealed strong evidence for a massive circumstellar disk
of M disk ≈ 0.5M sun and a gaseous envelope of dimension 6000 by 4000 AU
and M env. ≈ 0.32 M sun . They also traced bipolar outflows of M outflow ≈ 0.07 M sun and
v ≈ 22km / s expanding out from the star. The presence of this massive circumstellar disk
and bipolar jet outflow structure suggests magneto hydrodynamic accretion as discussed
above. Also, high resolution imaging of the V1331 Cyg performed by A.S. Hojaev et. al.
(1997) strengthened the evidence for bipolar outflows from V1331 Cyg into the
surrounding medium.
S. Yu. Mel’nikov stated that the angle of inclination of the rotation axis of V1331
Cyg, and the bipolar outflows, to the line of sight of a terrestrial observer was about 60 o .
This was concluded due to the fact that V1331 Cyg did not exhibit Angol-like dips in its
light curve. The star then showed only irregular, or stochastic, variation of about 0.1-0.2
magnitudes from its fully one exposed accreting surface. However, the existence of a
strong 8.7668 period averaged from three different light curves suggests that some
periodic occultation of a stable accretion mechanism is occurring. There are two obvious
22causes for this periodic occultation. Rotation of the stellar surface could be rotating
unevenly distributed accretion points into and out of view. Opposed to that, an uneven
circumstellar disk could be blocking even surface accretion as it rotates around the star.
This latter option of periodicity seems unlikely. First of all, Hojaev and McMuldroch et.
al. both obtained clear high resolution of the unobstructed jet outflows. Also, if an
uneven disk were responsible for the obstruction of accretion luminosity then there would
be some sign of a second period due to the slight difference between disk rotation and
stellar rotation due to magnetic field interaction. This is not the case according to power
spectrums of V1331 Cyg’s light curve. So between the two choices, uneven, steady
surface accretion of some type on the stellar surface is the most likely.
Conclusions
V1331 Cyg is a T Tauri star that is accreting matter through a large circumstellar
disk. This matter most likely follow large magnetic field lines to the surface of the star
causing uneven steady accretion on the surface of the star. This uneven accretion is
brought around by stellar rotation into and out of view of terrestrial observers at a period
of about 8.7668 days who view the axis of rotation at an angle of about 60 o.
23References
1. S. Yu. Mel’nikov, The Dependence of the Characteristics of the Brightness
Variability of Herbig Ae/Be stars on the Orientation of Their Star-Disk Systems,
Ulugh Beg Astro. Inst. (1991).
2. E. A. Kolotilov, Photoelectric U, B, V photometry of the peculiar T Tauri star
V1331 Cygni, Shternberg Astro. Inst. (1983).
3. A.S.Hojaev, Imaging of the unusual T Tauri Star V1331 Cyg with sourrounding
nebula in the frame of the YSONJOR program, High Altitude Maydanak
Observatory Astro. Inst. (1997).
4. Stuart McMuldroch et. al., The Circumstellar Envrioment of the FU Orionis Pre-
Outburst Candidate V1331 Cygni, California Inst. Of Technology (1993).
5. Hayley R. Richmam, Period Hunting in the Long-Term Light Curves of
Cataclysmic Variables, Astro. Dept. Columbia University (AAVSO) (1991).
6. Gerry A. Good, Observing Variable Stars, copyright Springer-Verlag London
Limited, 2003.
7. Bradley W. Carrol and Dale A. Ostlie, Modern Astrophysics, copyright Addison-
Wesley Publishing Co. (1996).
8. Lee Hartman, Accretion Processes in Star Formation, copyright Cambridge
University Press (1998).
24You can also read