ANGLO AMERICAN PLATINUM - 2018 INTERIM RESULTS PRESENTATION 23 July 2018
←
→
Page content transcription
If your browser does not render page correctly, please read the page content below
ANGLO AMERICAN PLATINUM
 2018 INTERIM RESULTS PRESENTATION
 23 July 2018

Mogalakwena mine
CAUTIONARY STATEMENT
Disclaimer: This presentation has been prepared by Anglo American Platinum Limited (“Anglo American Platinum”) and comprises the written materials/slides for a presentation concerning Anglo
American Platinum. By attending this presentation and/or reviewing the slides you agree to be bound by the following conditions.
This presentation is for information purposes only and does not constitute an offer to sell or the solicitation of an offer to buy shares in Anglo American Platinum. Further, it does not constitute a
recommendation by Anglo American Platinum or any other party to sell or buy shares in Anglo American Platinum or any other securities. All written or oral forward-looking statements attributable to
Anglo American Platinum or persons acting on their behalf are qualified in their entirety by these cautionary statements.
Forward-Looking Statements
This presentation includes forward-looking statements. All statements, other than statements of historical facts included in this presentation, including, without limitation, those regarding Anglo
American Platinum’s financial position, business, acquisition and divestment strategy, plans and objectives of management for future operations (including development plans and objectives relating
to Anglo American Platinum’s products, production forecasts and reserve and resource positions), are forward-looking statements. By their nature, such forward-looking statements involve known and
unknown risks, uncertainties and other factors which may cause the actual results, performance or achievements of Anglo American Platinum, or industry results, to be materially different from any
future results, performance or achievements expressed or implied by such forward-looking statements.
Such forward-looking statements are based on numerous assumptions regarding Anglo American Platinum’s present and future business strategies and the environment in which
Anglo American Platinum will operate in the future. Important factors that could cause Anglo American Platinum’s actual results, performance or achievements to differ materially from those in the
forward-looking statements include, among others, levels of actual production during any period, levels of global demand and commodity market prices, mineral resource exploration and development
capabilities, recovery rates and other operational capabilities, the availability of mining and processing equipment, the ability to produce and transport products profitably, the impact of foreign
currency exchange rates on market prices and operating costs, the availability of sufficient credit, the effects of inflation, political uncertainty and economic conditions in relevant areas of the world, the
actions of competitors, activities by governmental authorities such as changes in taxation or safety, health, environmental or other types of regulation in the countries where Anglo American Platinum
operates, conflicts over land and resource ownership rights and such other risk factors identified in Anglo American Platinum’s most recent Annual Report. Forward-looking statements should,
therefore, be construed in light of such risk factors and undue reliance should not be placed on forward-looking statements. These forward-looking statements speak only as of the date of this
presentation. Anglo American Platinum expressly disclaims any obligation or undertaking (except as required by applicable law, the Listings Requirements of the securities exchange of the JSE
Limited in South Africa and any other applicable regulations) to release publicly any updates or revisions to any forward-looking statement contained herein to reflect any change in Anglo American
Platinum’s expectations with regard thereto or any change in events, conditions or circumstances on which any such statement is based.
Nothing in this presentation should be interpreted to mean that future earnings per share of Anglo American Platinum will necessarily match or exceed its historical published earnings per share.
Certain statistical and other information about Anglo American Platinum included in this presentation is sourced from publicly available third party sources. As such it presents the views of those third
parties, but may not necessarily correspond to the views held by Anglo American Platinum.
No Investment Advice
This presentation has been prepared without reference to your particular investment objectives, financial situation, taxation position and particular needs. It is important that you view this presentation
in its entirety. If you are in any doubt in relation to these matters, you should consult your stockbroker, bank manager, solicitor, accountant, taxation adviser or other independent financial adviser
(where applicable, as authorised in South Africa, under the Financial Advisory and Intermediary Services Act 37 of 2002).
Alternative performance measures
Throughout this presentation a range of financial and non-financial measures are used to assess our performance, including a number of the financial measures that are not defined under IFRS,
which are termed ‘alternative performance measures’ (APMs). Management uses these measures to monitor Anglo American Platinum’s financial performance alongside IFRS measures because they
help illustrate the underlying financial performance and position of the Anglo American Platinum. These APMs should be considered in addition to, and not as a substitute for, or as superior to,
measures of financial performance, financial position or cash flows reported in accordance with IFRS. APMs are not uniformly defined by all companies, including those in Anglo American Platinum’s
industry. Accordingly, it may not be comparable with similarly titled measures and disclosures by other companies.

Front cover image: Mogalakwena North concentrator
                                                                                                                                                                                                                   2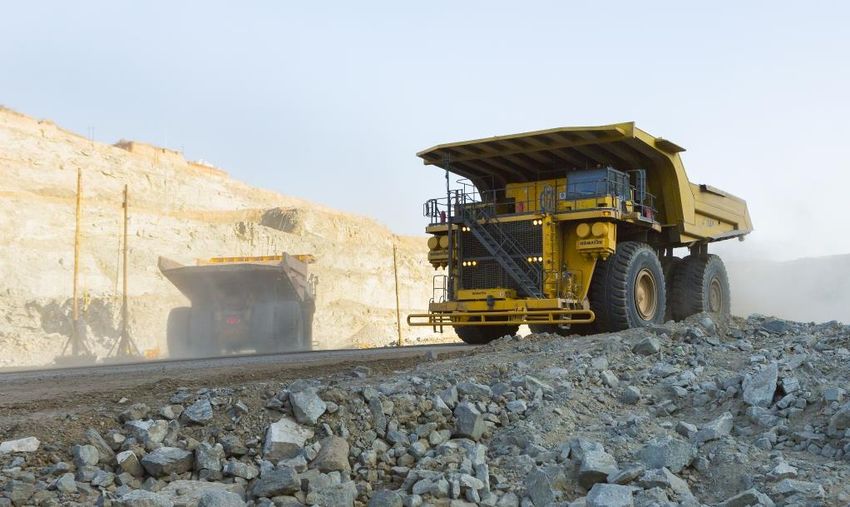
2018 INTERIM RESULTS AGENDA

    1.   Safety & sustainability performance   Chris Griffith

    1.   Operational performance               Chris Griffith

    2.   Financial results                        Ian Botha

    3.P
    G   PGM market review                      Chris Griffith
    M

    3.   Positioning for the future            Chris Griffith
                                                                3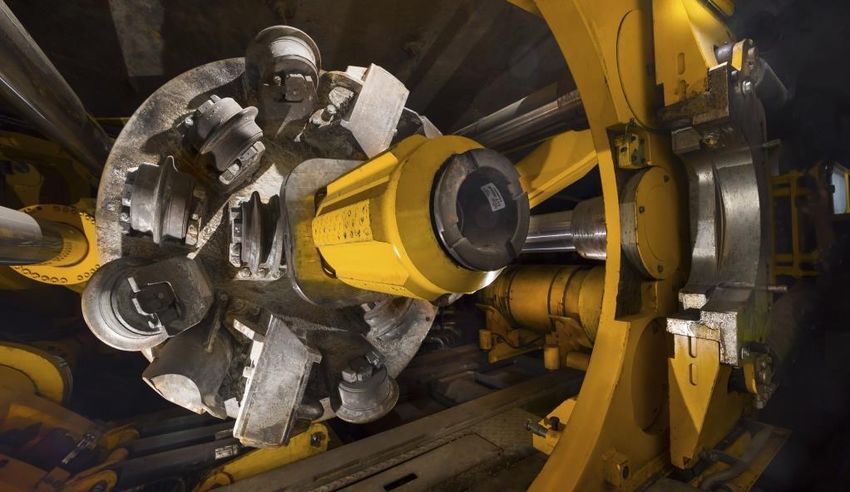
SAFE PRODUCTION DELIVERING VALUE

Strong operational performance
                                     ✓   Increasing margin
                                                                          ✓   Improving return on capital
                                                                                                                 ✓
PGM production increase                  EBITDA margin                        ROCE

4%                                        21%                                  22%
for H1 2018                               up from 15% in H1 2017               up from 9%

Generating cash
                                    ✓    Strong balance sheet
                                                                          ✓   Industry leading returns
                                                                                                                 ✓
Free cash flow from operations(1)        Moved to net cash                    Cash dividend declared

R1.3bn                                    +R0.5bn                              R1.0bn
up from R(1.0)bn in H1 2017, despite      from net debt of R1.8bn at 31        for H1 2018. R0.9bn for H2 2017
temporary inventory build-up of R2.5bn    December 2017

                                                                                                                     4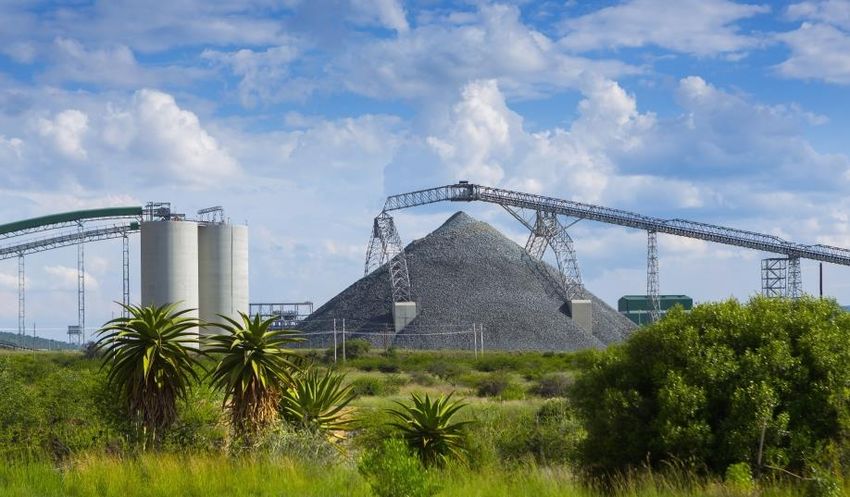
STRONG OPERATING & FINANCIAL RESULTS…& WE’VE BEEN BUSY

Sale of RBP shares                                   ✓   Acquisition of Glencore’s interest in Mototolo
                                                                                                                ✓

R390m                                                    R0.8bn
gross proceeds from placement                            upfront consideration and estimated nominal deferred
                                                         consideration at R1bn, (total NPV R1.5bn) (25)

Disposal of BRPM interest
                                                     ✓   Launch of AP Ventures Fund
                                                                                                                ✓

R1.9bn                                                   $200m
total purchase consideration, with upfront c.R200m       total commitment to the fund equating c.R2.7bn

          …and we’ll talk about what’s next for AAP…                                                                5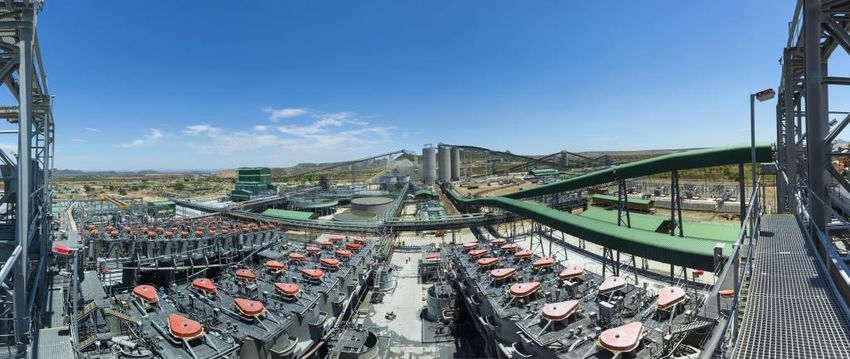
2018 INTERIM RESULTS
SAFETY & SUSTAINABILITY PERFORMANCE
Chris Griffith
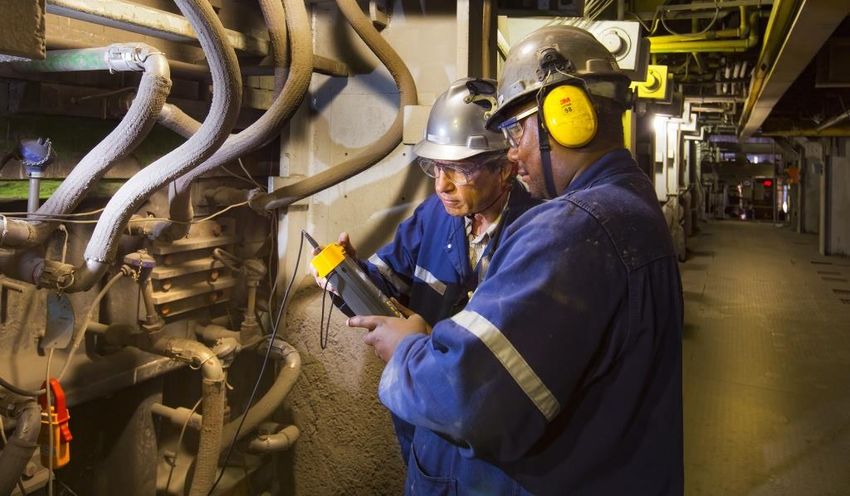
Monitoring readings on the copper coolers on the Polokwane smelter furnace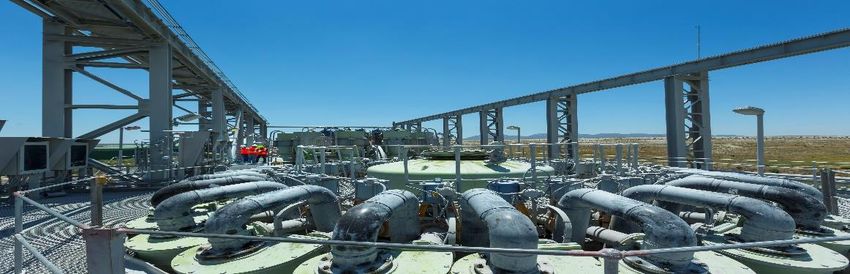
SAFETY INDICATORS MATERIALLY IMPROVED

Fatalities & total recordable case injury frequency rate (TRCFR)(2)      TRCFR improvement

   8.36
TRCFR
                   8.37                                                  42%
                                                                         per 1 million hours worked, but
                                                                         sadly one loss of life through bee
                                                                         stings
                                     5.69
                                                  5.08

                                                                         Safety turnaround in place:
                                                                  2.93

                                                                         • Management commitment to safety
                                                                           and elimination of fatalities

                                    7                                    • Benefits from implementing a
                                                   6                       revised safety, health and
                                                                           environmental strategy
          3
                                                                         • Significant effort and investment in
                     2
                                                                  1        cultural transformation

     2014           2015           2016           2017         H1 2018

                                                                                                                  7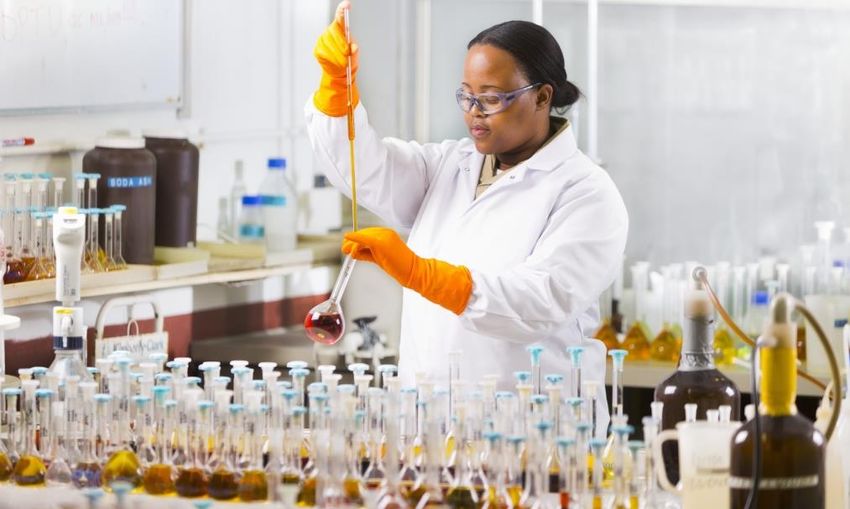
RE-IMAGINING MINING TO IMPROVE PEOPLE’S LIVES
PGMs allow solutions to global problems                                 How we’re doing: ESG(3) performance

  Air quality                    •   Autocatalysis
                                 •   Heat and energy decarbonisation
                                     through renewable hydrogen
                                     production
                                 •   Carbon capture and usage
                                                                        Top 2 mining company globally in ISS
                                                                        Oekom Corporate Responsibility Review
  Integrating the                •   Hydrogen infrastructure            2018
  hydrogen                       •   Fuel cell electric vehicles
  economy with                   •   Distributed power generation
  renewable energy               •   Energy storage

  Improving                      •   Water treatment
  people’s lives                 •   Food preservation                  Top 30 in JSE Responsible Investment
                                 •   Advanced electronics               Index

  Improving                      •   Biomedical applications
  wellness                       •   Dental alloys & applications
                                 •   Healthcare sensors & electronics
                                 •   Cancer treatments
                                                                        Inclusion in FTSE4Good index since June
                                                                        2015
                                                                                                                  8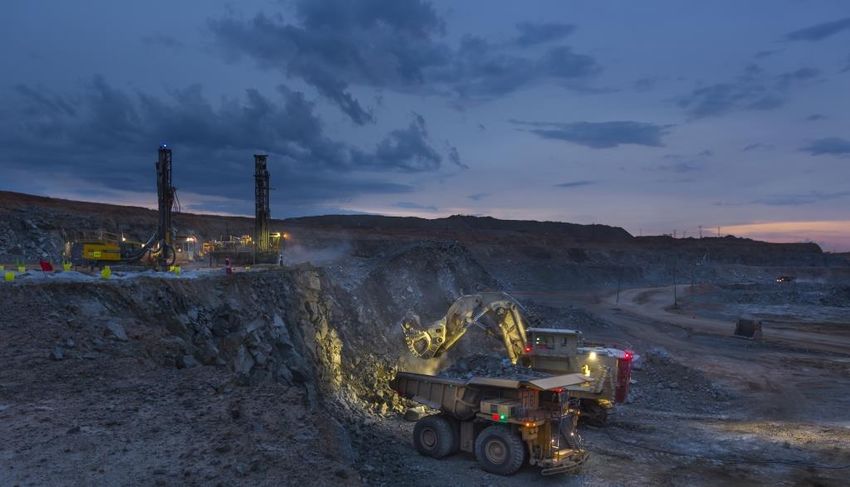
2018 INTERIM RESULTS
OPERATIONAL PERFORMANCE
Chris Griffith

300 tonne haul truck at Mogalakwena
RECORD PRODUCTION FROM MOGALAKWENA

Total PGM Production (‘000 ounces)                                  PGM production increase

         492                      539                         641
                                                                    19%
                                               +19%

                                                              73
                                                                    EBITDA margin
                                   62
          58

                                  251
                                                              295
                                                                    45%
         226

                                                                    Economic free cash flow(5)
                                                              273
         208                      226

                                                                    R2.1bn
       H1 2016                  H1 2017                   H1 2018   at AISC(4) of $253/ platinum ounce
                                                                    sold, despite build up of WIP inventory
                 Platinum   Palladium     Other PGMs & gold
                                                                                                              10
MOGALAKWENA – HIGHLIGHTING UNDERLYING PERFORMANCE
Mining Concentrating Value enhancing
Shovel loading rate (tonnes / hr) Tonnes milled (million) PGM ounces (‘000 ounces)
+34% +35% 721 870 980 1,100 c.1,150
2,322
c.+60%
2,153 6.9
2,066 6.9 126
6.3
5.8 116
1,916 5.0 104
89 509
452
396
1,727 327
6.3 6.7 7.1
5.4 5.9
370 412 464
305
2012 2014 2016 2017 H1 2018 2012 2014 2016 2017 2018 2012 2014 2016 2017 2018E
H1 H2 Pt Pd Other PGMs
Truck utilisation (average hrs / truck) 4E Concentrator recovery % AISC(4)
+19% +8% (82)%
6,529 80%
6,259 6,329
78%
77%
5,835
75% 994
5,489
74%
607
498
340
253
2012 2014 2016 2017 H1 2018 2012 2014 2016 2017 H1 2018 2012 2014 2016 2017 H1 2018 11AMANDELBULT TURN AROUND PROGRESSING
Total PGM Production (‘000 ounces) PGM production increase
409 398 433
9%
as ramp-up of Dishaba UG2 continues
+9%
EBITDA margin
110
99
100
103
17%
96 up from 3%
94
Economic free cash flow(5)
214 204 220
R159m
H1 2016 H1 2017 H1 2018 at AISC(4) of $891/ platinum ounce
sold, despite build up of WIP inventory
Platinum Palladium Other PGMs & gold 12AMANDELBULT – UNLOCKING FULL VALUE & POTENTIAL
Chrome strategy driving value with …reducing AISC to target of …with more value delivery to
steady mining improvement… $820 and generating cash… come through modernisation
Chrome AISC $ / platinum ounce sold(4)
Yield % 1. Develop Dishaba UG2 – utilising
production (kt) 1,072 1,046 1,036 existing Merensky infrastructure
91 145 increasing reserves and replace
403 16%UNKI – STRONG PRODUCTION FROM STRATEGIC ASSET
Total PGM Production (‘000 ounces) Total PGM production increase
79 85 93
9%
+9%
16 EBITDA margin
14
13
33
36
33%
30 26% normalised for sale of treasury
bills(6)
Economic free cash flow(5)
38 41
36
H1 2016 H1 2017 H1 2018
R311m
at AISC(4) of $491/ platinum ounce
sold, despite build up of WIP inventory
Platinum Palladium Other PGMs & gold 14JOINT VENTURES & POC INCREASE MARGINS
Total PGM ounces produced H1 2018 EBITDA margin PGM production increase
1,308 1,395 27%
+7%
Impact of
14%
4% Mototolo ore from JVs and POC (excl. Bokoni)
stockpile
Joint venture and associates
• Mototolo up 26%
1,091 • Modikwa up 6%
1,033 • Kroondal up 6%
POC • BRPM up 6% - in sale process
23%
11% Economic free cash(7) (JVs & POC)
JV 304
275 mined
R216m
H1 2017 H1 2018 JV mined POC at AISC(4) of $924/ platinum ounce
sold, despite build up of WIP inventory
15REFINED PRODUCTION AND SALES WILL BE HIGHER IN H2
PGM - M&C production, refined production, sales volumes & inventory Refined PGM production down
Pt - Increase in WIP Drawdown in refined Pt
160 (40)
5%
Sales volumes up (excl. trading)
Dec 2017 June 2018 Dec 2017 June 2018
3%
supported by draw down of refined
5,182 inventory
2,584 2,177 2,509
4,916
538 Lower refined production due to:
659
416 H1 2018
813 • Mortimer smelter rebuild in Q2 2018
686 733
H2 2018
• Polokwane smelter partial rebuild in
1,233 1,075 1,117 Q3 2018
• Commissioning of Unki smelter and
ACP Phase A in Q3 2018
M&C Refined Sales volumes
production production (excl. trading) Expect to largely refine all metals
produced in 2018 16
Pt Pd Other PGMs & gold2018 INTERIM RESULTS
FINANCIALS
Ian Botha
Mogalakwena mineSTRONG FINANCIALS
Headline earnings per share EBITDA Headline earnings
(R/Share) 12.82
R6.8bn R3.4bn
increase of 70% up 4.5x
12.00
ROCE (%) Net cash
2.85
3.93
Underlying
(8)
22% R0.5bn
Once-off 0.82 up from 9% from net debt of R1.8bn at 2017
accounting year end
(1.08)
entries
H1 2017 H1 2018
…and declared a dividend of R1bn 18DIVERSIFIED PGM DOLLAR PRICES AND COST SAVINGS
DRIVING EARNINGS
EBITDA (R billion) H1 2018 vs. H1 2017
3.6 0.6
Pd 1.8 (1.0) 2.0 6.8
0.2
(0.6) 6.0
Rh 1.0
Stock count
(1.4) movement
Ir & Ru 0.7
4.0 Ni 0.4
Pt (0.3) 108
H1 2017 Price Currency CPI Costs & Associates H1 2018
volume 19INCREASING MINING AND EBITDA MARGINS
H1 2017 H1 2018
15% 21% 34%
27%
23% 4%
22%
21%
15%
11% 11% 23%
(9)
POC JV mined share Own mines POC JV mined share Own mines
20CONTINUED STRONG COST PERFORMANCE
R /Pt oz produced R /PGM oz produced Input cost inflation
3% 3% 4.8%
20,105
(10)
19,571 H1 2017 4.6%
9,265 2018 Guidance
(11)
8,954
R19,600 –
R20,200
per platinum ounce produced
H1 2017 H1 2018 H1 2017 H1 2018
21CONTINUED WORKING CAPITAL REDUCTION, DESPITE
TEMPORARY WIP BUILD-UP
Working capital reduction (R billion) Working capital days
2.5
33 Days
(0.3) 2017 year end 26 Days
3.1 WIP
(1.9)
Measured ore stockpile
6.2
(0.7)
Finished
goods
(1.1)
5.4 R1.8bn
2017 year end R1.8bn
Customer prepayment
R5.7bn
2017 year end R4.6bn
2017 Metal Trade Trade Customer H1 2018
inventory debtors creditors prepayment
22CAPITAL HIGHER IN H1 2018 IN LINE WITH GUIDANCE
(12)
Capital expenditure (Rbn) H1 2018 capital expenditure
4.7 – 5.2
0.6
R1.8bn
0.8 – 1.0
SO2 abatement project
R2.5bn
1.8 for 2018 to 2023 to achieve global best practice
3.3 – 3.6
0.1
1.3 0.4
Capitalised waste stripping
0.2
1.3
1.1
H1 2017 H1 2018 2018 Guidance
R0.6bn
2018 guidance increased from R1.1bn to R1.4bn
SIB Projects SO2 Abatement
23STRONG BALANCE SHEET, DRIVEN BY IMPROVING CASH
GENERATION
Net (debt) / cash (Rbn) Stronger free cash flow (Rbn)
R2.3bn improvement R1.3bn
up from R(1.0)bn in H1 2017
0.5 4.1
1.4 0.3 2.3
1.2 1.1
2.3
1.1 0.9
(1.8)
1.8 1.9 2.1
R1.3bn
FCF
(0.4) (0.6)
(0.8)
R(1.0)bn (0.3)
FCF
(0.9)
(1.9)
(5.9)
H1 2017 2017 H1 2018 H1 2017 H2 2017 H1 2018
Customer prepayment Bokoni/Pandora/BRPM funding
Net debt excluding customer prepayment R5.2bn
Asset sales Working capital
(0.4x net debt / EBITDA) 24
FCF before non-core / working capital DividendDISCIPLINED CAPITAL ALLOCATION
Capital allocation framework Balanced capital allocation
R5.6bn • Free cash flow
Cash flow
Discretionary after
capital sustaining
options capital
• Sustaining capex
(R2.0bn) • Capitalised waste stripping
Balance sheet
flexibility to support • Dividend for H2 2017 paid
(13)
base dividend (R0.9bn) • Dividend for H1 2018 declared of R1bn
(R2.3bn) • Decrease in net debt
Discretionary capital options
Low cost, fast Additional
Future project
payback project shareholder
spend
options
returns (R0.4bn) • Discretionary capital
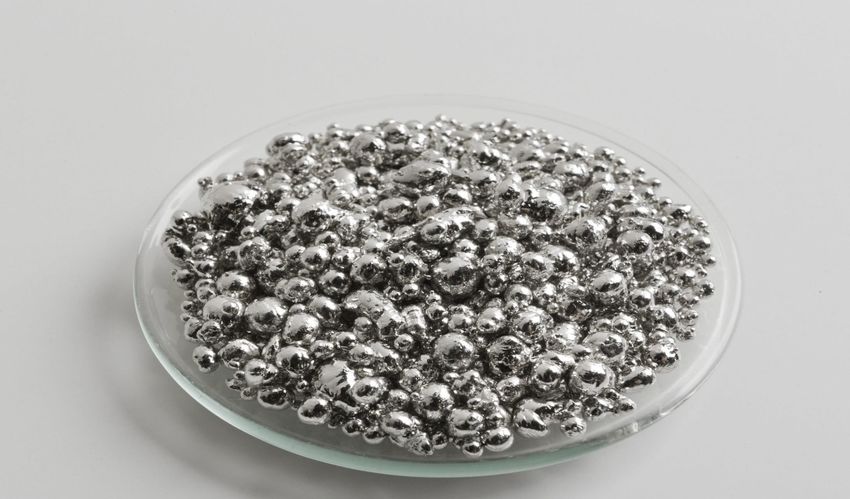
252018 INTERIM RESULTS PGM MARKET REVIEW Chris Griffith Palladium grain
STRONGER BASKET PRICE, SUPPORTED BY PALLADIUM
AND RHODIUM

Indexed price (3 Jan 2017 = 100)(14)                                             USD platinum price decrease
175                                                                        400

                                                                                 3%
                                                                                 achieved prices year-on-year

150                                                                        300

                                                                                 USD basket price increase
125                                                                        200

                                                                                 26%
                                                                                 achieved prices year-on-year

100                                                                        100

                                                                                 Rand basket price increase

 75                                                                        0
 Jan 2017    Apr 2017   Jul 2017   Oct 2017    Jan 2018    Apr 2018
                                                                                 18%
                                                                                 achieved prices year-on-year
        Pt        Pd       USD basket         ZAR basket        Rh (RHS)
                                                                                                                27
OVERALL OUTLOOK FOR 3E DEMAND POSITIVE
Platinum (net demand)(15) Palladium (net demand)(15) Rhodium (net demand)(15)
Industrial Industrial
Jewellery 21% 15%
Industrial
29%
39%
Investment
3%
Autocatalyst
Autocatalyst 85%
Autocatalyst 79%
29%
• Industrial demand strong • Automotive consumption very strong • Automotive purchasing growing
• Jewellery demand steadying • Industrial demand set to weaken • Industrial demand softer in 2018
• Automotive demand under pressure
from diesel headwinds
Medium-term demand outlook Medium-term demand outlook Medium-term demand outlook
stable positive stable
28POSITIONING FOR THE FUTURE Chris Griffith Head of the slot borer machine at Twickenham mine
SIMPLIFYING THE PORTFOLIO TO DELIVER STRONG RETURNS

                                           Mototolo &                    Modikwa JV
Mogalakwena              Amandelbult                         Unki                                Processing
                                          Der Brochen                    Kroondal JV

EBITDA margin                          ROCE                         Production in H1 of cash cost-curve

21%
up from 15% in H1 2017
                                       22%
                                       annualised, up from
                                                                    70%
                                                                    including the exit of BRPM
                                       9% in H1 2017

                                                                                                              30
OUR DIFFERENTIATED VALUE PROPOSITION
Quality assets & Capital discipline &
Long term sustainability
operational excellence shareholder returns
70% production in H1 of the cost Strong balance sheet and Project studies on value-add
curve earnings growth optionality
Only open-pit PGM mine of Focused capital allocation Grow demand for PGMs
scale in the world
Optimising assets & extracting Sustainable cash dividend Modernising mining through
full value innovation
Long-life mineral resource Industry leading cost control Invest in people and
communities
31HOW WE CREATE VALUE – WHAT’S NEXT FOR AAP
Our Strategy Launch of the AP Ventures fund in conjunction with the PIC
• Built a strong track record as part of Anglo American Platinum’s
Develop the market for
PGM Investment Programme
PGMs
• Decision to separate the fund’s activities into an independent VC
fund that will attract additional outside investment and allow AP
Ventures to increase the scale of its activities
• $200 million (c.R2.7 billion) committed by cornerstone investors AAP
Operational Excellence and the PIC
through people & innovation
• The launch of AP Ventures is expected to support the growth of
PGM technologies and increase PGM demand
Investing in our core
portfolio
32HOW WE CREATE VALUE – WHAT’S NEXT FOR AAP
Our Strategy Focus on achieving greater operational excellence
Develop the market for 1 Achieving world benchmark performance
PGMs • Continuous improvement, pushing to, and beyond, world best
benchmarks +31%
+34% Tonnes loaded (mt)
Mogalakwena rope shovel
opportunity - to improve 31% to
get to ‘world benchmark’.
Thereafter objective is to set
benchmark
Operational Excellence
2012 H1 2018 Benchmark
through people & innovation
2 Innovation & Technology
• Mechanisation
- Autonomous truck and drill rigs, ultra-low profile mechanised
mining fleet, rock cutting and continuous haulage systems
• Modernisation of safe conventional stopes
- Electro/ hydraulic drills, emulsion explosives, cable supports,
Investing in our core
stronger netting
portfolio
3 Digitalisation
• Real time equipment monitoring
• Digital twinning (simulation to optimise performance)
• Enhanced data analytics 33HOW WE CREATE VALUE – WHAT’S NEXT FOR AAP
Our Strategy Mogalakwena expansion through a third concentrator
Develop the market for • Conceptual project studies showing third concentrator most value
PGMs accretive expansion option, in conjunction with continued
operational excellence
• Optimal value achieved with a concentrator size of between 9 -12
million tonnes per annum which will not trigger any major
downstream processing capital
Operational Excellence
through people & innovation • Incremental increase in palladium production by c.270,000 ounces
and an increase in platinum production by c.250,000 ounces
Investing in our core
portfolio Mogalakwena
North
concentrator
34HOW WE CREATE VALUE – WHAT’S NEXT FOR AAP
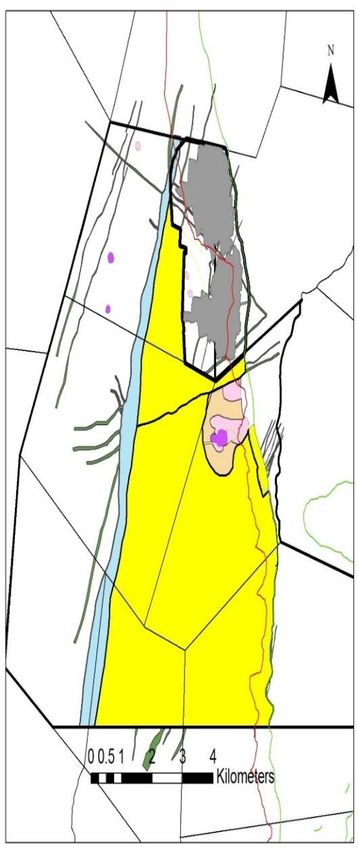
Our Strategy Acquisition of Mototolo and integration with Der Brochen
Develop the market for • AAP to purchase Glencore’s 39% interest in Mototolo JV
PGMs
• A high quality, fully mechanised operation
• Secures significant infrastructure, allowing synergies between
Mototolo and adjacent Der Brochen
• Creates a major PGM hub with both replacement and growth
Operational Excellence optionality, to beyond a 30-year life of mine
through people & innovation
Mototolo Der
JV Brochen
Investing in our core
portfolio 6.4km
5.2km
4km
Triangle
Area
35REVISED 2018 GUIDANCE
• Strong production performance in H1 results in an increase in guidance
- PGM production of 4.85 to 5.10 million ounces (from 4.75 to 5.00 million ounces)
- Platinum production of 2.40 to 2.45 million ounces (from 2.35 – 2.40 million ounces)
- Palladium production remains between 1.5 to 1.6 million ounces
• Refined platinum production and sales volumes in line with production
• Refined PGM production and sales lower than production due to stock count loss –
impacted largely palladium and rhodium
• Unit cost guidance remains – R19,600 to R20,200 per produced platinum ounce
• Capital expenditure guidance – within guided range of R4.7 to R5.2 billion
• Capitalised waste stripping guidance increased to R1.4 billion for 2018
• Base dividend pay-out-ratio of 30% of headline earnings
36TO CONCLUDE…
✓ Overall safety performance improved
✓ Strong operational performance
✓ Industry leading returns to shareholders
✓ Simplification and enhancement of the portfolio for best value
✓ On a pathway to deliver next phase of value
37Q&A Run-of-mine stockpile area at Mogalakwena North concentrator
APPENDIX

Lab processor at PMR
FOCUS REMAINS ON HEALTH, ENVIRONMENT & SOCIAL
     INVESTMENT
     Tuberculosis (TB) deaths and TB incidence rates (per 100,000)                     TB incidence rate reduction

60       1,020
                         987
                                                                                       53%
                                                                                   1,000

50                                               National average (781)               to 271 per 100,000 as at end of May
           51                                                                      800
                                                                                      2018

                                        660                                        600
40                                                  582
                                                                                      Level 3-5 environmental
                                                                                   400incidents(16)
                                                                      271
30

                         27
                                                                                   200 zero
                                                                                       since 2013
                                                                                   -
20

                                                                                   -200
                                        14                                             Social investment in H1 2018
10
                                                                                   -400

0
                                                       4               3
                                                                                   -600
                                                                                       R86m
                                                                                       2% of NOPAT
          2014          2015           2016          2017           H1 2018
            TB Deaths    TB incidence rates   National average TB incidence rate                                            40
NET DEBT AND CASH FLOW BY MINE (BASED ON SOLD VOLUMES)
(2.0)
(0.4)
5.8 (1.4) 0.9 (0.9)
0.5
1.1
(0.8)
(0.6)
(1.8)
R1.3bn
Investment in
Net debt 100% Economic Economic Cash tax and
Cash from SIB and Project associates, Free cash Customer Net proceeds Net cash
Operation December Operating interest free net interest Dividend
operations waste capital capital funding & flow prepayment on asset sales June 2018
2017 free cashflow adjustment cashflow (5) paid
other(17)
Mogalakwena 3,557 (1,449) 2,108 - 2,108 (68) 2,040
Amandelbult 573 (271) 302 (144) 159 (84) (95) 123
Unki 405 (93) 311 - 311 (192) 120
(7)
Joint Ventures 506 (346) 160 - 160 (15) 145
(7)
BRPM (145) (44) (189) 227 38 - (454) (643) 387
(7)
3rd Parties 177 (159) 18 - 18 - 18
Union (1) (11) (12) (5) (17) - (12) 381
Bokoni C&M (0) 0 (0) (50) (50) - (113) (113)
Twickenham C&M (56) - (56) - (56) - (56)
NMT (149) - (149) - (149) - (149)
Other(18) 980 382 1,362 1,362 (0) (1,447) (106) (191) 1,104 85 (928)
41
(1,832) 5,846 (1,991) 3,854 29 3,884 (359) (1,447) (767) 1,281 1,104 853 (928) 477COST BREAKDOWN
Costs reflective of AAP Own mined and Joint Venture share of production and costs at operations. Excludes all purchase of concentrate costs and volume,
overhead and marketing expenses.
2015 Cost base (Rbn) Volum e % PGM volum e (koz) Labour Contractors Materials Utilities Sundries
Opencast Mining 2.4 25% 885 25% 9% 67% 3% -4%
Conventional Mining 14.8 51% 1,781 60% 3% 18% 8% 12%
Mechanised Mining 5.1 24% 830 42% 17% 26% 6% 9%
Concentrating 6.4 15% 4% 34% 22% 25%
Processing 5.3 24% 2% 26% 30% 19%
Total 34.0 100% 3,497 41% 6% 27% 13% 14%
2015 used as a comparison, reflecting the old portfolio before the disposal of Rustenburg and Union Mines.
H1 2018 Cost base (Rbn) Volum e % PGM volum e (koz) Labour Contractors Materials Utilities Sundries
Opencast Mining 1.7 42% 610 23% 9% 61% 2% 5%
Conventional Mining 4.4 35% 508 55% 7% 18% 7% 14%
Mechanised Mining 2.3 23% 334 41% 11% 29% 6% 13%
Concentrating 2.8 14% 0% 39% 20% 27%
Processing 3.3 24% 1% 27% 27% 21%
Total 14.4 100% 1,452 34% 5% 31% 13% 17%
Non ZAR – 10% of total costs Diesel as % of Materials
• 100% at Unki Mogalakwena – 20%
• Circa 25% at Mogalakwena Unki – 12%
Diesel – 3% of total costs Total – 11%
42MOMENTUM BUILDING FOR FUEL CELLS AND HYDROGEN
• Hyundai teams with Audi on fuel cells - Automakers will share patent licensing and
OEMs parts to streamline costs
continue
• GM to develop fuel cells for aircraft - Part of their strategy to rapidly reduce fuel
investing cell costs for deployment in the automotive space
• Toyota announced plans for two major new facilities - Expanded fuel cell stack
and high-pressure hydrogen tank production facilities.
Supply chain
scaling • TANAKA expands FC catalyst production capacity seven fold to meet rising
demand for fuel cell vehicles and industrial equipment.
Multinationals • Anheuser-Busch orders 800 fuel cell trucks from Nikola Motors
placing
significant • Wal-Mart Stores committing to double, to 58, the number of its warehouses that use
fuel cell forklifts
orders
• China plans 300 H2 refueling stations by 2025 and 1,000 by 2030 to support 1 million
FCEVs by 2030.
Governments
increasing • France unveils €100m plan to deploy hydrogen (H2) technologies
support • South Korea plans to replace all 26,000 of its natural gas-powered buses with fuel
cell buses by 2030
43Pt DEMAND BALANCED ACROSS 3 KEY DEMAND SEGMENTS
Gross demand 2018 (000 ounces)(19) Gross platinum demand down
Pt Pd
3.2%
year-on-year
Industrial Jewellery Industrial
27% 30% 20%
Gross palladium demand up
2.2%
year-on-year
Investment
3%
Autocatalyst Gross rhodium demand down
Autocatalyst
40% 80%
3.4%
year-on-year
44AUTOMOTIVE PGM DEMAND TO CONTINUE TO GROW
Global light duty automotive sales outlook (million units)(20)
Diesel car sales decline
96 million 112 million
1.9%
Pd CAGR over 2018-2025
Pure electric
Hybrid 22m
Rh 5m Hybrid
Gasoline/hybrid sales increase
Pd
72m Gasoline 74m
3.0%
CAGR over 2018-2025
Rh
Total light duty 3E outlook
Pt 19m 16m strong
Diesel
2018 2019 2020 2021 2022 2023 2024 2025
positive
Diesel Gasoline Hybrid Pure Electric as internal combustion engine
remains the dominant drive train 45
technologyPt DEMAND FROM AUTOMOTIVE SECTOR RESILIENT
Platinum auto demand split(20) Forecast platinum auto demand(21) Total platinum demand decrease
0.5%
CAGR over 2018-2025, excluding
Europe Light
Global Heavy
Duty Diesel
impact of substitution
Duty Diesel c.3 Moz
15% 50%
Global Heavy duty diesel outlook
Light Duty
Gasoline
8%
strong
positive
due to tighter emissions regulation
and increased demand
RoW Light Duty 2018 2025
Diesel Increase in palladium and
27%
Gasoline pt:pd Substitution at 10%
rhodium prices could lead to
Global Light Duty Gasoline
Global Heavy Duty Diesel substitution
RoW Light Duty Diesel of platinum into gasoline autocatalysts
Europe Light Duty Diesel
46INDUSTRIAL DEMAND REMAINS STRONG
Net demand 2018 (000 ounces)(19) Platinum outlook
Pt Pd positive
following 12% growth in 2017
Other
Chemical 15% Chemical
25% 35%
Other
40% Palladium outlook
neutral
Glass
15% Electrical
25% Rhodium outlook
Fuel Dental
cells Electrical 25%
2% Petroleum &
gas-to-liquid
8%
slightly
10%
negative 47JEWELLERY: 2018 MIXED, OUTLOOK MORE POSITIVE
Net demand 2018 (000 ounces)(22) China remains challenging
short term
ROW
India
4%
Europe
10% negative
11% Japan
6%
Europe, Japan, North America
North
America
neutral
14%
Strong growth from India
China
55% strong
positive
48CONSISTENT INVESTMENT DEMAND FOR THREE DECADES
Net platinum investment demand (000 ounces)(23) Total platinum investment
900 +350 koz
800 in 2017
700
600
Total palladium disinvestment
500
400
300
-365 koz
in 2017
200
100
Growth outlook
0
-100
positive
1985
1987
1989
1991
1993
1995
1997
1999
2001
2003
2005
2007
2009
2011
2013
2015
2017
due to market development
493E PRIMARY SUPPLY TO REMAIN STABLE
3E Primary supply (000 ounces)(24) Current production outlook
negative
2018-2025
Replacement capex
13,407
unlikely to
compensate
for declines in current production profile
Processing capacity, water and
mine economics to act as
2017 2018 2025
Base Replacement Expansion
constraints on
expansion 50FOOT NOTES
(1) Free cash flow is defied as cash flow from operations, less SIB and waste capital, less project capital, less cash tax and net interest
paid, less investment in associates, funding and other.
(2) TRCFR is a measure of the rate of all injuries requiring treatment above first aid per 1,000,000 hours worked
(3) ESG stands for environmental, social and governance
(4) AISC stands for all-in sustaining costs: defined as cash operating costs, overhead costs, other income and expenses, all sustaining
capital expenditure, capitalised waste stripping and allocated marketing and market development costs net of revenue from all metals
other than platinum
(5) Economic free cash flow is operating free cash flow from consolidated activities less/add economic interest in the asset
(6) Treasury bills: Monetising of treasury bills issued by the Zimbabwean Reserve Bank (ZRB) for government debt
(7) Economic free cash flow of JVs and POC includes cash flows from JVs mined, JVs POC, BRPM and third parties
(8) Excludes funding of Bokoni of R0.8 billion
(9) JV Mined share EBITDA margin including the impact of Mototolo tailings dam of 26%
(10) R19,677 before ore recognition, ore capitalisation impact of R106 / Pt ounce in H1
(11) R9,002 before ore recognition
(12) Capital expenditure offset by the insurance proceed for the ACP rebuild
(13) Dividend policy: Pay-out of 30%, based on headline earnings for each reporting period
(14) Source: Johnson Matthey, LBMA, Bloomberg, Company analysis
(15) Source: Johnson Matthey, Company analysis
(16) Level 3-5 environmental incidents is defined as any large incident at least restricted to site, through to a level 5 incident which has a
regional impact, or threatens a sensitive environment or species
(17) Funding from associates and other: BRPM funding will not be recurring from completion of sale of interest in BRPM.
(18) Other: includes market and market development costs, restructuring, working capital movements not allocated to each individual asset
(19) Source: Johnson Matthey
(20) Source: LMC Automotive
(21) Source: Johnson Matthey, LMC Automotive, Company analysis
(22) Source: Johnson Matthey, Platinum Guild International
(23) Source: Johnson Matthey, Bloomberg, Company analysis
(24) Source: Johnson Matthey, Company analysis
(25) While the additional deferred consideration is not yet determinable, the estimates provided are based on current spot 4E metal prices
and the ZAR:USD exchange rate
51You can also read