INVESTOR PRESENTATION - SEPTEMBER 2020 - QUANTUMSCAPE
←
→
Page content transcription
If your browser does not render page correctly, please read the page content below
Investor Presentation
September 2020

                        1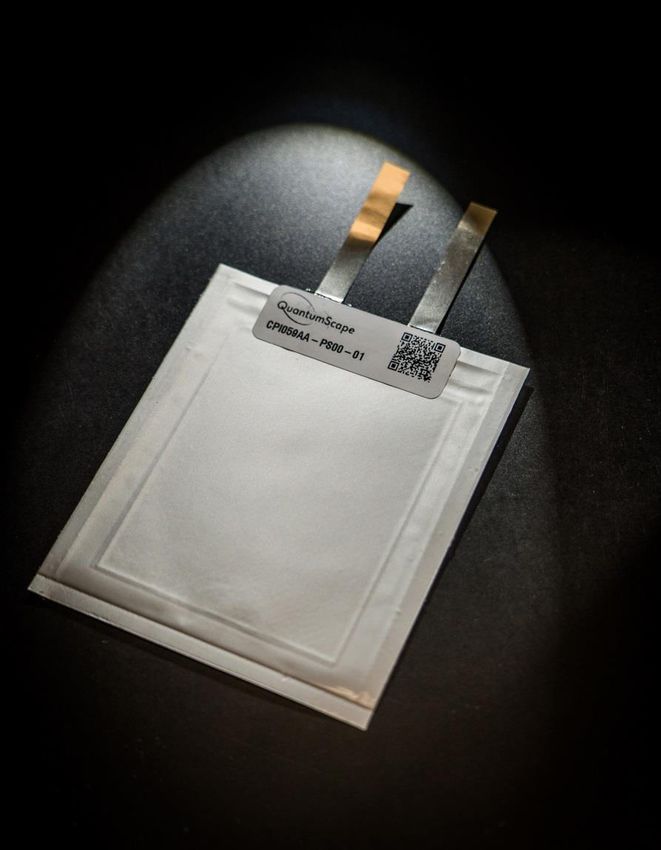
Confidentiality, Proprietary Information, and Forward Looking Statements

This presentation contains proprietary and confidential information of QuantumScape Corporation, and the entire content should be considered “Confidential
Information.” This presentation is made solely for informational purposes, and no representation or warranty, express or implied, is made by QuantumScape or
any of its representatives as to the information contained in these materials or disclosed during any related presentations or discussions. Any securities shall be
offered only to accredited investors in a private placement pursuant to Regulation D under the Securities Act of 1933 or another available exemption, and this
presentation is intended solely for the purposes of familiarizing such investors with the company. This presentation is not an offer to sell nor does it seek an
offer to buy securities in any jurisdiction where the offer or sale is not permitted. To the extent the terms of any potential transaction are included in this
presentation, those terms are included for discussion purposes only.
This presentation contains forward-looking statements and information based on management’s current expectations as of the date of this presentation. All
statements other than statements of historical fact contained in this presentation, including statements regarding QuantumScape’s future operating results,
financial position, business strategy, addressable market, anticipated benefits of its technologies, projected factory economics, pro forma information, and plans
and objectives for future operations and products are forward-looking statements. The words “may,” “will,” “estimate,” “pro forma,” “expect,” “plan,” “believe,”
“potential,” “predict,” “target,” “should,” “would,” “could,” “continue,” “believe,” “project,” “intend” or similar terminology are intended to identify forward-looking
statements, although not all forward-looking statements contain these identifying words. QuantumScape may not actually achieve the plans, intentions, or
expectations disclosed in these forward-looking statements, and you should not place undue reliance on these forward-looking statements. Actual results may
differ materially from those contemplated in these statements due to a variety of risks and uncertainties, including risks and uncertainties related to the
company’s ability to execute on its business strategy, attract and retain customers, ramp commercial production, develop new products, enhance existing
products, compete effectively, and manage growth and costs; and the duration and global impact of COVID-19.
QuantumScape is not under any obligation, and expressly disclaims any duty, to update any statement made in this presentation, whether as a result of new
information, new developments or otherwise, except to the extent that disclosure may be required by law. The company has not independently verified the
statistical and other industry data generated by independent parties and contained in this presentation and accordingly cannot guarantee their accuracy or
completeness.
This presentation contains non-GAAP financial measures and key metrics relating to the company's projected future performance. A reconciliation of these non-
GAAP financial measures to the corresponding GAAP measures on a forward-looking basis is not available because the various reconciling items are difficult to
predict and subject to constant change.

                                                                                                                                                                           2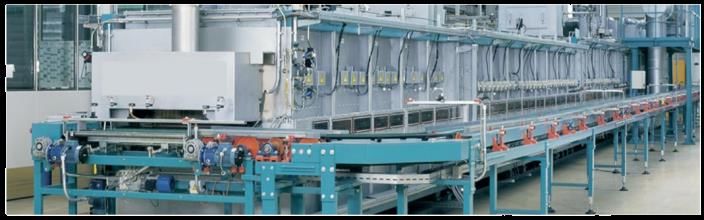
Transaction Overview
    Overview

•   Founded in 2010, QuantumScape Corporation has developed the only lithium-metal solid-state battery with automotive OEM validation

•   Kensington Capital Acquisition Corporation (NYSE: KCAC.U) is an automotive-related special purpose acquisition company with $230mm cash held in trust

•   QuantumScape and Kensington are combining to advance and accelerate the commercialization of QuantumScape’s battery technology

    Capital Structure
•   QuantumScape shareholders are rolling 100% of their equity
•   Transaction proceeds are being retained in the business
•   Pro forma for the transaction (assuming no redemptions)
       o   QuantumScape will have ~$1.15bn of cash to fund commercialization plans ($230mm KCAC cash held in trust, $500mm in PIPE proceeds, and $471mm
           QuantumScape cash¹)
       o   No additional equity capital need expected prior to production launch

    Valuation
•   EV of $3.3bn which is ~1.0x of 2027E sales

•   Represents attractive entry multiples relative to peer group metrics

                             Kensington has identified QuantumScape as a unique and compelling investment opportunity
                           that is developing leading solid-state battery technology to accelerate the shift to electric vehicles

              (1) QuantumScape cash and cash equivalents as of June 30, 2020 pro forma for $388mm Series F financing; $188mm anticipated to fund concurrent with PIPE; $100mm of Volkswagen's investment anticipated to fund on December
                                                                                                                                                                                                                                           3
                 1, 2020 and $100mm is subject to technical milestones, net of fees.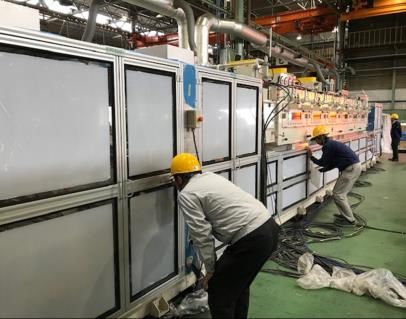
QuantumScape: Redefining Batteries

                                                         QuantumScape has the
     Once in a               Solid-state batteries are   only lithium-metal solid-
  century shift to            the key to making this        state battery with
electrified vehicles                   shift                 automotive OEM
                                                                 validation

                                                                                 4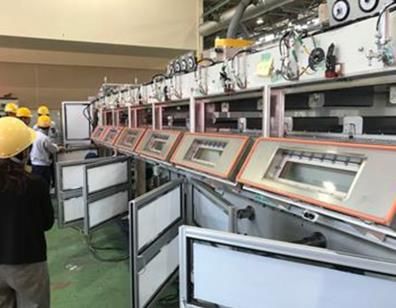
Visionary Management Team
                                                                Select Management Team Members

       Jagdeep Singh                              Prof. Fritz Prinz                            Dr. Tim Holme                                    Dr. Mohit Singh
        Founder / CEO                      Founder / Chief Scientific Advisor          Founder / Chief Technology Officer                   Chief Development Officer
         (Chairman)                               (Board Member)
● Founder / CEO Infinera (NASDAQ: INFN);   ● Chair, Mechanical Engineering, Stanford    ● Post-doctoral Associate, Stanford             ●   CTO and co-founder, SEEO
  Lightera, now Ciena (NASDAQ: CIEN);      ● Professor, Materials Science, Stanford     ● PhD, Mechanical Engineering, Stanford; BS,    ●   Solid-state energy storage world expert
  OnFiber, now Qwest; AirSoft              ● PhD, Physics, University of Vienna            Physics, Stanford                            ●   PhD, Chem & Biomol Eng, Tulane
● MS Computer Science, Stanford                                                                                                         ●   Postdoc, Polymers, Berkeley

       Kevin Hettrich                             Howard Lukens                               Jay Underwood                                       Mike McCarthy
     Chief Financial Officer                      Chief Sales Officer                       Vice President, Sales                      Chief Legal Officer / Head of Corp. Dev.

●   Bain Capital                           ● VP WW Sales, Infinera (NASDAQ: INFN)      ● Sales Director, Northern Europe, Infinera       ● CLO & CAO, Infinera (NASDAQ: INFN)
●   McKinsey & Company                     ● VP Strategic Sales, Ciena, (NASDAQ:       ● Product Planning, Infinera                      ● SVP & General Counsel, Ciena (NASDAQ:
●   US Department of Energy                    CIEN)                                   ● MS Engineering                                     CIEN)
●   MBA & MS, Stanford                     ● VP WW Sales, Lightera                                                                       ● J.D. Vanderbilt

                                                                                                                                                                                      5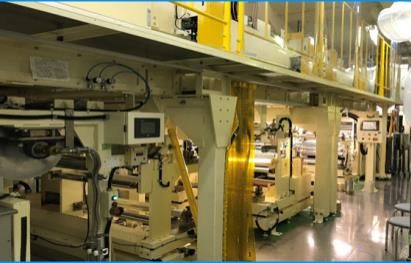
Backed by Leading Investors
                                                                          Select Board Members and Investors
                          Current Board Members                                                                                                                Existing Investors

                                                                                                                                         $802 Million of Total Funding Commitments¹

  John Doerr                                              JB Straubel

                                                                                                                                                              Bill Gates

 Vinod Khosla                                              Frank Blome
                                                                                                                                               Kensington Capital Acquisition Corp

Dipender Saluja                                          Jürgen Leohold
                                                                                                                        • Management and board with extensive public company experience and
                                                                                                                          operating capabilities in the automotive and automotive-related sector
                                                                                                                        • Relevant automotive experience to optimize program launches and capital
                                                                                                                          deployment while facilitating commercial relationships
                                                                                                                        • Track record of creating significant shareholder value in automotive
                                                                                                                          businesses
                             Brad Buss

           (1) Pro forma for $388mm Series F financing; $188mm anticipated to fund concurrent with PIPE; $100mm of Volkswagen's investment anticipated to fund on December 1, 2020 and $100mm is subject to technical milestones.   6
              Note: Volkswagen will receive an additional board seat when the first tranche of its Series F investment closes. Kensington board member will be added after the transaction closes.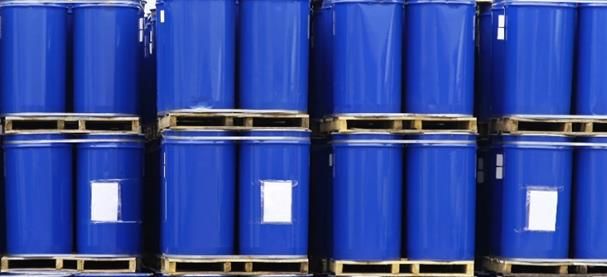
$802mm of Committed Capital¹
    Over $300mm spent on development to date

    10 Years of R&D Investment
    Founded in 2010

    200+ Employees
    World Class Next-gen Battery Development Team

    200+ Patents²
    Materials, Use and Process

    Extensive Trade Secrets
    Processes and Intellectual Property

(1) Pro forma for $388mm Series F financing; $188mm anticipated to fund concurrent with PIPE; $100mm of Volkswagen's investment anticipated to
    fund on December 1, 2020 and $100mm is subject to technical milestones.                                                                      7
(2) Includes patents and patent applications.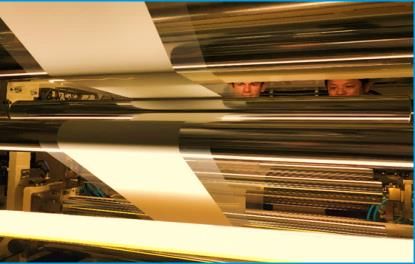
Lithium-Metal: The Next Generation of Battery

                                                                                                                                                                       Lithium-Metal

                                                                                                                              Lithium-Ion

                                                               Nickel Metal Hydride

                 Lead Acid

                   1970s                                                  1980s                                           1990s-Today                                 QuantumScape
Source: Cano et al (2018). Nature Energy, 3(4), 279–289; Ovshinsky Science 260 (1993) 176; Ding et al, Electrochem. Energ. Rev. 2, 1–28 (2019); Management analysis                    8
Massive Untapped Demand If Batteries Meet Mass Market Requirements
90M+ vehicles produced annually represents in excess of $450B of potential battery sales annually¹
                                                                                                                                                                 Customer Requirements For Mass
                                                                                                                                                                        Market Adoption

                                                                                                                                                                          Energy / Capacity
                                                                                                                                                                          > 300 mile range

                                                                                                                                                                          Fast Charging
                                                                                                                                                                          Charge in < 15 minutes

                                                                                                                                                                          Cost
                                                                                                                                                                          < $30K, 300 mile EVs

                                                                                                                                                                          Battery Lifetime
                                                                                                                                                                          > 12 years, > 150,000 miles

                                                                                                                                                                          Safety
                                                                                                                                                                          Solid, non-oxidizable separator

                             2% PHEV + BEV Penetration²
Source: International Organization of Motor Vehicle Manufacturers (OICA); IEA
(1) Based on 2019 global vehicle production; includes passenger vehicles, heavy trucks, buses and coaches (OICA). Battery opportunity assumes $100 / KWh and 50KWh+ battery pack.                       9
(2) % of Global Car Stock in 2019 (IEA).
Conventional Lithium-Ion Cell Energy Density Has Hit a Ceiling
                              Need for Disruptive Innovation to Dramatically Advance Energy Density

                                                                                                             Density Requirement: Mass: 400-500 Wh/kg (Volume: 1000 Wh/L)

                                                                                                                                                                                      Gap

                                                                                                                                                                              NCA        NCA
                                                                                                                                                                             18650¹     21700¹

Source: Placke et al. J. Solid State Electrochem., 21(7), 1939–1964; Quinn et al, Journal of The Electrochemical Society, 165 (14) A3284-A3291 (2018); Management analysis                       10
(1) Highest energy density in mass market EVs today.
Conventional Lithium-Ion Batteries Have Reached Their Physical Limit
Performance Limited by Graphite (Carbon) / Silicon Anode Chemistry
Anode current collector
Graphite / Silicon Anode
Liquid electrolyte
Porous separator
Cathode active material
Liquid electrolyte
Cathode current collector
Wound cylindrical
cell (e.g. 21700)
11Lithium-Metal Anode is Required for High Energy Density
The Industry Needs a Fundamental Redesign of Battery Technology
600
Lithium-Metal Anode Required Lithium-Metal
Theoretical Cell Energy Density (Wh/kg)
Anode
500 Lithium-Metal
Batteries
• Energy density of
400 conventional anode
limited
Graphite / Silicon
300 Anode Conventional
Lithium-Ion
Graphite Anode
Batteries • Lithium-metal anode
200 necessary to achieve
high energy density
100
• Lithium-metal cannot be
0 used without a solid-state
LiMnPO4
HE-NMC
LiVPO4F
LiNi0.5Mn1.5O4
NMC811
FeF2
CoF2
FeF3
LiFeBO3
Li2MnSiO4(2Li)
NCA
NiF2
separator
Cathode Material
Source: Andre et al, J Mater Chem A, (2015) 6709 12QuantumScape Has The Solution
Rethinking the Battery
Conventional Liquid Battery QuantumScape Solid-State Battery
Anode Current
Collector
Graphite / Silicon
Anode Discharged Charged
(as manufactured)
Liquid Electrolyte Anode Current Collector
Lithium Metal Anode 3
1 Lithium-Metal
Porous Separator 2 Solid-State Separator
Cathode Active Cathode Active
Catholyte
Liquid Electrolyte
Cathode Current
Cathode Current Collector
Collector
1 2 3
Anode-less Manufacturing Lithium-Metal Anode
Solid-State Separator
Anode-less cell design with Only stable implementation of
Ceramic electrolyte with high
lithium plated during charge a lithium-metal anode
dendritic resistance
cycles
13The Only Battery That Enables Mass Market Transformation
QuantumScape’s Value Proposition
Energy / Capacity: Significantly increases volumetric and gravimetric energy density
• Eliminates graphite/silicon anode host material
Fast Charging: EnablesQuantumScape Technology is Lower Cost
17%
• Anode material cost
• Elimination of anode • Anode manufacturing
cost
material • Formation & aging
related manufacturing
• Reduction in manufacturing costs
costs
– No anode manufacturing
– Formation / aging
substantially reduced
• Excludes system level
benefits from lower weight /
volume
• QuantumScape benefits
from industry wide cost
declines on standard
components (e.g. Cathode)
Source: P3 Consulting and Management analysis 15Significant Technology Advantage
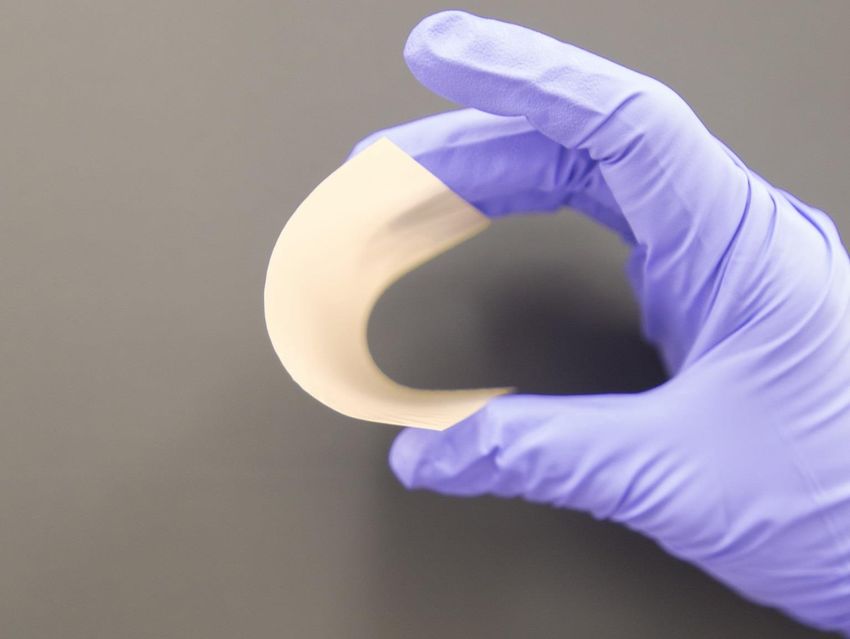
Protected by ~200 Patents¹ and ~100 Trade Secrets
Ceramic Solid-State Separator Single Layer Pouch Cell
(1) Includes patents and patent applications. 16Revolutionary Technology Removes the Tradeoffs
Luxury Performance Vehicle: Constant Mass Comparison Mass Market Sedan: Constant Volume Comparison
Today’s Today’s
Lithium-Ion % Improvement Lithium-Ion % Improvement
System 350 L 350 L 81% System 160 L 160 L 88%
Volume (260 Wh/L) (470 Wh/L) (Energy Density) Volume (220 Wh/L) (414 Wh/L) (Energy Density)
System System
90 kWh 164 kWh 82% 35 kWh 66 kWh 88%
Energy Energy
400 km 730 km 200 km 375 km
Range 82% Range 88%
(250 Miles) (450 Miles) (123 Miles) (233 Miles)
22.5-min Fast Charge 15-min Fast Charge 60-min Fast Charge 15-min Fast Charge
Charge 33%+ Charge 75%+
(5% 80%) (0% 80%) (10% 80%) (0% 80%)
Power 420kW 650kW 55% Power 100kW 150kW 50%
Solid, Non-oxidizable Solid, Non-oxidizable
Safety Organic Electrolyte Safety Organic Electrolyte
Electrolyte Electrolyte
Source: Automotive OEM disclosure and commentary; Management estimates and analysis. Figures in table rounded. 17“Volkswagen has already tested QuantumScape early-stage solid-state battery
sample cells in Germany running at automotive rates of power.”
–Volkswagen Group Press Release
18Volkswagen Committed to QuantumScape Technology
Volkswagen Group Overview “Volkswagen has become the largest shareholder of QuantumScape. Our
US$100 million investment is a key building block in the Group’s battery
• ~11 million vehicles produced in FY2019 strategy. One of the long-term targets is to establish a production line for solid-
state batteries by 2025.”
• ~$38 billion investment in electric mobility by 2024 - Herbert Diess, Volkswagen AG CEO
• Plans to launch ~70 electric vehicle models and
produce 22 million electric vehicles by 2029 “The Volkswagen Group has established a joint venture with QuantumScape, a
manufacturer of solid-state batteries. The shared goal of the companies is large-
scale production...”
Brands
Select
- Oliver Blume, Porsche CEO
“In June 2020, the Volkswagen Group also announced plans to increase its
Volkswagen Partners with QuantumScape shareholding in the US battery specialist QuantumScape. The objective is to
promote the joint development of solid-state battery technology. In the future,
1 Corporate funding commitment of $300+ million solid-state batteries should result in a significantly increased range and faster
charge times. They are regarded as the most promising approach to electric
2 Strong relationship since 2012, including mobility for generations to come. Volkswagen has already been collaborating
development collaboration, testing of prototype cells with QuantumScape since 2012 and is the largest automotive shareholder thus
and representation on the QS board of directors far. Both founded a joint venture in 2018, the aim of which is to prepare the
mass production of solid-state batteries for Volkswagen.”
3 Founded a JV to prepare for the mass production of - Volkswagen Group Half-Yearly Financial Report, July 2020
solid-state batteries for Volkswagen
Source: Volkswagen AG Half-Yearly Financial Report published July-2020, 2019 Annual Report published Mar-2020, press releases published Mar-2019, Nov-2019 and Jun-2020, Half-year press conference published Aug-2018;
Porsche Annual Press Conference published Mar-2019). Page 18 based on Volkswagen AG press release published Sep-2018. 19QuantumScape is a Step-Function Ahead of Conventional Cells
Energy-optimized Cell Designs
NCA or Ni-rich
NMC + Silicon /
Carbon Anode
NCA3
NMC2
LFP1
Source: Argonne National Laboratory; Management estimates 20
1 Lithium, iron, and phosphate 2 Nickel, manganese, and cobalt 3 Nickel, cobalt, and aluminumEstablished Manufacturing Processes and Supply Chains
Unique processes use equipment that is Materials have robust and well-established
already used at scale in battery or ceramics supply chains served by diversified
industries chemical, mining and materials firms
Equipment designed and manufactured by world’s leading Separator materials are widely used in other industries
vendors
21QuantumScape Company Timeline and Key Milestones
In 10 years, QuantumScape Executed on Key Technological and Operational Breakthroughs
2012 2014 2016 2018 2020
Volkswagen (VW) Establishes 80K ft2 facility World-first demonstration of JV forms with VW, confirms Series E VW announces Series F
partnership begins with state-of-the-art solid-state separator investment investment
analytical tools and capability to meet
dryrooms in San Jose, automotive requirements Develops Li-free anode design Commercial size SLP1
California demonstration
World-first validation of full cell cycling
reliably with lithium-metal at
automotive rates
2010/2011 2013 2015 2017 2019
QuantumScape founded and Separator materials QuantumScape selects the Develops scalable separator World-first validation of Li-free full cell
spun out of Stanford by exploration in rapid 12 hour separator material production process cycling reliably with lithium-metal at
Jagdeep Singh, Professor design/build/test cycle automotive rates
Fritz Prinz and Dr. Tim Holme
Patents 35 54 95 139 200+
No. of
28 131 108 148 200+
Employees
Note: Patent and Employee metrics as of December 31 2012, 2014, 2016, 2018, and present. Patents metric includes granted and pending applications.
1 Single layer pouch 22Validated Technology: Next Steps Scaling The Product
Increasing High-Volume Battery
Multi-Layer Cell
Separator Yield Manufacturing
23QuantumScape: Driving Environmental Sustainability
Key ESG Themes
Climate Change Reducing global CO2 emissions
Responsible Production Designed around abundant resources
Energy Efficiency Enables clean energy sources
24QuantumScape Unlocks Massive Global Opportunity 90M+ vehicles produced annually represents in excess of $450B of potential battery sales annually¹ Source: International Organization of Motor Vehicle Manufacturers (OICA); IEA 25 (1) Based on 2019 global vehicle production; includes passenger vehicles, heavy trucks, buses and coaches (OICA). Battery opportunity assumes $100 / KWh and 50KWh+ battery pack
Manufacturing Scale-Up Timeline
                         2021                             2022                              2023                             2024                           2025                             2026

                       Development / Validation
Product

                                                                   OEM Sample Testing

                   Planning /
                  Engineering
1GWh Factory

                                     Site Selection / Design / Construction

                                                                                Equipment
                                                                                  Install

                                                                                               Production Validation & SOP

                                                                  Planning / Engineering
20GWh Expansion

                                                                                                       Site Selection / Design / Construction

                                                                                                                                                Equipment
                                                                                                                                                  Install

                                                                                                                                                               Production Validation & SOP

                                                                                                                                                                                                    26
QuantumScape Factory Economics (QS-1, 20GWh)
($ in Billions)
$ 1.6
$ 1.5 $ 1.5 $ 1.4 $ 1.4 $ 1.4 $ 1.3
$ 1.3 $ 1.3 Capex + Start-up Costs¹: $1.6B
SOP
— ~70% Cell Factory
— ~30% Separator Factory
$ 0.4
Equity Need²: ~$500M
$(0.1) $(0.1)
$(0.0) $(0.2) $(0.2)
$(0.2) $(0.2)
$(0.6)
$(0.6)
-4 -3 -2 -1 0 1 2 3 4 5 6 7 8 9
Period
Revenue Capex + Startup costs (post debt financing) Debt financing
Note: Assumes 5% annual price and cost declines. Chart reflects 100% of factory financials.
27
(1) Includes costs for planning, FAT / SAT, and start-up; excludes maintenance capex and interest expense.
(2) Assumes debt financing for the remainder; debt financing net of amortization.Summary Financials
$ in millions 2022E 2023E 2024E 2025E 2026E 2027E 2028E
Manufacturing capacity Represents ~910k vehicles
Total Production Capacity (GWh) 0 0 0.25 0.75 6 46 91 annually (assumes 100KWh
pack)
QS-1 Pilot (1 GWh) 0 0 0.25 0.75 1 1 1
QS-1 Expansion (20 GWh) 0 0 0 0 5 15 20 Commentary
QS-2 0 0 0 0 0 30 70
• Fully funded business to
start of production
Income Statement
Revenue - - $ 14 $ 39 $ 275 $ 3,210 $ 6,439 • High margins reflect
QuantumScape’s unique
% Growth NM 181% 614% 1066% 101% technology and structural
cost advantage due to
anode-less manufacturing
Gross margin - - $ 0 $ 2 $ 73 $ 1,006 $ 1,914
• Assumes offtake
% Margin 1% 5% 26% 31% 30% agreements with IG
partners supporting
meaningful debt financing
EBITDA $ (102) $ (114) $ (130) $ (120) $ (59) $ 808 $ 1,622
• Assume no capacity
% Margin NM NM NM 25% 25%
growth past 2028
• Assumes 50% ownership
FCF (after project financing) $ (137) $ (169) $ (222) $ (691) $ (1,346) $ (533) $ 563 of cell factory and 100%
ownership of separator
factory for QS-1; 100%
No Capacity After QS-1 Expansion (20GWh):
ownership for QS-2
FCF (after project financing) $ (137) $ (169) $ (222) $ (312) $ (289) $ (17) $ 69
2H2020E - 2021E FCF: $(184)mm
Note: Non-GAAP financial metrics. Figures represent 50% of revenue and 50% of costs for QS-1 cell factory; Revenue includes margin for sale of separator to QS-1 cell factory. Adjusted EBITDA is defined as earnings
before interest expense, interest income and other income, taxes, depreciation, amortization, and stock-based compensation. FCF is defined as cash provided by operating activities less purchases of property and 28
equipment net of asset / project financing.Transaction Overview
(in millions, except per share data)
Sources Pro Forma Valuation
KCAC Shares $3,688 Share Price $10.00
KCAC Cash Held in Trust 230 PF Shares Outstanding 447.6
QuantumScape Cash¹ 471 Equity Value $4,476
PIPE Investment 500 (+) Debt 0
Total Sources $4,889 (-) Pro Forma Cash¹ (1,155)
Enterprise Value $3,321
Uses Illustrative Pro Forma Ownership2
Pro Forma Cash¹ $1,155 KCAC Public
Shares, 23.0m, 5.1% KCAC Sponsor Shares,
Equity Consideration to QS Existing Investors 3,688 5.8m, 1.3%
PIPE Investor
Estimated Transaction Expenses 46 Shares, 50.0m,
11.2%
Total Uses $4,889 Existing QS
Rollover Equity,
368.8m, 82.4%
Note: Assumes no redemptions from Kensington’s existing public shareholders. Assumes PIPE shares are issued at a price of $10.00. Excludes the impact of Kensington’s warrants (public or private)
(1) QuantumScape cash and cash equivalents as of June 30, 2020 pro forma for $388mm Series F financing; $188mm anticipated to fund concurrent with PIPE; $100mm of Volkswagen's investment anticipated to fund on
December 1, 2020 and $100mm is subject to technical milestones, net of fees. 29
(2) Chart reflects economic ownership. Pro forma company will retain QuantumScape’s dual-class share structure with class A shares (1 vote per share) and Class B shares (10 votes per share), which are owned by founders,
early investors, and employees. All other equity issued through the merger, as well as the PIPE, and Series F transactions will be Class A shares. Class B shares will represent more than 85% of the pro forma voting interest.Public Peers Benchmarking
Operational Benchmarking Valuation Benchmarking
Revenue Growth (%) Enterprise Value ($bn)
Median: 37% $565.1bn
101% $68.7bn
67%
37% 34% $23.5bn
$3.3bn
QS Nio Tesla CATL QuantumSpace Tesla CATL Nio
'27E-'28E '20E-'22E '20E-'22E '20E-'22E
Gross Margin (%) EV / Revenue (x)
Median: 22% Median: 6.9x
31% 30% 13.4x
27%
22% 6.9x
13% 6.5x
1.0x 0.5x
QS QS CATL Tesla Nio QS QS Tesla CATL Nio
'27E '28E '21E '21E '21E '27E '28E '21E '21E '21E
EBITDA Margin (%) EV / EBITDA (x)
Median: 18% Median: 58.3x
25% 25% 82.7x
20% 16%
33.9x
nm 4.1x 2.0x nm
QS QS CATL Tesla Nio QS QS Tesla CATL Nio
'27E '28E '21E '21E '21E '27E '28E '21E '21E '21E
Source: Company information and FactSet as of August 31, 2020 30
Note: Metrics reflect non-GAAP financial measuresQuantumScape Has Significant Upside Potential
Future Discounted Post- Money
Summary of Approach Enterprise Value Enterprise Value Enterprise Value
($mm)
• Applies a range of 5.0x – 9.0x
EV / Revenue multiple to
QuantumScape’s 2028E revenue $57,950
to arrive at an Implied Future
Enterprise Value range. Future
Enterprise Value range is
discounted 7 years to arrive at an $45,072
Implied Discounted Enterprise
Value range
• The applied range of multiples is $32,195
centered around +/- 2x forward
EV / Revenue median of
QuantumScape’s peer group $16,173
$12,579
$8,985 $3,321
5.0x - 9.0x Discounted 7 years Post-Money
Post- Enterprise
Money
2028E Revenue back at 20% Enterprise Value
Note: QuantumScape anticipates it will require additional debt, equity, or partner funding / prepayments through 2028; Company financials reflect non-GAAP financial measures 31Overview of Kensington Capital Acquisition Corp.
Kensington Overview
Justin Mirro
Chairman & Chief Executive Officer
• 25 years of operating, M&A and financing experience in the automotive
and automotive-related sector
• President of Kensington Capital Partners
• NYSE-listed (KCAC.U) Special Purpose Acquisition Company (“SPAC”) with $230
million in trust for the purpose of combining with an automotive technology
company
Bob Remenar
• Management and board with extensive public company experience and operating
Vice Chairman & President capabilities in the automotive and automotive-related sector
• 35 years of operational, manufacturing and management experience within
• Relevant automotive experience to optimize program launches and capital
the automotive and automotive-related sector
deployment while facilitating commercial relationships
• Former CEO of Nexteer Automotive and Chassix
• Track record of creating significant shareholder value in automotive businesses
Board Members
Simon Boag
Tom LaSorda Don Runkle
Chief Technology Officer Former Chief Executive Officer Former Chairman and CEO of
• 30 years of leadership, manufacturing, operational and technological of Chrysler Multiple Automotive Businesses
experience with automotive supply chains
• Former President of Mopar and EVP of Chrysler Purchasing
Anders Pettersson Matt Simoncini
Former Chief Executive Officer Former Chief Executive
of Thule Group Officer of Lear Corporation
Dan Huber
Chief Financial Officer
• 20 years of experience in investment banking, consulting, business Mitch Quain
development and operational management Investor and Board Member of
• Co-Founder of The Motor Weekly newsletter Multiple Public Companies
32QuantumScape Fulfills Kensington’s Investment Objectives
Investment Criteria
North America-based automotive business
valued at greater than $1.0 billion
Leverages high-growth mega-trends
of emerging technology proliferation
Validated technical, commercial and financial capabilities
based upon global automotive standards
Valuation supported by fundamental analysis of
profitability and comparable companies
World-class management team and board
with expertise in leading and running public companies
Business enhanced by Kensington’s automotive experience
to de-risk and accelerate commercial success
33Appendix
34Consolidated Balance Sheet
(In Thousands, Except Share and per Share Amounts)
Year Ended December 31
2019 2018
Assets
Current Assets
Cash and Cash Equivalents¹ $22,822 $31,052
Marketable Securities 107,099 148,161
Prepaid Expenses and Other Current Assets 1,255 706
Total Current Assets $131,176 $179,919
Property and Equipment, Net 25,492 28,702
Right-of-use Lease Asset 12,942 –
Other Assets 2,774 2,593
Total Assets $172,384 $211,214
Liabilities, redeemable convertible preferred stock and stockholders'deficit
Current Liabilities
Accounts Payable $2,851 $757
Accrued Liabilities 1,307 1,404
Accrued Compensation 1,112 802
Lease Financing Obligation, Short-Term 0 669
Operating Lease Liability, Short-Term 1,080 0
Deferred Cost, Short-Term 873 1,455
Total Current Liabilities $7,223 $5,087
Deferred Rent Expense, Long-Term 0 316
Lease Financing Obligation, Long-Term 0 10,361
Operating Lease Liability, Long-Term 12,463 0
Convertible Preferred Stock Warrant Liabilities 1,860 1,766
Deferred Cost, Long-Term and Other Liabilities 436 764
Total Liabilities $21,982 $18,294
Stockholders’ Equity
Redeemable Convertible Preferred Stock2 $405,575 $405,575
Common Stock3 1 1
Additional Paid-in Capital $43,077 $35,957
Treasury Stock Fair Market Value at Repurchase; 438,191 Shares at Dec. 31, 2019 and 2018 (4,189) (4,189)
Accumulated Other Comprehensive Income (Loss) 90 (31)
Accumulated Deficit (295,862) (246,083)
Total Quantumscape Stockholders’ Deficit $(256,883) $(214,345)
Non-Controlling Interest 1,710 1,690
Total Stockholders’ Deficit $(255,173) $(212,655)
Total Liabilities, Redeemable Convertible Preferred Stock and Stockholders' Deficit $172,384 $211,214
Note: Statements above are unaudited. Financials consistent with PCAOB audit standard.
(1) $3,409 and $3,368 as of 31-Dec-2019 and 2018, respectively, for joint venture.
(2) Par value of $0.0001 per Share; 49,073,189 and 49,073,189 shares authorized as of 31-Dec-2019 and 2018, respectively, 48,390,851 and 48,390,851 shares issued and outstanding with aggregate liquidation
preference of $414,335 and $414,335 as of 31-Dec-2019 and 2018, respectively.
35
(3) $0.0001 par value; 128,000,000 shares authorized (81,000,000 class A and 47,000,000 class B); 11,229,241 and 11,075,476 class A and class B shares issued and outstanding at 31-Dec-2019 and 2018, respectively.Consolidated Statements of Operations and Comprehensive Loss
(In Thousands, Except Share and per Share Amounts)
Year Ended December 31
2019 2018
Operating Expenses
Research and Development $45,944 $35,634
General and Administrative 9,874 9,768
Amortization of Intangible Assets – 51
Total Operating Expenses $55,818 $45,453
Loss from Operations $(55,818) $(45,453)
Other Income (Expense)
Interest Expense $(94) $(1,520)
Interest Income 3,608 2,127
Other Income 1,041 702
Total Other Income $4,555 $1,309
Net Loss $(51,263) $(44,144)
Net Income Attributable to Non-controlling Interest 20 5
Net Loss Attributable to Common Shareholders $(51,283) $(44,149)
Net Loss $(51,263) $(44,144)
1 121 89
Other Comprehensive Income (Loss):
Total Comprehensive Loss $(51,142) $(44,055)
Less: Comprehensive income attributable to Non-controlling Interest 20 5
Comprehensive Loss Attributable to Common Shareholders $(51,162) $(44,060)
Basic and Diluted Net Loss Per Share $(4.58) $(3.97)
Basic and Diluted Weighted-Average Common Shares Outstanding 11,194,183 11,108,638
Note: Statements above are unaudited. Financials consistent with PCAOB audit standard. 36
(1) Unrealized Gain on Marketable Securities.Consolidated Statements of Cash Flows
(In Thousands)
Year Ended December 31
2019 2018
Operating Activities
Net Loss $(51,263) $(44,144)
Adjustments to Reconcile Net Loss to Net Cash Used in Operating Activities
Depreciation and Amortization $5,577 $5,681
Amortization of Right-Of-Uses-Assets 1,159 –
Gain on Property and Equipment Disposal (90) –
Amortization of Discount on Marketable Securities (1,964) (1,334)
Amortization of Deferred Cost (873) (1,455)
Stock-Based Compensation Expense 6,811 5,882
Changes in Fair Value of Convertible Preferred Stock Warrants 94 630
Changes in Operating Assets and Liabilities
Prepaid Expenses and Other Assets $(550) $(174)
Accounts Payable, Accrued Liabilities, and Accrued Compensation 319 (808)
Operating Lease Liability (951) –
Net Cash Used in Operating Activities $(41,731) $(35,722)
Investing Activities
Purchases of Property and Equipment $(9,846) $(7,402)
Maturities of Investments 239,500 122,750
Purchases of Investments (196,353) (190,042)
Net Cash Provided by (Used in) Investing Activities $33,301 $(74,694)
Financing Activities
Proceeds from Issuance of Common Stock, Net of Issuance Costs $394 $1,084
Proceeds from Issuance of Preferred Stock, Net of Issuance Costs – 122,755
Capital Contribution from Non-Controlling Interest in Joint Venture – 1,685
Repurchase of Common Stock – (4,189)
Repayment of Lease Financing Obligation – (578)
Net Cash (Used in) Provided by Financing Activities $394 $120,757
Net (Decrease) / Increase in Cash, Cash Equivalents and Restricted Cash (8,036) 10,341
Cash, Cash Equivalents and Restricted Cash at Beginning of Year at Beginning of Period 33,632 23,291
Cash, Cash Equivalents and Restricted Cash at Beginning of Year at End of Period $25,596 $33,632
Supplemental Disclosures of Cash Flow Information
Cash Paid for Interest $985 $878
Non-Cash Investing and Financing Activities
Purchase of Property and Equipment, Accrued but not Paid $2,547 $517
37
Note: Statements above are unaudited. Financials consistent with PCAOB audit standard.You can also read