INVESTOR PRESENTATION Q2 FY2021 - August 24, 2020 - AWS
←
→
Page content transcription
If your browser does not render page correctly, please read the page content below
INVESTOR PRESENTATION
Q2 FY2021
August 24, 2020
Except for the historical information contained herein, certain matters in this presentation including, but not limited to, statements as to: our financial
position; our markets; the performance, benefits, abilities and impact of our products and technology; NVIDIA continuing to win new business; our
partnerships; the impact of COVID-19 and our response; our use of cash; NVIDIA’s financial outlook for the third quarter of fiscal 2021, including the impact of
Mellanox; our operating expenses for fiscal 2021; the benefits and impact of the Mellanox acquisition; our growth drivers; the users and customers of our
products and us reaching them; our financial policy; future revenue growth; our opportunities in existing and new markets; the TAM for our products; and
performance in our financial metrics are forward-looking statements within the meaning of the Private Securities Litigation Reform Act of 1995. These
forward-looking statements and any other forward-looking statements that go beyond historical facts that are made in this presentation are subject to risks
and uncertainties that may cause actual results to differ materially. Important factors that could cause actual results to differ materially include: global
economic conditions; our reliance on third parties to manufacture, assemble, package and test our products; the impact of technological development and
competition; development of new products and technologies or enhancements to our existing product and technologies; market acceptance of our products or
our partners' products; design, manufacturing or software defects; changes in consumer preferences and demands; changes in industry standards and
interfaces; unexpected loss of performance of our products or technologies when integrated into systems and other factors.

NVIDIA has based these forward-looking statements largely on its current expectations and projections about future events and trends that it believes may
affect its financial condition, results of operations, business strategy, short-term and long-term business operations and objectives, and financial needs. These
forward-looking statements are subject to a number of risks and uncertainties, and you should not rely upon the forward-looking statements as predictions of
future events. The future events and trends discussed in this presentation may not occur and actual results could differ materially and adversely from those
anticipated or implied in the forward-looking statements. Although NVIDIA believes that the expectations reflected in the forward-looking statements are
reasonable, the company cannot guarantee that future results, levels of activity, performance, achievements or events and circumstances reflected in the
forward-looking statements will occur. Except as required by law, NVIDIA disclaims any obligation to update these forward-looking statements to reflect future
events or circumstances. For a complete discussion of factors that could materially affect our financial results and operations, please refer to the reports we
file from time to time with the SEC, including our Annual Report on Form 10-K and quarterly reports on Form 10-Q. Copies of reports we file with the SEC are
posted on our website and are available from NVIDIA without charge.

NVIDIA uses certain non-GAAP measures in this presentation including non-GAAP gross margin, non-GAAP operating margin, non-GAAP net income, non-GAAP
operating income, non-GAAP diluted earnings per share, non-GAAP operating expenses, non-GAAP other income (expense), net, free cash flow, and adjusted
EBITDA. NVIDIA believes the presentation of its non-GAAP financial measures enhances investors' overall understanding of the company's historical financial
performance. The presentation of the company's non-GAAP financial measures is not meant to be considered in isolation or as a substitute for the company's
financial results prepared in accordance with GAAP, and the company's non-GAAP measures may be different from non-GAAP measures used by other
companies. Further information relevant to the interpretation of non-GAAP financial measures, and reconciliations of these non-GAAP financial measures to
the most comparable GAAP measures, may be found in the slide titled “Reconciliation of Non-GAAP to GAAP Financial Measures”.

                                                                                                                                                          2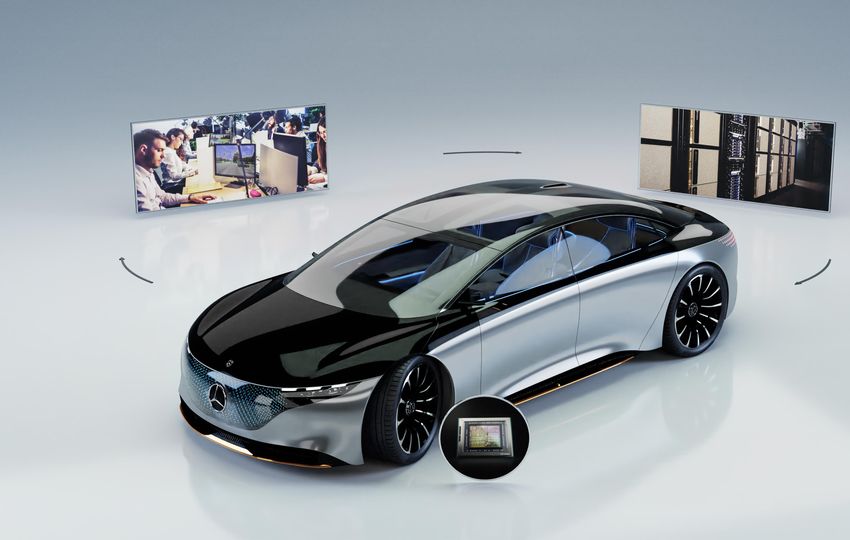
CONTENT

Q2 FY2021 Earnings Summary

Key Announcements This Quarter

NVIDIA Overview

Financials

Non-GAAP to GAAP Reconciliation

                                  3
Q2 FY21
EARNINGS SUMMARY
               4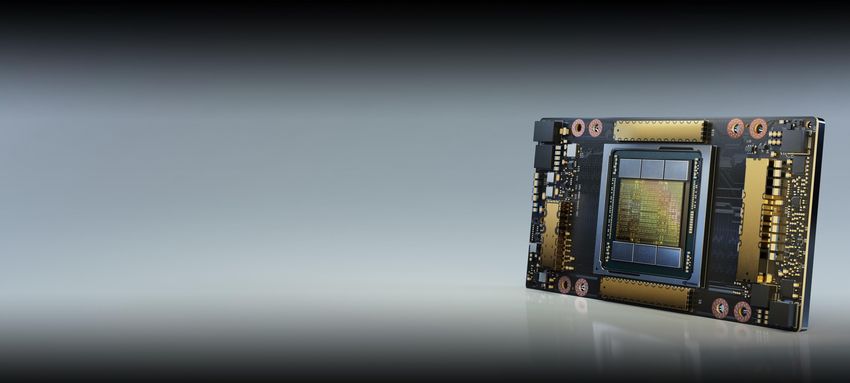
“The world is confronting COVID-19, one of the
greatest challenges in human history.

“We owe our thanks to those on the front lines
of this crisis: first responders, healthcare
workers, and service providers who inspire us
every day with their bravery and selflessness.

“At NVIDIA, we closed our nearly 60 offices
around the world. We continue to pay
contractors their full wages despite reduced
staffing needs in our facilities. We gave
employees raises early to put a little more
money in their hands. Paying it forward,
our employees have donated more than
$10 million to help their communities.”

Jensen
2020 Annual Meeting of Stockholders

                                                 5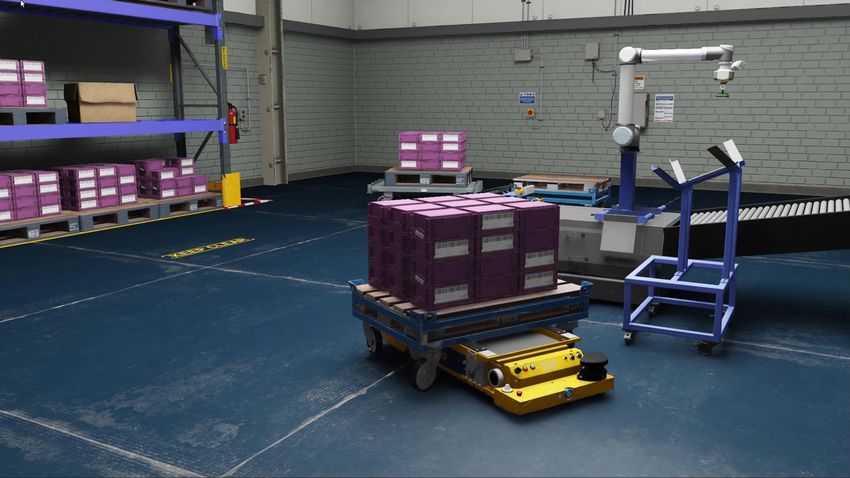
HIGHLIGHTS

Record Data Center revenue and exceptional strength in Gaming
    Total revenue up 50% y/y to $3.87B, ahead of outlook of $3.65B
    Data Center up 167% y/y to a record $1.75B; Gaming up 26% y/y to $1.65B
    Mellanox growth accelerated in its first quarter as part of NVIDIA; contributed 14% of total
    revenue

NVIDA computing adoption is accelerating
    Cumulative CUDA GPUs shipped reach 1 billion
    NVIDIA developers reach 2 million: took 10+ years to reach 1st million,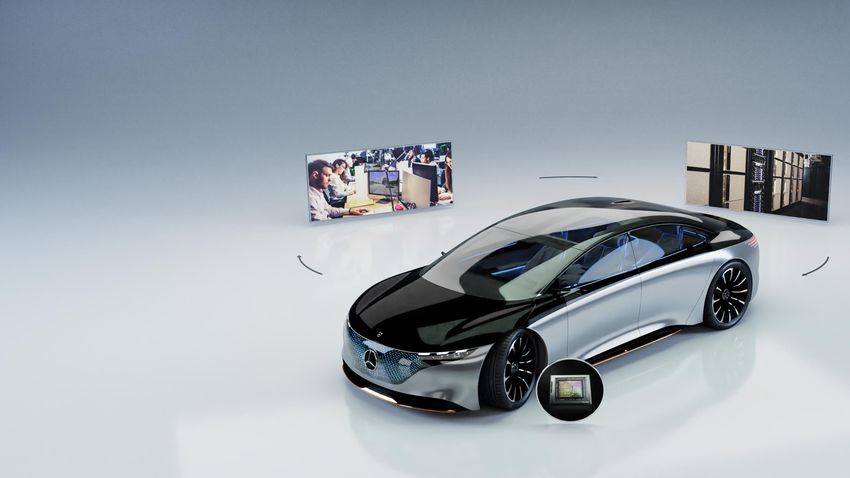
Q2 FY2021 FINANCIAL SUMMARY

4,000                                                    80.0%                                                GAAP                                  Non-GAAP
                                                $3,866

                                                                                               Q2 FY21         Y/Y           Q/Q          Q2 FY21     Y/Y       Q/Q
3,500                                                    75.0%

                          $3,105     $3,080                               Revenue              $3,866          +50%          +26%          $3,866     +50%      +26%
                 $3,014
3,000                                                    70.0%

                                                                        Gross Margin            58.8%        -100 bps      -630 bps        66.0%    +590 bps   +20 bps
        $2,579            65.4%      65.8%      66.0%
2,500            64.1%                                   65.0%
                                                                      Operating Income          $651           +14%          -33%          $1,516     +89%      +26%

        60.1%
2,000                                                    60.0%           Net Income             $622           +13%          -32%          $1,366     +79%      +22%

                                                                         Diluted EPS            $0.99          +10%          -33%          $2.18      +76%      +21%
1,500                                                    55.0%

        Q2FY20   Q3FY20   Q4FY20    Q1FY21      Q2FY21
                                                                     Cash Flow from Ops        $1,566          +67%          +72%          $1,566     +67%      +72%
                 Revenue(M)       Non-GAAP GM

                                                                 No difference between GAAP and Non-GAAP Cash Flow from Operations and Revenue

                                                                                                                                                                 7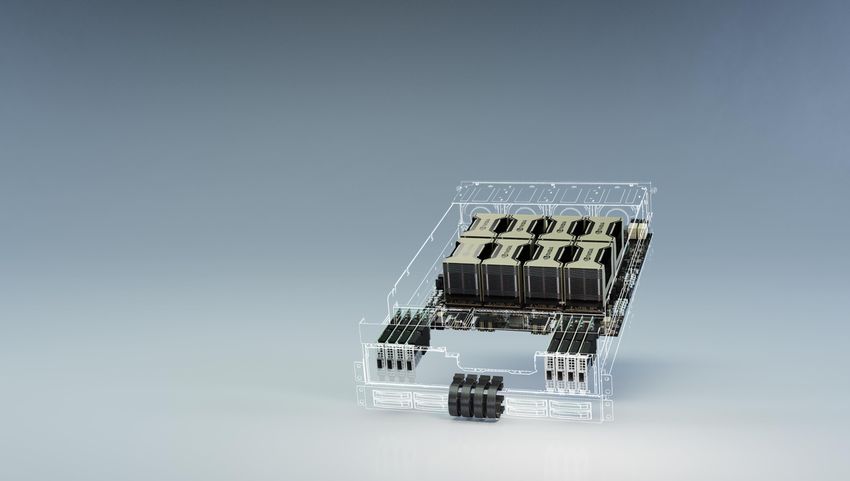
GAMING

                      Revenue ($M)                                          Highlights

                                                               Broad-based upside across regions,
                                                24% q/q and
                                                26% y/y
                                                               products, channels
$1,800

                  $1,659                     $1,654            After closing down at the outset of the
$1,600                                                         pandemic, stores and iCafes have largely
                           $1,491                              reopened and demand has picked up;
$1,400                              $1,339
                                                               online sales continue to thrive
         $1,313
                                                               Gaming’s growth amidst the pandemic
$1,200
                                                               highlights its emergence as a leading form
                                                               of entertainment worldwide
$1,000

                                                               Gaming laptop demand very strong;
 $800                                                          ramped 100+ new laptops from OEMs

 $600
                                                               NVIDIA’s GeForce NOW cloud gaming
         Q2FY20   Q3FY20   Q4FY20   Q1FY21   Q2FY21
                                                               service extends support to Chromebooks –
                                                               joining PCs, Macs and Android devices

                                                                                                            8
DATA CENTER

                      Revenue ($M)                                           Highlights
                                                54% q/q and
                                                167% y/y      Both compute and networking within Data
$1,800                                       $1,752           Center set a record, with accelerating
                                                              year-on-year growth
$1,600

                                                              We launched our new Ampere GPU
$1,400                                                        architecture – greatest generational leap

$1,200                              $1,141                    A100 has been widely adopted by all
                                                              major server vendors and cloud service
$1,000                      $968                              providers

 $800
                                                              NVIDIA set 16 records, sweeping all
                   $726                                       categories for commercially available
          $655
                                                              solutions in the latest MLPerf benchmark
 $600

                                                              The latest TOP500 list showed that 8 of
 $400
                                                              the world’s top 10 supercomputers use
         Q2FY20   Q3FY20   Q4FY20   Q1FY21   Q2FY21
                                                              NVIDIA GPUs and/or networking

                                                                                                          9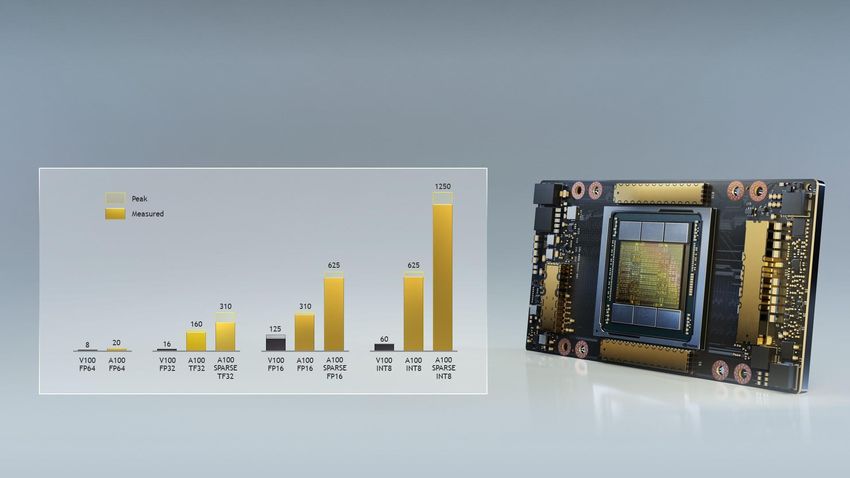
PROFESSIONAL VISUALIZATION

                    Revenue ($M)                                         Highlights

                                                            Sales were hurt by lower enterprise
                                                            demand amid the closure of many offices
$350
                 $324     $331                              around the world as a result of the
                                   $307                     pandemic
        $291
                                              34% q/q and
                                              30% y/y
                                                            Initiatives by enterprises to enable
                                                            remote workers drove demand for virtual
                                            $203            and cloud-based graphics solutions

                                                            vGPU bookings accelerated, increasing 60
                                                            percent year on year

                                                            Despite NT challenges, we are winning
                                                            new business in areas such as Healthcare -
                                                            including Siemens, Philips, and General
 $0
                                                            Electric - and the Public Sector
       Q2FY20   Q3FY20   Q4FY20   Q1FY21   Q2FY21

                                                                                                         10
AUTOMOTIVE
Revenue ($M) Highlights
$250
Impact of the pandemic was less
$209
pronounced than our outlook for a 40%
q/q decline, as auto production started to
recover after bottoming in April
$162 $163
$155
28% q/q and Announced a landmark partnership with
47% y/y Mercedes-Benz which, starting in 2024,
$111 will launch software-defined, intelligent
vehicles across its entire fleet, using end-
to-end NVIDIA technology
The Mercedes-Benz announcement is
transformative for NVIDIA’s evolving
business model as the software content of
our platforms grows, positioning us to
$0
Q2FY20 Q3FY20 Q4FY20 Q1FY21 Q2FY21
build a recurring revenue stream
11SOURCES & USES OF CASH
Cash Flow from Operations ($M) Highlights
$2,200
$2,000 Funded Mellanox acquisition with
72% q/q and approximately $7B in cash
$1,800 67% y/y
$1,640
$1,600
$1,566 Returned $99M to shareholders in the
$1,465
$1,400
form of dividends
$1,200 Invested $217M in capex
$1,000 $936 $909
Ended quarter with $11.0B in gross cash
$800 and $7.0B in debt, $4.0B of net cash
$600
$400
$200
$0 Gross cash is defined as cash/cash equivalents & marketable securities.
Debt is defined as principal value of debt.
Q2FY20 Q3FY20 Q4FY20 Q1FY21 Q2FY21 Net cash is defined as gross cash less debt.
12Q3 FY2021 OUTLOOK
Revenue – $4.40 billion, plus or minus two percent
We expect Gaming to be up just over 25 percent sequentially, with Data Center up in the low-to-mid-
single digits percent sequentially. We expect both Pro Vis and Auto to be at a similar level as in Q2.
Gross Margin – 62.5% GAAP and 65.5% non-GAAP, plus or minus 50 basis points
Operating Expense – Approximately $1.54 billion GAAP and $1.09 billion non-GAAP
Other Income & Expense – net expense of $55 million for both GAAP and non-GAAP
Tax Rate – GAAP and non-GAAP both eight percent, plus or minus one percent, excluding
discrete items
Capital Expenditure – approximately $225 to $250 million
13KEY ANNOUNCEMENTS
THIS QUARTER
14“NVIDIA-plus-Mellanox will remain at NVIDIA acquired industry-leading high-performance networking company
Mellanox in April 2020
the front of the pack developing
hardware technology that underpins New NVIDIA has a much larger scale in cloud data centers
the AI movement for some time.” Israel becomes major NVIDIA design center
MOTLEY FOOL
15ANNOUNCING NVIDIA A100
GREATEST GENERATIONAL LEAP — 20X VOLTA
54B xtors | 826mm2 | TSMC 7N | 40GB Samsung HBM2 | 3rd gen Tensor Core GPU | 600 GB/s NVLink
16ANNOUNCING
NVIDIA A100 LIGHTHOUSE
CUSTOMERS
Elastic Data Center Accelerator Choice of
Industry Leaders
CLOUD
SYSTEMSNVIDIA AMPERE GPUS COME TO GOOGLE CLOUD A100 has come to the cloud faster than any NVIDIA GPU in history A100 boosts training and inference computing performance by 20x over its predecessors and can power a broad range of compute-intensive applications, including AI training and inference, data analytics, scientific computing, genomics, edge video analytics, 5G services, and more Google’s Accelerator-Optimized VM (A2) provides breakthrough performance for every size workload
NVIDIA ACCELERATES WORLD’S FASTEST SUPERCOMPUTERS
              Highlights from International Supercomputing Conference June 2020

8 of world’s 10 fastest supercomputers run NVIDIA GPUs, networking, or both (TOP500.org), including the #1 system
in the US and Europe

NVIDIA’s Selene debuts as fastest industrial supercomputer in the US, and #7 on the TOP500 list overall, the only
top 100 system to crack the 20 gigaflops/watt barrier

Systems using NVIDIA GPUs are pulling away from the pack: they’re nearly 3x more power-efficient than systems
without NVIDIA GPUs, measured in gigaflops/watt

                     NVIDIA Accelerates Majority of                        NVIDIA GPU Systems are
                            Top500 Systems                                    3x More Efficient
               350                                                     7
               300                                                     6
               250                                                     5

                                                                GF/W
               200                                                     4
               150                                                     3
               100                                                     2
                50                                                     1
                 0                                                     0
                     ISC17         ISC18     ISC19                         ISC17       ISC18    ISC19
                     NVIDIA GPUs      Mellanox Networking                  non-NVIDIA Average   NVIDIA Average   19
SELENE
DGX SuperPOD Deployment
#1 on MLPerf for commercially available systems
#7 on TOP500 (27.6 PetaFLOPS HPL)
#2 on Green500 (20.5 GigaFLOPS/watt)
Fastest Industrial System in U.S. — 1+ ExaFLOPS AI
Built w/ NVIDIA DGX SuperPOD Arch in 3 Weeks
NVIDIA DGX A100 and NVIDIA Mellanox IB
NVIDIA’s decade of AI experience
Configuration:
2,240 NVIDIA A100 Tensor Core GPUs
280 NVIDIA DGX A100 systems
494 Mellanox 200G HDR IB switches
7 PB of all-flash storage
20NVIDIA WINS BENCHMARK FOR AI TRAINING
Sets 16 Records in MLPerf July 2020
What is MLPerf? MLPerf July 2020 – AI Training
The industry’s first and only objective NVIDIA set 16 records, sweeping all
standard for measuring machine learning categories for commercially available
performance solutions
Consortium of over 70 universities and NVIDIA was the only company to field
companies, including Google, Intel, Baidu commercially available products for all
and NVIDIA, founded in 2018 the tests
NVIDIA won all prior MLPerf benchmarks, NVIDIA won all 8 categories for both “at
including for training in Dec. 2018 and scale” (with DGX SuperPOD) and “per
July 2019, and for inference Nov. 2019 chip” (with A100) performance
21NVIDIA DGX SUPERPOD SETS ALL 8 AT SCALE AI
RECORDS
Under 18 Minutes To Train Each MLPerf Benchmark
Time to Train (Lower is Better)
0.6 (480 A100) NVIDIA A100
Commercially Available Solutions
Translation (Non-recurrent) Transformer
XX
NVIDIA V100
0.7 (1024 A100)
Google TPUv3
Translation (Recurrent) GNMT
XX
Huawei Ascend
0.8 (1840 A100)
Image Classification ResNet-50 v.1.5
28.7 (16 TPUv3)
0.8 (1024 A100)
Object Detection (Light Weight) SSD
XX
56.7
0.8 (2048 A100)
(16 TPUv3)
NLP BERT
X
3.3 (8 A100)
Recommendation DLRM
XX
10.5 (256 A100)
Object Detection (Heavy Weight) Mask R-CNN
XX
17.1 (1792 A100)
Reinforcement Learning MiniGo
XX
0 5 10 15 20 25 30 35 40
Time to Train (Minutes)
X = No result submitted
MLPerf 0.7 Performance comparison at Max Scale. Max scale used for NVIDIA A100, NVIDIA V100, TPUv3 and Huawei Ascend for all applicable benchmarks. | MLPerf ID at Scale: :Transformer: 0.7-30, 0.7-52 , GNMT: 0.7-34, 0.7-54, ResNet-50 v1.5:220.7-37, 0.7-55,
0.7-1, 0.7-3, SSD: 0.7-33, 0.7-53, BERT: 0.7-38, 0.7-56, 0.7-1, DLRM: 0.7-17, 0.7-43, Mask R-CNN: 0.7-28, 0.7-48, MiniGo: 0.7-36, 0.7-51 | MLPerf name and logo are trademarks. See www.mlperf.org for more information.NVIDIA A100 SETS ALL 8 PER CHIP AI PERFORMANCE
RECORDS
Relative Speedup
3x Commercially Available Solutions
2.5X
2.4X 2.4X
2.0X 2.0X
2x 1.9X
Speedup Over V100
1.6X
1.5X
1.2X
1.0X 1.0X 1.0X 1.0X 1.0X 1.0X 1.0X 1.0X
1x 0.9X
0.7X
X X X X X XX XX X X X X
0x
Image Classification NLP Object Detection (Heavy Reinforcement Learning Object Detection (Light Translation (Recurrent) Translation Recommendation
ResNet-50 v.1.5 BERT Weight) MiniGo Weight) GNMT (Non-recurrent) DLRM
Mask R-CNN SSD Transformer
X = No result submitted
Huawei Ascend TPUv3 V100 A100
Per Chip Performance arrived at by comparing performance at same scale when possible and normalizing it to a single chip. 8 chip scale: V100, A100 Mask R-CNN, MiniGo, SSD, GNMT, Transformer. 16 chip scale: V100, A100, TPUv3 for ResNet-50 v1.5 and BERT. 512
23
chip scale: Huawei Ascend 910 for ResNet-50. DLRM compared 8 A100 and 16 V100. Submission IDs: ResNet-50 v1.5: 0.7-3, 0.7-1, 0.7-44, 0.7-18, 0.7-21, 0.7-15 BERT: 0.7-1, 0.7-45, 0.7-22 , Mask R-CNN: 0.7-40, 0.7-19, MiniGo: 0.7-41, 0.7-20, SSD: 0.7-40, 0.7-19,
GNMT: 0.7-40, 0.7-19, Transformer: 0.7-40, 0.7-19, DLRM: 0.7-43, 0.7-17| MLPerf name and logo are trademarks. See www.mlperf.org for more information.GPU-ACCELERATED APACHE SPARK 3.0
Built on Foundations of RAPIDS
NVIDIA accelerates Spark, the world’s leading
data analytics platform used by more than 500k Spark 3.0
data scientists and 16k enterprises worldwide
Data Preparation Model Training
Makes end-to-end acceleration of the entire
data science workload possible for the first Spark
XGBoost | TensorFlow |
PyTorch
time, unlocking new markets
RAPIDS Accelerator for Apache Spark
The performance gains in Spark 3.0 enable data Data GPU Powered Cluster
scientists to train models with larger datasets Sources
and retrain models more frequently, enhancing Spark Orchestrated
model accuracy
Using NVIDIA-accelerated Spark 3.0, Adobe
achieved a 7x performance improvement and
90% cost savings Now Available on Leading Cloud Analytics Platforms
24MERCEDES-BENZ & NVIDIA TO JOIN FORCES FOR SOFTWARE-DEFINED
VEHICLES ACROSS NEXT-GEN FLEET
Software-Defined, Upgradeable Computing Architecture
▪ High-end NVIDIA DRIVE AGX Orin platform (200
TOPS) and sensors standard in every next-gen
vehicle
▪ Complete NVIDIA DRIVE Software stack
▪ Full address-to-address autopilot, valet parking
and more future applications still to be imagined
Backed by Teams of AI and Software Engineers
▪ Perpetually upgradeable machine receives
continuous improvement through OTA for Mercedes-
Benz vehicles
▪ New safety and convenience features continually
roll out across future Mercedes-Benz fleet
Unlocks New Disruptive Business Models
▪ Customers to purchase features and services at POS “ MERCEDES-BENZ AND NVIDIA
and throughout Mercedes-Benz vehicles' life cycle SIGN A DEAL TO MAKE CARS
▪ Mercedes-Benz customer joy and value increase MORE LIKE IPHONES”
throughout vehicle’ life cycle
BARRON’S
25BMW SELECTS NVIDIA ISAAC
PLATFORM TO REDEFINE
FACTORY LOGISTICS
BMW Group announced it is redefining factory
logistics with NVIDIA’s Isaac robotics platform
Isaac SDK provides a comprehensive set of
tools, libraries, reference robot applications,
pre-trained DNN algorithms and transfer
learning toolkit to adapt the deep neural
networks to different robots
Robot fleets powered by Isaac on NVIDIA EGX
will automate manufacturing
26NVIDIA OVERVIEW
27NVIDIA — A COMPUTING PLATFORM COMPANY
Headquarters: Santa Clara, CA
Headcount: 17,500
NVIDIA pioneered accelerated computing to help solve the most challenging computational problems. The approach is broadly recognized as
the way to advance computing as Moore’s law ends and AI lifts off. NVIDIA’s platform is installed in several hundred million computers, is
available in every cloud and from every server maker, powers 333 of the TOP500 supercomputers, and boasts 2 million developers.
28NVIDIA AT A GLANCE
Accelerated Computing Pioneer
Brief History Revenue by Market Platform
1993: Founded by Jensen Huang, Chris Malachowsky, and Curtis Priem $11.7B $6.9B
$10.9B Gaming
1999: IPO on NASDAQ at $12 (prior to 4 stock splits, now 12:1) $9.7B
$4.8B Data Center
2001: Xbox win; fastest semiconductor company to reach $1B in sales $6.9B
$5.0B ProViz
2006: Unveils CUDA architecture, expanding to scientific computing
2009: Inaugural GPU Technology Conference (GTC) Auto
2016: Introduces first products for AI and autonomous driving FY16 FY17 FY18 FY19 FY20 OEM/IP
F1H20 F1H21
Recognitions From Chip Vendor to Computing Platform
Health- Smart
GAMING HPC
Harvard Business Review’s The CEO 100 care City/IOT
Trans-
PRO VIZ AI Robotics
Fortune’s Best Places to Work CUDA-X
portation
CUDA
MIT Tech Review’s 50 Smartest Companies
Fortune’s World’s Most Admired Companies ARCHITECTURE SYSTEMS DATA CENTER
Forbes JUST 100 Best Corporate Citizens 1999 2014 F1H21
GM 30%+ GM 50%+ GM 60%+
Dow Jones Sustainability Index
29GROWTH DRIVERS
Gaming AI AR/VR Self-driving Cars
30OUR CORE BUSINESSES
FY20 Revenue $5.52B, FY20 Revenue of $2.98B, FY20 Revenue of $1.21B, FY20 Revenue of $700M,
3-year CAGR of 11% 3-year CAGR of 53% 3-year CAGR of 13% 3-year CAGR of 13%
Strong market position and Leader in deep learning/AI – 90%+ market share in Current revenue driven
technology leadership used by all major cloud graphics for workstations largely by infotainment
computing providers and
Compounded long-term unit thousands of enterprises Diversified end markets, Future growth expected to
and ASP growth e.g. media & entertainment, be driven largely by
Leader in HPC - in 8 of the architecture, engineering & Autonomous Vehicle (AV)
200M+ gamers on our top 10 and 2/3rds of the top construction, public sector solution offering full
platform 500 fastest supercomputers hardware & software stack
Strong software ecosystem
Strong Gaming ecosystem Multiple secular growth Large secular growth
drivers: fast growing Multiple secular growth opportunity: autonomous
Multiple secular growth drivers: expanding creative
drivers: expanding population adoption of AI in every major vehicles estimated to drive
industry; rising compute & design workflows, mobile a $25B TAM for the AV
of gamers, eSports, VR, rising workstations, rising adoption
production value of games, needs unmet by conventional computing stack by 2025
approaches such as x86 of AR/VR across industries
gaming and prosumer laptops
CPUs; Mellanox networking
Gaming Data Center Professional Visualization Automotive
51% of FY20 Rev 27% of FY20 Rev 11% of FY20 Rev 6% of FY20 Rev
ASP = Average Selling Price. Gamers are defined as consumers who purchase our GPUs to play video games. 200M+ gamers on our platform as of August 2020. FY20 ended 1/26/2020. 31STRONG, PROFITABLE GROWTH
F1H16 F1H21 Revenue Gross Margin Operating Margin Revenue Gross Margin Operating Margin
12,000 80% 8,000 85%
17 4 4
7 7,000
10,000 70%
6 62% 63% 6,000 70%
43 59% 60% 66%
8,000 57% 60%
54 5,000 60%
15
6,000 50% 4,000 55%
42
7
38% 3,000
4,000 37% 40%
34% 39%
32% 2,000 40%
Gaming Gaming
Data Center 2,000 30%
Data Center 1,000
22% 28%
ProViz ProViz
Auto Auto 0 20% 0 25%
OEM / IP OEM / IP FY16 FY17 FY18 FY19 FY20 F1H20 F1H21
Business Mix (%) Sustained Profitability
(showing non-GAAP margins)
Refer to Appendix for reconciliation of Non-GAAP measures
32WHY ACCELERATED COMPUTING?
Advancing Computing in the Post-Moore’s Law Era
The world’s demand for computing power 107
continues to grow exponentially, yet CPUs are
no longer keeping up as Moore’s Law has ended.
GPU PERFORMANCE
NVIDIA pioneered GPU-accelerated computing 105
to solve this challenge.
Optimizing across the entire stack — from silicon CPU PERFORMANCE
to software — allows NVIDIA to advance computing
in the post-Moore’s Law era for large and 103
important markets:
Gaming, Pro Viz, High Performance Computing
(HPC), AI, Cloud, Transportation, Healthcare,
Robotics, and the Internet of Things (IOT).
1980 1990 2000 2010 2020
33WORLD LEADER IN ACCELERATED COMPUTING
Our Four Market Platforms & Key Brands
Gaming Data Center Professional Visualization Auto
GeForce GPUs for PC Gamers DGX/HGX/EGX for HPC/AI compute Quadro for Workstations DRIVE for Autonomous Vehicles
Mellanox for networking
34GAMING
GeForce - The World’s Largest Gaming Platform
$6,246
#1 in PC gaming with more
18% CAGR
$5,513 $5,518
than 3X the revenue of the
other major GPU vendor
$4,060
Expanding the market with
$2,818 gaming laptops and cloud
gaming
Powering the Nintendo
Switch console
FY16 FY17 FY18 FY19 FY20
Revenue ($M) Highlights 200M+ Gamers on GeForce
35DATA CENTER
High Performance Computing (HPC) and AI
NVIDIA Share of New Top
2.0M 500 Systems
$2,932 $2,983
72%
CAGR
1.5M
67%
$1,932
41%
1M
34%
24%
$830 500K
6%
$339
SC16 SC17 SC18 SC19 SC20
0
FY16 FY17 FY18 FY19 FY20 2005 2010 2015 2020 In 8 of top 10 Supercomputers
Worldwide; #1 in US and Europe
SC20 Results Include MLNX
Revenue ($M) Registered NVIDIA Developers Every Major Cloud Provider 90%+ Share of Accelerators
in Supercomputing
36PROFESSIONAL VISUALIZATION
Workstation Graphics
Accelerated AR/VR Data
$1,212 Rendering Science
13% CAGR
$1,130 Virtual
Simulation
and Sci Viz Workstations
$934 Foundry
$835
$750
Remington
FY16 FY17 FY18 FY19 FY20
Revenue ($M) 50+ Applications 40M Designers and Creatives
Unlocking New Markets
37AUTO
Infotainment and Autonomous Vehicles
80 76
$700 TOYOTA MERCEDES-BENZ
22% CAGR 70
$641
$558 60
$487 50
42
VOLVO
40
$320 33
30 26 24
20 15
DIDI ZF
10 7
0
Robo
FY16 FY17 FY18 FY19 FY20 Cars Trucks Tier 1s taxis Mapping Sensors Software
XPENG
Revenue ($M) NVIDIA DRIVE Partners Strong Partnership / Ecosystem
38LARGE AND DIVERSE CUSTOMER BASE
Reaching Hundreds of Millions of End Users Through Hundreds of Customers
Reaching 200M+ PC gamers Cloud
40M Designers/Creatives
Every Major PC OEM/ODM HPC
ORNL LLNL Piz
ABCI
Summit Sierra Daint
Every Major Graphics Card Vertical Industry
Manufacturer
20M Enterprise Users
Gaming Data Center Pro Visualization Auto
Largest Customer 11% of Total Revenue Over Past 3 Fiscal Years
39FINANCIALS
40ANNUAL REVENUE BY MARKET PLATFORM
Gaming Data Center
$2,932 $2,983
$6,246
$5,513 $5,518
$mm
$mm
$4,060 $1,932
$2,818
$830
$339
FY16
FY2016 FY17
FY2017 FY18
FY2018 FY19
FY2019 FY20
FY2020 FY16
FY2016 FY17
FY2017 FY18
FY2018 FY19
FY2019 FY20
FY2020
Pro Visualization Auto
$1,212 $700
$1,130
$641
$934 $558
$835 $487
$750
$mm
$mm
$320
FY2016
FY16 FY2017
FY17 FY2018
FY18 FY2019
FY19 FY2020
FY20 FY16
FY2016
FY2016 FY17
FY2017 FY18
FY2018 FY19
FY2019 FY20
FY2020
41ANNUAL CASH & CASH FLOW METRICS
ADJUSTED EBITDA (NON-GAAP) OPERATING CASH FLOW
$4,662 $4,761
$4,110
$3,803 $3,743
$3,502
$2,392
$mm
$mm
$1,672
$1,305 $1,175
FY2016
FY16 FY2017
FY17 FY2018
FY18 FY2019
FY19 FY2020
FY20 FY2016
FY16 FY2017
FY17 FY2018
FY18 FY2019
FY19 FY2020
FY20
FREE CASH FLOW CASH BALANCE
$4,272 $10,897
$2,909 $3,143
$7,108 $7,422
$6,798
$mm
$mm
$5,037
$1,496
$1,089
FY16 FY17 FY18 FY19 FY20 FY2016
FY16 FY2017
FY17 FY2018
FY18 FY2019
FY19 FY2020
FY20
Cash balance is defined as cash and cash equivalents plus marketable securities
42CONSERVATIVE FINANCIAL POLICY
Key Credit Metrics Financial Policy Highlights Historical Debt / Adjusted EBITDA
FY20
1.4
Commitment to maintain our
Revenue $10.92B
historically modest leverage, 1.2
Adjusted EBITDA $4.11B consistent with investment grade
1
credit ratings
Free Cash Flow $4.27B 0.8
Disciplined capital return policy
Cash & Cash Equivalents and 0.6
$10.90B
Marketable Securities
Solid balance sheet with 0.4
Principal Value of Debt $2.00B substantial liquidity, and positive
0.2
net cash position
Net Cash $8.90B 0
Disciplined approach to M&A FY16 FY17 FY18 FY19 FY20
Principal Value of Debt / Adjusted EBITDA 0.5x
Source: SEC filings and public disclosures
1 Adjusted EBITDA and Free Cash Flow are Non-GAAP measures. Refer to Appendix for reconciliation of Non-GAAP measures
2 Net Cash is defined as Cash & Cash Equivalents and Marketable Securities less principal value of debt
43NVIDIA’S COMMITMENT TO ESG
Creating a Leading Workplace Tackling Climate Change
NVIDIA GPUs are 20 to 25 times
more energy efficient than
traditional CPU servers for AI
workloads.
44“NVIDIA GPUs POWER SIX OUT OF THE
TEN MOST ENERGY-EFFICIENT
MACHINES ON THE TOP500”
HPCWIRE
Accelerated computing is the way forward for
powerful & efficient supercomputers
NVIDIA GPUs and/or InfiniBand power 8 of top
10 systems on latest TOP500 list
Fastest systems in U.S., Europe & China
45RECONCILIATION OF NON-GAAP
TO GAAP FINANCIAL MEASURES
46RECONCILIATION OF NON-GAAP TO GAAP FINANCIAL
MEASURES
AMORTIZATION OF
NON-GAAP
GAAP DEPRECIATION ACQUISITION-
($ IN MILLIONS) OPERATING INCOME ADJUSTED EBITDA
& AMORTIZATION RELATED
(A)
INTANGIBLES
FY 2016 $1,125 197 (17) $1,305
FY 2017 $2,221 187 (16) $2,392
FY 2018 $3,617 199 (13) $3,803
FY 2019 $4,407 262 (7) $4,662
FY 2020 $3,735 381 (6) $4,110
A. Refer to Appendix herein for reconciliation of Non-GAAP operating income to GAAP operating income
47RECONCILIATION OF NON-GAAP TO GAAP FINANCIAL
MEASURES (CONTD.)
ACQUISITION-
NON-GAAP STOCK-BASED PRODUCT GAAP
($ IN RELATED AND OTHER
OPERATING COMPENSATION WARRANTY OPERATING
MILLIONS) OTHER COSTS (D)
INCOME (A) (B) INCOME
(C)
FY 2016 $1,125 (205) (20) (22) (131) $747
FY 2017 $2,221 (248) — (16) (23) $1,934
FY 2018 $3,617 (391) — (13) (3) $3,210
FY 2019 $4,407 (557) — (2) (44) $3,804
FY 2020 $3,735 (844) — (30) (15) $2,846
A. Stock-based compensation charge was allocated to cost of goods sold, research and development expense, and sales, general and administrative expense
B. Consists of warranty charge associated with a product recall
C. Consists of amortization of acquisition-related intangible assets, transaction costs, compensation charges, other credits related to acquisitions, and other costs
D. Comprises of legal settlement costs, contributions, and restructuring and other charges
48RECONCILIATION OF NON-GAAP TO GAAP FINANCIAL
MEASURES (CONTD.)
NON-GAAP STOCK-BASED ACQUISITION- GAAP
OTHER
OPERATING COMPENSATION RELATED AND OPERATING
(C)
INCOME (A) OTHER COSTS (B) INCOME
1H FY20 $1,358 (401) (15) (13) $929
1H FY21 $2,721 (598) (479) (17) $1,627
A. Stock-based compensation charge was allocated to cost of goods sold, research and development expense, and sales, general and administrative expense
B. Consists of amortization of intangible assets, inventory step-up, transaction costs, and certain compensation charges
C. Comprises of legal settlement costs
49RECONCILIATION OF NON-GAAP TO GAAP FINANCIAL
MEASURES (CONTD.)
ACQUISITION-
STOCK-BASED
RELATED ITEMS OTHER TAX IMPACT OF
($ IN MILLIONS) NON-GAAP COMPENSATION GAAP
AND OTHER (C) ADJUSTMENTS
(A)
COSTS (B)
Q2 FY2021
Revenue $3,866 — — — — $3,866
Gross profit $2,551 (14) (245) (17) — $2,275
Gross margin 66.0% (0.4) (6.3) (0.5) — 58.8%
Research and development expense $766 228 3 — — $997
Sales, general and administrative
$269 132 226 — — $627
expense
Operating expense $1,035 360 229 — — $1,624
Operating income $1,516 (374) (474) (17) — $651
Net income $1,366 (374) (474) (20) 124 $622
Diluted EPS $2.18 (0.60) (0.76) (0.03) 0.20 $0.99
A. Stock-based compensation charge was allocated to cost of goods sold, research and development expense, and sales, general and administrative expense
B. Primarily consists of amortization of intangible assets, inventory step-up, transaction costs, and certain compensation charges
50
C. Comprises of legal settlement costs, losses from non-affiliated investments, and interest expense related to amortization of debt discountRECONCILIATION OF NON-GAAP TO GAAP FINANCIAL
MEASURES (CONTD.)
STOCK-BASED
NON-GAAP GROSS PRODUCT OTHER GAAP GROSS
COMPENSATION
MARGIN WARRANTY (B) (C) MARGIN
(A)
FY 2016 56.8% (0.3) (0.4) — 56.1%
FY 2017 59.2% (0.2) — (0.2) 58.8%
FY 2018 60.2% (0.3) — — 59.9%
FY 2019 61.7% (0.2) — (0.3) 61.2%
FY 2020 62.5% (0.4) — (0.1) 62.0%
A. Stock-based compensation charge was allocated to cost of goods sold
B. Consists of warranty charge associated with a product recall
C. Consists of legal settlement costs
51RECONCILIATION OF NON-GAAP TO GAAP FINANCIAL
MEASURES (CONTD.)
ACQUISITION-
STOCK-BASED
NON-GAAP RELATED ITEMS OTHER GAAP GROSS
COMPENSATION
GROSS MARGIN AND OTHER (C) MARGIN
(A)
COSTS (B)
Q2 FY2020 60.1% (0.3) — — 59.8%
Q3 FY2020 64.1% (0.5) — — 63.6%
Q4 FY2020 65.4% (0.4) — (0.1) 64.9%
Q1 FY2021 65.8% (0.7) — — 65.1%
Q2 FY2021 66.0% (0.4) (6.3) (0.5) 58.8%
A. Stock-based compensation charge was allocated to cost of goods sold
B. Consists of amortization of intangible assets and inventory step-up
C. Consists of legal settlement costs
52RECONCILIATION OF NON-GAAP TO GAAP FINANCIAL
MEASURES (CONTD.)
ACQUISITION-
STOCK-BASED
NON-GAAP RELATED ITEMS OTHER GAAP GROSS
COMPENSATION
GROSS MARGIN AND OTHER (C) MARGIN
(A)
COSTS (B)
1H FY20 59.6% (0.3) — (0.2) 59.1%
1H FY21 65.9% (0.5) (3.5) (0.3) 61.6%
A. Stock-based compensation charge was allocated to cost of goods sold
B. Consists of amortization of intangible assets and inventory step-up
C. Consists of legal settlement costs
53RECONCILIATION OF NON-GAAP TO GAAP FINANCIAL
MEASURES (CONTD.)
ACQUISITION-
NON-GAAP STOCK-BASED PRODUCT GAAP
RELATED AND OTHER
OPERATING COMPENSATION WARRANTY OPERATING
OTHER COSTS (D)
MARGIN (A) (B) MARGIN
(C)
FY 2016 22.5% (4.2) (0.4) (0.4) (2.6) 14.9%
FY 2017 32.1% (3.6) — (0.2) (0.3) 28.0%
FY 2018 37.2% (4.0) — (0.2) — 33.0%
FY 2019 37.6% (4.7) — — (0.4) 32.5%
FY 2020 34.2% (7.7) — (0.3) (0.1) 26.1%
A. Stock-based compensation charge was allocated to cost of goods sold, research and development expense, and sales, general and administrative expense
B. Consists of warranty charge associated with a product recall
C. Consists of amortization of acquisition-related intangible assets, transaction costs, compensation charges, other credits related to acquisitions, and other costs
D. Comprises of legal settlement costs, contributions, and restructuring and other charges
54RECONCILIATION OF NON-GAAP TO GAAP FINANCIAL
MEASURES (CONTD.)
NON-GAAP STOCK-BASED ACQUISITION- GAAP
OTHER
OPERATING COMPENSATION RELATED AND OPERATING
(C)
MARGIN (A) OTHER COSTS (B) MARGIN
1H FY20 28.3% (8.3) (0.3) (0.3) 19.4%
1H FY21 39.2% (8.6) (6.9) (0.3) 23.4%
A. Stock-based compensation charge was allocated to cost of goods sold, research and development expense, and sales, general and administrative expense
B. Consists of amortization of intangible assets, inventory step-up, transaction costs, and certain compensation charges
C. Comprises of legal settlement costs
55RECONCILIATION OF NON-GAAP TO GAAP FINANCIAL
MEASURES (CONTD.)
PURCHASES OF PROPERTY
NET CASH PROVIDED BY
($ IN MILLIONS) AND EQUIPMENT AND FREE CASH FLOW
OPERATING ACTIVITIES
INTANGIBLE ASSETS
FY 2016 $1,175 (86) $1,089
FY 2017 $1,672 (176) $1,496
FY 2018 $3,502 (593) $2,909
FY 2019 $3,743 (600) $3,143
FY 2020 $4,761 (489) $4,272
56RECONCILIATION OF GAAP TO NON-GAAP OUTLOOK
Q3 FY2021
($ in millions)
Outlook
GAAP gross margin 62.5%
Impact of stock-based compensation expense, acquisition-related costs, and other costs 3.0%
Non-GAAP gross margin 65.5%
GAAP operating expenses $1,535
Stock-based compensation expense, acquisition-related costs, and other costs (445)
Non-GAAP operating expenses $1,090
57You can also read