Q4/FY 2016 INVESTOR PRESENTATION - as of February 28, 2017
←
→
Page content transcription
If your browser does not render page correctly, please read the page content below
Q4/FY 2016 INVESTOR PRESENTATION
          as of February 28, 2017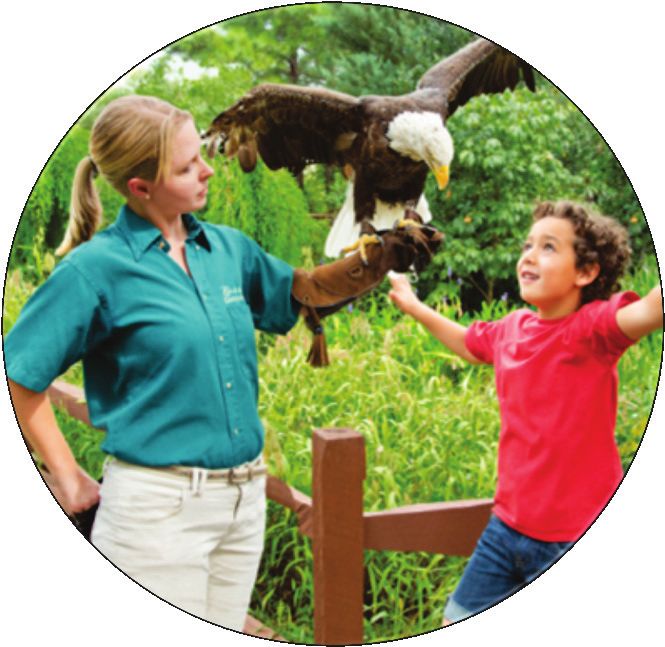
Disclosures

Statement Regarding Forward-Looking Statements
This presentation contains “forward-looking statements” within the meaning of U.S. federal securities laws. All statements contained in this presentation other than statements of historical facts are forward-
looking statements. Words such as “might,” “will,” “may,” “should,” “estimates,” “expects,” “continues,” “contemplates,” “anticipates,” “projects,” “plans,” “potential,” “predicts,” “intends,” “believes,”
“forecasts,” “future”, “guidance” , “targeted” and variations of such words or similar expressions are intended to identify forward-looking statements.
Forward-looking statements are not historical facts, and are based upon management’s current expectations, beliefs, estimates and projections, and various assumptions, many of which are inherently uncertain
and beyond our control. Such expectations, beliefs, estimates and projections are expressed in good faith and management believes there is a reasonable basis for them. However, there can be no assurance that
management’s expectations, beliefs, estimates and projections will be achieved and actual results may differ materially from what is expressed in or indicated by the forward-looking statements. Forward-
looking statements are subject to risks and uncertainties that could cause actual performance or results to differ materially from those expressed in the forward-looking statements, including risks detailed in
SeaWorld Entertainment, Inc.’s (“SeaWorld” or the “company”) 2016 Annual Report on Form 10-K as filed with the U.S. Securities and Exchange Commission (the “SEC”), as such risk factors may be updated
from time to time in our periodic filings with the SEC. Forward-looking statements speak only as of the date the statements are made. The company assumes no obligation to update forward-looking statements
to reflect actual results, subsequent events or circumstances or other changes affecting forward-looking information except to the extent required by applicable securities laws.
Statement Regarding Non-GAAP Financial Measures
This presentation includes several metrics which are not calculated in accordance with the generally accepted accounting principles in the United States (“GAAP”), including Adjusted EBITDA and Free Cash
Flow. These metrics have important limitations and should not be considered in isolation or as a substitute for measures of a company’s financial performance or liquidity prepared in accordance with GAAP. In
addition, these metrics, as presented, may not be comparable to similarly titled measures of other companies due to varying methods of calculations.
Adjusted EBITDA is defined as net income (loss) before income tax expense, interest expense, depreciation and amortization, as further adjusted to exclude certain non-cash, and other items permitted in
calculating covenant compliance under the credit agreement governing the company’s Senior Secured Credit Facilities. Management believes the presentation of Adjusted EBITDA is appropriate as it eliminates
the effect of certain non-cash and other items not necessarily indicative of the company’s underlying operating performance. Management uses Adjusted EBITDA in connection with certain components of its
executive compensation program. In addition, investors, lenders, financial analysts and rating agencies have historically used EBITDA-related measures in the company’s industry, along with other measures to
estimate the value of a company, to make informed investment decisions and to evaluate a company’s ability to meet its debt service requirement. The presentation of Adjusted EBITDA also provides additional
information to investors about the calculation of, and compliance with, certain financial covenants in the company’s Senior Secured Credit Facilities. Adjusted EBITDA is a material component of these
covenants.
Free Cash Flow is defined as net cash provided by (used in) operating activities less capital expenditures. Management believes that Free Cash Flow is useful to investors, equity analysts and rating agencies as a
liquidity measure. The company uses Free Cash Flow to evaluate its ability to generate cash flow from business operations. Free Cash Flow does not represent the residual cash flow available for discretionary
expenditures, as it excludes certain expenditures such as mandatory debt service requirements, which are significant. Free Cash Flow is not defined by GAAP and should not be considered in isolation or as an
alternative to net cash provided by (used in) operating, investing and financing activities or other financial data prepared in accordance with GAAP. Free Cash Flow as defined above may differ from similarly
titled measures presented by other companies. Prior to the second quarter of 2016, the company’s definition of Free Cash Flow differed from the above. The company changed the definition of Free Cash Flow
to provide a more meaningful metric to investors. Prior year amounts have been calculated using the above definition in all periods presented. For a reconciliation of Adjusted EBITDA to net income (loss) and
Free Cash Flow to net cash provided by (used in) operating activities, please refer to the Appendix in this presentation or our Quarterly Earnings Release, which can be found at our website
www.seaworldentertainment.com.
Statement Regarding Use of Registered Trademarks
The company owns or has rights to use a number of registered and common law trademarks, service marks and trade names in connection with its business in the United States and in certain foreign
jurisdictions, including SeaWorld Entertainment, SeaWorld Parks & Entertainment, SeaWorld®, Busch Gardens®, Aquatica®, Discovery Cove®, Sea Rescue®, and other names and marks that identify our theme
parks, characters, rides, attractions and other businesses. In addition, the company has certain rights to use Sesame Street® marks, characters and related indicia through certain license agreements with Sesame
Workshop (f/k/a Children’s Television Workshop).
Solely for convenience, trademarks, service marks and trade names referred to in this presentation may be without the ® and ™ symbols, but such references are not intended to indicate, in any way, that the
company will not assert, to the fullest extent under applicable law, its rights or the rights of the applicable licensors to these trademarks, service marks, and trade names.

                                                                                                                                                                                                                       2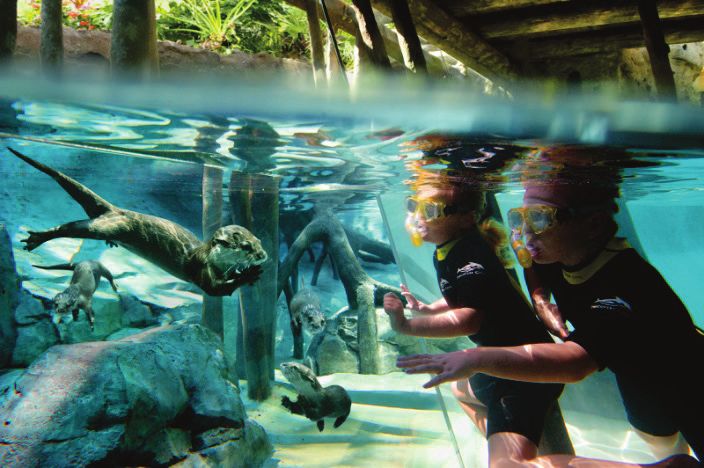
COMPANY OVERVIEW
A Unique Theme Park and Entertainment Company

                 Providing experiences
                    that matter and
                  inspiring guests to
                protect animals and the
                  wild wonders of our
                         world

                                                4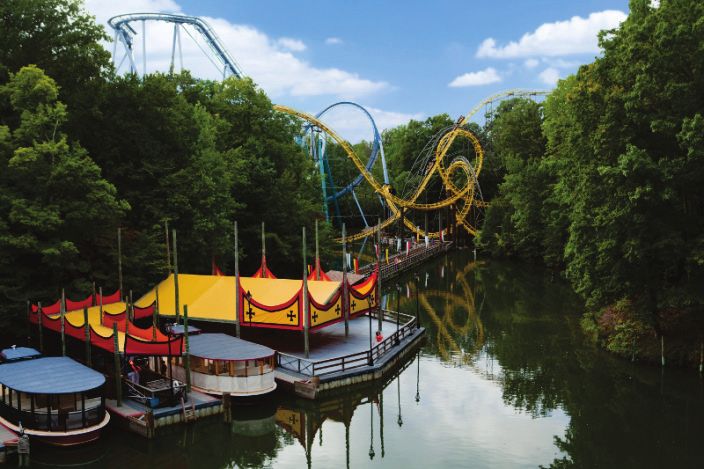
Who We Are
• 12 parks in 5 states, with park
  clusters in 5 of 6 markets

• Over 63M people located within
  150 miles of our parks1

• 4 of the top 20 theme parks by
  attendance in North America2

• 3 of the top 10 water parks by
  attendance in North America2

• More than 600 rides and
  attractions1

• One of the largest zoological
  collections in the world

• Approximately 2,000 acres of
  owned land, with nearly 400 acres
  available for future development3

• 2016 Revenue: $1,344M

• 2016 Adjusted EBITDA: $332M
            1 As of December 31, 2016.
            2 Source: Theme Index: The Global Attractions Attendance Report TEA / AECOM, 2016.
            3 Defined as unimproved acreage outside park perimeter, including unpaved guest parking lots but excluding paved parking lots.

                                                                                                                                             5
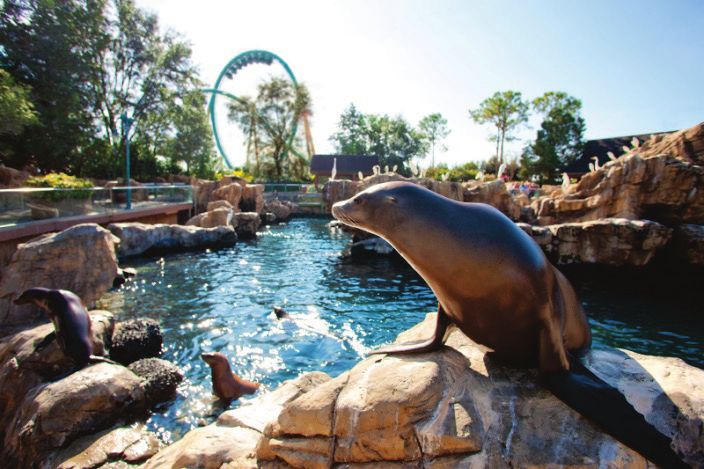
Experiences That Matter
                                       We Inspire People to Protect Animals
                                       and the Wild Wonders of Our World

 EXPLORE                               INSPIRE                                  ACT
Committed to the safety of our guests and employees and the health and well being of our animals

                                                                                                   6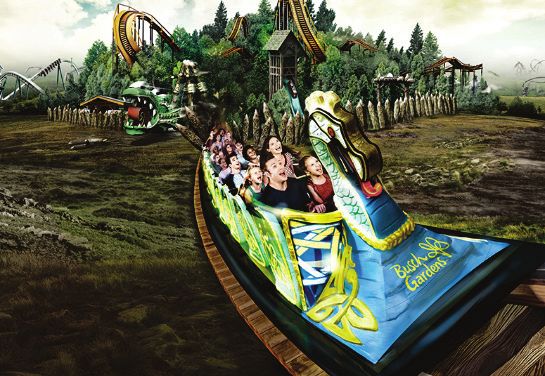
Care for Our Community and the
                        Wild Wonders We Share
                                  A Global Leader in Animal Rescue,
                                 Rehabilitation, Release and Research
•   More than 1,500 ambassadors dedicated to the care of our animals1

•   One of the world’s most respected rescue programs for ill and injured marine animals, with the goal
    to rehabilitate and return them to the wild

•   Our ambassadors have helped more than 29,000 ill, injured, orphaned and abandoned animals for
    more than five decades1

•   Contribute to wildlife research, habitat protection, animal rescue and conservation education

•   Follow our progress at www.seaworldcares.com

         1   As of December 31, 2016.                                                                     7
Successfully Transforming the Company
1 Taking Action to Address the Challenges
2 Repositioning Brand to Experiences that Matter
3 Investing in Distinct Guest Experiences: Fun and Meaningful
4 Driving Organic and Strategic Revenue Growth
5 Enhancing Financial Discipline
We are moving quickly and continue to execute a clear and deliberate strategy
to improve performance and increase value for investors
8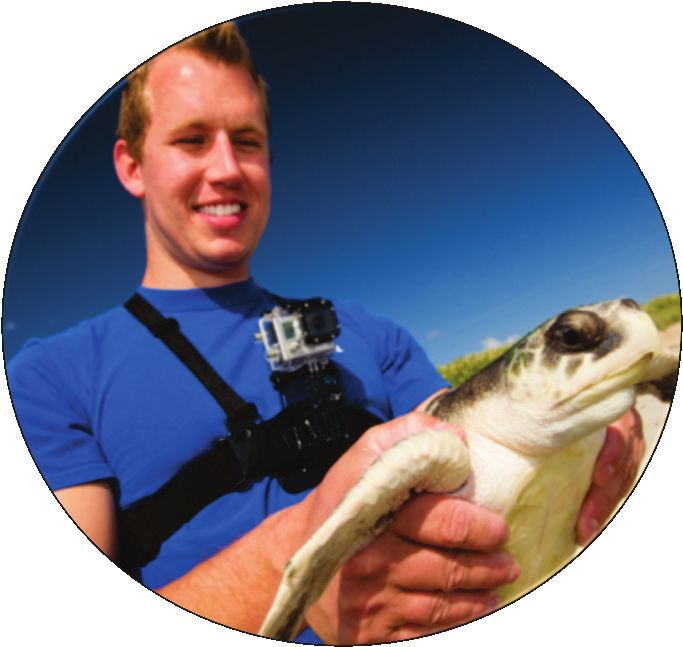
1     Taking Action to Address the Challenges
             •   Recruited Chief Executive Officer who established Five Point Plan with support of the Board of
                 Directors
             •   Recruited Chief Financial Officer to enhance financial discipline and focus on driving margin
Leadership       improvement
             •   Recruited Chief Creative Officer to deliver more attractions with less capital
             •   Recruited new Chief Marketing Officer to focus on driving increased visitation

             •   Announced the ending of the Orca breeding program and transitioned orca entertainment show into
Reputation       greater educational focus
             •   Initiated a partnership with the Humane Society of the United States

             •   After Orca Announcement, determined not to pursue the $300M Blue World project
 Refocus
             •   Redeployed capital to more cost-effective and higher return attractions to better drive revenue

                                                                                                                   9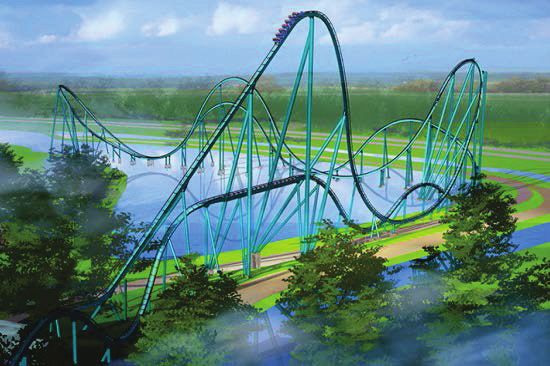
2      Repositioning Brand to Experiences that Matter

                •   Fundamentally reposition SeaWorld brand from animal entertainment to “Experiences that Matter”
                •   Existing show pools and viewing areas will be redesigned into a more naturalistic setting
Repositioning
                    – Will start in San Diego park in 2017 and will be at all SeaWorld parks by 2019

                •   Highlighting role as a global leader in animal rescue, rehabilitation, release and research

                •   Going beyond standard theme and water parks with unique, never before seen experiences
  Unique
Experiences
                •   Turning parks inside out and engaging the community with SeaWorld’s wildlife enrichment programs
                •   World class attractions will tell SeaWorld’s mission and vision (e.g., Mako / Guy Harvey partnership)

                                                                                           10

     EXPLORE                                       INSPIRE                                            ACT

                                                                                                                            10
3 Investing in Distinct Guest Experiences: Fun and Meaningful
(Opening in 2017)
Wave Breaker: The Rescue Coaster
• A new generation of coaster, the first of its kind in North
America, combining the thrill of the sea, the adrenaline rush
of a multi-launch roller coaster and the inspiration of animal
rescue is coming to SeaWorld San Antonio
• Opening in San Antonio this Summer
Kraken Virtual Reality (VR) roller coaster
VR • SeaWorld Orlando’s popular Kraken roller coaster will be
transformed into our first virtual reality coaster experience
taking riders on a mission alongside sea creatures inspired by
extinct and legendary animals of the past
• Coming to Orlando this year
InvadR
• A new wooden roller coaster, InvadR, will join Busch
Gardens Williamsburg as the park's first wooden coaster and
eighth roller coaster in total
• Features exciting ride elements, including a more than 70
foot drop, nine airtime hills, and more than 2,100 feet of
travel through a wooded terrain and underground tunnel
• Opening in Williamsburg this Spring
113 Investing in Distinct Guest Experiences: Fun and Meaningful
(Opening in 2017)
New Orca Encounter
• Introducing new, inspiring, educational orca encounters, rather
than theatrical shows, as part of our ongoing commitment to
education, marine science research, and rescue of marine
animals. These live documentaries will focus on orca
enrichment, exercise, and overall health
• Opening in San Diego this year, and will be at all SeaWorld
parks by 2019
Ocean Explorer
• A new 3-acre realm combining multiple aquariums, exciting
rides and digital technologies. The area is designed to engage
park guests in an experience centered on exploration and
adventure, inspiring them to protect the wonders of our oceans
• Opening in San Diego this Summer
Electric Ocean
• A brand new, end-of-day spectacle event. As the sun goes
down, the lights and energy go up, offering guests a different
kind of fun after dark. The ocean comes to life with
bioluminescent lighting, music and pathway entertainment,
immersing guests in a glowing sea of wonder
• Coming to San Diego and Orlando this Summer
124 Driving Organic and Strategic Revenue Growth
Delivering Results
• Changes to brand strategy and capex leading to improved revenue and attendance trends in
California and Texas
New Pricing
• Adopted rigorous analytics that lead to proven value creation vs. competition and increased pricing
Strategies • Engaged a top consultant to help implement world class analytics and pricing systems
• Creating a centralized and streamlined revenue and pricing team to achieve increasing ticket yields
Capex Driving • Capital expenditure in Florida changed YTD attendance trends
Attendance – Positive swing in attendance after Mako opened
• Drove early season pass sales above the same period last year
Season Pass Growth – Early 2017 season pass sales are positive, and have increased sales revenue over the same period
last year
• Announced a partnership to develop SeaWorld Abu Dhabi, set to open by 2022
Strategic – Brings together our partner’s development expertise with SeaWorld’s 50+ years of theme park,
Partnerships veterinary medicine, marine science and zoological practice and experience
– Capital-lite partnership is a great template for international expansion
135 Enhancing Financial Discipline
• Executing a cost optimization program that will reduce $65M of costs by the end of 2018 with
60% ($40M) net savings (~300bps in margin improvement)
Cost Alignment and
Margin • Targeting Adjusted EBITDA margin improvement to 28-30% near term, 32% longer term
Enhancement
• Implemented a restructuring program on December 6th, eliminating 320 positions to reduce costs,
increase efficiencies, reduce duplication of functions, and improve the company’s operations
• Increased cadence of capital deployment at SeaWorld parks to accelerate turnaround
Capex Optimization • Reduced capital expenditure budget maximum from $195M to $175M (10% decrease) without
affecting attraction rollout – doing more with less
Disciplined • Target a minimum of 20% cash-on-cash project returns while prioritizing capital deployment
Investment where highest returns are generated
14INVESTMENT THESIS Why SeaWorld Entertainment?
Why SeaWorld?

1           A One of a Kind Portfolio

2        Strategic Growth Opportunities

3     Significant, Recurring Free Cash Flow

4        Disciplined Capital Deployment

5   Experienced and Focused Leadership Team

6        Carrying Momentum into 2017

                                              16
1 A One of a Kind Portfolio
Award-winning Theme Parks and Attractions
• 8 of our 12 theme parks rank among the top 25 amusement parks or water parks in the U.S. by
TripAdvisor Traveler’s Choice Awards in 2016
• Busch Gardens Williamsburg named most beautiful amusement park in the world for 26
consecutive years1
• Busch Gardens Williamsburg also received Best Landscaping honor each year since 19982
• Winner of the top three spots for Best Marine Life Park since 20062
• Busch Gardens Tampa received the prestigious Liseberg Applause Award3
Busch Gardens Williamsburg Discovery Cove SeaWorld Orlando
1 National Amusement Park Historical Association, 2016.
2 Amusement Today, Inc. Golden Ticket Awards, 2016.
3 International Association of Amusement Parks and Attractions , 2016.
172 Strategic Growth Opportunities
Evolutionary Product
Revolutionary Growth
Growth New New • i.e., Extend company-
• i.e., Evans Hotels Group Businesses in Businesses in
branded entertainment
as hotel partner in San Existing Markets New Markets
outside of parks
Diego • Hotel / Resort options • Opportunistically
assess compelling
PRODUCTS / CONCEPTS
projects
Improve Existing Existing Businesses
Businesses in New Markets
• Organic growth leads to • Multi-park
strategic growth international
opportunities development
• Discovery Cove Evolutionary Market
Growth
• Announced partnership to
develop SeaWorld Abu
Dhabi, a first-of-its-kind
marine life themed park
on Yas Island
MARKETS / GEOGRAPHIES
183 Significant, Recurring Free Cash Flow
$ in millions
$129 1
$120
$107
2014 2015 2016
Net cash provided by
$262 $286 $280
operating activities
Capital expenditures $155 $157 $161
• Strong Free Cash Flow business with Positive Free Cash Flow, even in challenging years
• Stable and inexpensive debt
• Tax shield from current Federal NOL balance, estimated full usage by 2020
• Free Cash Flow will be deployed to maximize shareholder value over long term
1 May not foot due to rounding.
194 Disciplined Capital Deployment
$ in millions
Capital Expenditures • Committed to reinvesting in the business
Average $176 • Disciplined capital spend and ROI hurdles
$225
– Generally target a minimum 20% cash
$192 on cash project returns
$166 $155 $157 $161 – Prioritize capital deployment where
highest returns are generated
• Establish cadence of capital with customer-
facing major and minor attractions
– Helps address competition in key
2011 2012 2013 2014 2015 2016 tourist markets with most upside
– Focus on uniqueness of brands and
Growth Capital Approach (~75%) guest preferences
Drive revenue growth across portfolio of parks, target • Leverage value add technology in unique
New attractions
key markets at regular intervals and differentiated ways
Events
Unique offerings aimed at driving repeat visitation and – Increase mobile engagement utilizing
providing value
in-park Wi-Fi
Drive per capita growth through culinary,
Revenue initiatives
merchandise, animal experiences and interactions, etc.
– Reduce lines and hassles for guests
– Deliver personalized experience
Sustainment Capital Approach (~25%) • Ongoing analysis to measure and manage
Safety, animal welfare, maintain guest expectations performance
Infrastructure
and cleanliness
205 Experienced and Focused Leadership Team
Years with Years in
Name Title
SEAS Industry
Joel K. Manby President & Chief Executive Officer, Director 1 17
Peter J. Crage Chief Financial Officer 1 28
Anthony Esparza Chief Creative Officer 1 33
John Reilly Chief Parks Operations Officer 31 31
Marc G. Swanson Chief Accounting Officer 16 16
Chief Legal Officer, General Counsel & Corporate
G. Anthony (Tony) Taylor 16 16
Secretary
Chief Human Resources and Culture Officer
Jack Roddy 20+ years experience including Starbucks and6 Carrying Momentum into 2017
Ongoing actions to continue
Delivering tangible results positive trends
against our Five-Point Plan in
Executing a clear strategy to
every key area
improve performance and
increase value for shareholders
• Delivering robust lineup of new rides
• Improving trends at CA and TX parks
and attractions for 2017 –most
compelling initiatives in 50-year
• Positive shift in Orlando attendance history
after Mako was introduced
• Building centralized pricing team to
• Repositioned brand • Improved pricing in Florida in achieve stronger ticket yields and
• Introduced innovative new rides and September 2016 season pass improvements
attractions • Accelerating season pass sales • Executing a comprehensive cost
• Implementing new pricing strategies • Effecting an efficient capital
optimization plan
• Enhancing financial discipline with deployment strategy – more
attractions with less capital
greater focus on margin improvement
Progress and clear path forward give us confidence in 2017 improvement
22FINANCIAL OVERVIEW
Q4 & FY 2016 Financial Results

In millions, except per capita data

Note: Variance favorable / (unfavorable); Columns may not foot due to rounding
1 Defined as admissions revenue divided by attendance
2 Defined as food, merchandise, and other revenue divided by attendance

                                                                                 24
Why SeaWorld?
1 A One of a Kind Portfolio
2 Strategic Growth Opportunities
3 Significant, Recurring Free Cash Flow
4 Disciplined Capital Deployment
5 Experienced and Focused Leadership Team
6 Carrying Momentum into 2017
25Quiet Period
Investor Communications Standards
as of February 28, 2017
Open Period
Full access to Investor Relations (“IR”), face-to-face and phone discussions with CEO and CFO as well as attendance at investor
conferences, park tours and non-deal road shows, all as scheduled and coordinated by IR and otherwise in accordance with Regulation FD.
Quiet Period
The period beginning on the quarter-end date and continuing through the date of quarterly earnings release for the first three quarters of
the year, and December 15 through the 4th quarter earnings release for the last quarter of the year.
No communication between investors and the CEO, CFO or executive management, or visits to the corporate headquarters.
Access to the VP of IR via email and telephone only. Communication primarily in "listen- only" mode in order to pass on investor
feedback/concerns to management (and board as needed) or for the scheduling of meetings and calls for future open periods. IR answers to any
questions posed by investors would be limited to last publicly filed information in compliance with Regulation FD.
All Periods
All communications from an investor to non-IR personnel (e.g. directly to park personnel) will be routed through IR for response or follow-
up.
If a park tour is requested by an investor, the Vice President of IR will coordinate with the park to have an experienced ambassador as a tour
guide. Depending on the circumstances, the Vice President of IR may also attend the park tour.
Exceptions may be made when warranted but only after consultation with the CFO and Legal Department and always in compliance with
Regulation FD.
26APPENDIX
Historical Financial Highlights
$ in millions, except per capita data

                                                 2011     2012     2013     2014     2015     2016

    Theme Park Attendance                       23.631    24.391   23.391   22.399   22.471   22.000

    Total Revenue per
                                                $56.31    $58.37   $62.43   $61.51   $61.01   $61.10
    Capita1

    Total Revenue                               $1,331    $1,424   $1,460   $1,378   $1,371   $1,344

    Adjusted EBITDA                                $382    $415     $439     $370     $361    $332

    Capital Expenditures                           $225    $192     $166     $155     $157    $161

1   Calculated as total revenue divided by attendance.
                                                                                                       28
Reconciliation of Non-GAAP
Financial Measures
$ in millions
2011 2012 2013 2014 2015 2016
Net income (loss) $15 $74 $52 $50 $49 $(13)
Provision for income taxes 11 37 26 29 24 9
Loss on early extinguishment of debt 15 2 30 -- 21 --
Interest expense 98 111 90 82 66 63
Depreciation & amortization 214 167 166 176 183 200
Equity-based compensation expense 1 2 6 2 7 38
Other non-cash expenses 12 10 10 5 6 9
Other business optimization expenses -- -- -- 12 2 12
Other items -- -- -- -- 1 --
Other adjusting items -- 1 1 3 1 3
Estimated cost savings -- -- -- 10 2 10
Secondary offering costs -- -- 1 1 -- --
Debt refinancing costs 4 5 4 -- -- --
Termination of advisory agreement -- -- 50 -- -- --
Advisory fees 6 6 3 -- -- --
Carve-out costs 6 -- -- -- -- --
Adjusted EBITDA1 $382 $415 $439 $370 $361 $332
1 Columns may not foot due to rounding.
29Reconciliation of Non-GAAP
Financial Measures
$ in millions
2014 2015 2016
Net cash provided by operating activities $262 $286 $280
Capital expenditures 155 157 161
Free Cash Flow1 $107 $129 $120
1 Columns may not foot due to rounding
30Efficient Debt 4
$ in millions
Ratings Coupon Floor Maturity Amount1 xEBITDA2
Cash and Cash Equivalents3 Corp: B1 / B+ (Stable / Neg) $68
Revolver $192.5 L + 275 -- Apr-18 24
Term Loan B-2 B1 / BB L + 225 0.75% May-20 1,328
Term Loan B-3 B1 / BB L + 325 0.75% May-20 246
Total Debt $1,598 4.81x
Total Net Debt $1,530 4.61x
Amortization
$237
• Inexpensive debt with no near-term maturities TLB-2
TLB-3
• WACD = 4.49% Undrawn Revolver
Outstanding Revolver
• Approximately 64% of debt fixed through hedging until May
2020
• Revolver capacity sufficient for liquidity needs for the $1,282
foreseeable future
• We are closely monitoring capital markets to extend maturity
profile and other financing opportunities $21 $17
$17
$24 $151
1 As of December 31, 2016. 2017 2018 2019 2020
2 Calculated using Adjusted EBITDA for latest twelve months through December 31, 2016.
3 Excludes Parent Company-only cash balance.
4 See discussion relating to potential debt refinancing transaction disclosed in the Company’s earnings release dated February, 28, 2017, which is not reflected above.
31Q4/FY 2016 INVESTOR PRESENTATION
as of February 28, 2017You can also read