Fixed Income Investor Presentation - 27-28 June 2017 - The Go-Ahead Group
←
→
Page content transcription
If your browser does not render page correctly, please read the page content below
Fixed Income Investor Presentation
           27-28 June 2017
AGENDA TODAY

   Introducing The Go-Ahead Group   pg 3

   Key investment highlights        pg 9

   Business overview                pg 15

   Key transaction terms            pg 22

   Appendix                         pg 23

                                            2
INTRODUCING THE GO-AHEAD GROUP
   • FTSE 250 company
   • A leading operator of bus and rail                                            Over 1 billion                £3.4bn                  £166m
     services in the UK                                                                  Annual passenger                             Adjusted operating
                                                                                                                   Revenue
                                                                                             journeys                                       profit
   • Established market positions with 30
     year track record

   • Committed to maintaining an Investment
     Grade rating                                                                            1.08x            Baa3 / BBB-                 100%
                                                                                        Adjusted net debt /    Stable Investment
   • First transport group to achieve Carbon                                                                                        Fuel hedging in sterling
                                                                                             EBITDA              Grade ratings
     Trust triple accreditation
   • Recognised by Carbon Disclosure
     Project
   • First FTSE 350 to receive Fair Tax Mark                                                13.2%                Largest                    27%
                                                                                        Regional bus margin   London bus operator     Rail market share
   • Adopted ‘Voluntary National Living
     Wage’

Note: information as of FY 2016; adjusted for rail pension scheme accounting changes.                                                                          3
ROBUST BUSINESS MODEL
                                                                                        We generate
                                                                                    revenue and profit
                                                                                    in two main ways:

                                                                                1. Fare paying passengers
                                                                                   2. Operating contracts               Through three
                                                                                                                      operating divisions:
                                               To build a sustainable
                                                  business for the
                                                     long-term
                                                                                                                      Regional   London   Rail
                                                                                                                        bus        bus

                                                Creating value for:
                                                                                                                            Enabled by:
                                            Communities Customers Our people
                                                                                                                         Key relationships
                                                                                                                          and resources
                                                                                    Supported by:
                                              Investors Strategic Government
                                                         partners&               Four strategic priorities
                                                          suppliers
                                                                                                               $€
                                                                                                              $£

                                                                               Society Customers Our people Finance
                                                                                   A robust governance
                                                                                        framework
                                                                                       Effective risk
                                                                                       management

Further detail on Go-Ahead’s business model is contained in the appendix.                                                                        4
REGIONAL BUS
• Owner / operator of six business units                                                                                Regional bus revenue (FY 2016)
• Sector leading operating margin and revenue growth,
                                                                                                                                 6% 5%
  with stringent cost control
• Focus on Southern regions                                                                                               14%
                                                                                                                                                         27%       Go North East
                                                                                                                                                                   Go South Coast
                                                                                                                                                                                                  £376m
• Enabling over 230 million passenger journeys annually                                                                                                            Brighton & Hove
                                                                                                                                                                   Oxford Bus Company
• Modern bus fleet (7.1 years average age)
                                                                                                                                                                   Plymouth Citybus
• Devolved structure - decision making at local level                                                                       24%                         24%        Go East Anglia
• Highest overall UK customer satisfaction score at 90%
                                                                                                                        Regional bus market share3 (%)
            Operating profit margin (%)
    20%

                                                                                                                                                                                                        7%
                                                                                                                                                        24%         Stagecoach
                                                                                 13.2%                                     30%
    15%        13.4%                                             13.0%                                                                                              FirstGroup
                                                11.9%
                                10.8%
                                                                                                                                                                    Arriva
    10%        11.3%                            10.8%            11.3%           10.6%                                                                              Go-Ahead
                                10.4%

     5%
                                                                                                                            6%                             18%      National Express
                2012            2013         2014           2015                  2016                                                                              Others
                           Go-Ahead's operating profit margin (%) 1                                                           7%           15%
                           Sector average operating profit margin (%)        2

(1) Based on results adjusted for rail pension schemes, excluding amortisation, goodwill impairment, exceptional operating costs, and the incremental impact of IAS 19 (revised); (2) Calculated as the average of reported UK   5
regional bus segmental results (as defined by the respective company): Stagecoach (“Regional bus”, including megabus), FirstGroup (“First Bus”), and National Express (“UK bus”); (3) Go-Ahead estimates (FY 2016).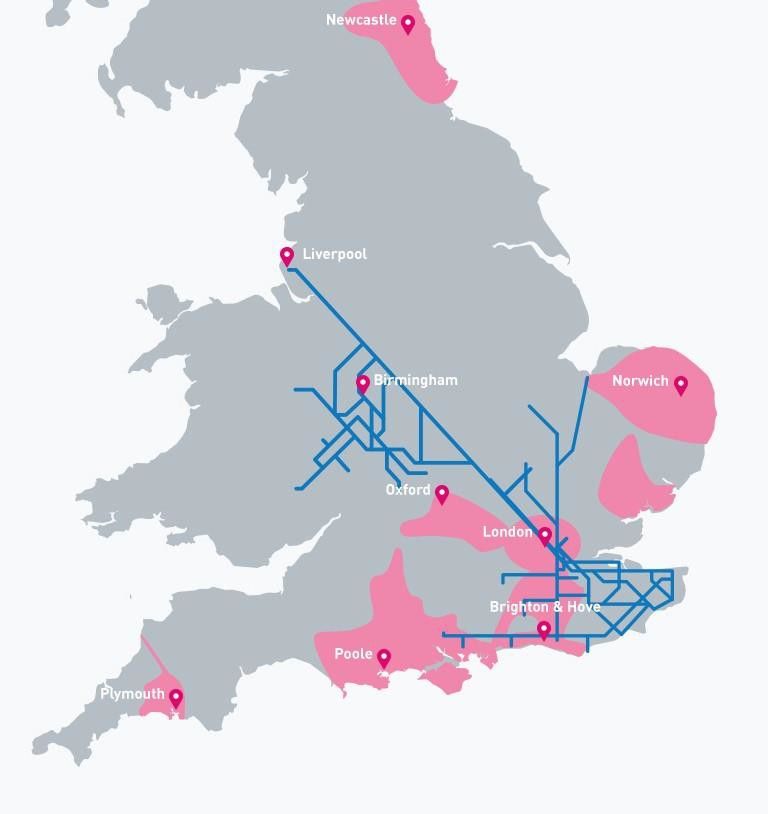
LONDON BUS
• Largest London bus operator with 190 routes and 24%                                                                    Consistent market share2
  market share
                                                                                                                               40%
• Largest electric bus operator in the UK
                                                                                                                               30%       24.4%         23.7%         24.2%         24.1%        24.5%         24.0%
• No volume risk under gross cost contracts1 with TfL
• 17 strategically located depots, 85% of which are freehold                                                                   20%

• c.500m passenger journeys and c.85m miles operated                                                                           10%
  annually
                                                                                                                                0%
• Track record of contract retention with stable marketshare                                                                              2012          2013          2014         2015          2016          2017

   Operating profit margin (%)                                                                                           London bus market share3 (%)
   15%

                9.2%            9.2%             9.3%            9.2%             8.9%
                                                                                                                                   8%
                                                                                                                                          4%
                                                                                                                                                            24%          Go-Ahead
                                                                                                                                                                         Comfort DelGro
                                                                                                                                                                                                         24%
   10%                                                                                                                     12%
                                                                                                                                                                         Arriva

     5%                                                                                                                                                                  Stagecoach
                                                                                                                                                                         RATP
                                                                                                                           15%
     0%                                                                                                                                                      19%
                                                                                                                                                                         Abellio
                2012             2013            2014            2015             2016
                                                                                                                                         17%                             Tower Transit

(1) Under gross cost contracts, Go-Ahead’s entire revenue comprises payments made by the transport authority with the authority retaining all fare revenue raised and therefore revenue risk; (2) Market share at
January of respective years; (3) Go-Ahead estimates, as at FY 2016.
                                                                                                                                                                                                                      6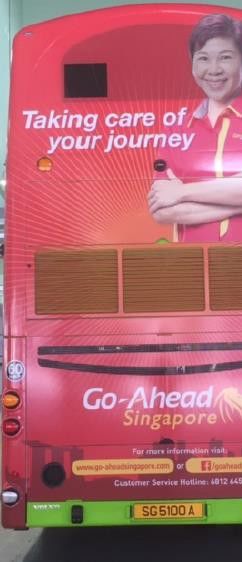
RAIL
• Operates three commuter franchises on behalf of the DfT                                                        Franchise revenue split (FY 2016)
  through 65/35% JV with Keolis
• Franchises: Southeastern, London Midland and GTR
• 27% UK rail market share enabling c.35% of all UK
                                                                                                                        17%

                                                                                                                                                         GTR*
                                                                                                                                                                          £2,498m
  passenger rail journeys                                                                                                                     48%        Southeastern
• Supported by long-term contracts
                                                                                                                                                         London Midland
• Track record of franchise renewals                                                                                35%

                                                                                                                   (*) of which Southern element contributes 6%

                                                                      Expected                                   UK rail market share2 (%)
  Franchise                    Held since Renewed
                                                                      end date

  Southeastern                 Apr-06              Oct-14             Dec-18                                        11%
                                                                                                                             9%
                                                                                                                                             28%
                                                                                                                                                          Stagecoach
                                                                                                                                                          Go-Ahead
                                                                                                                                                                           27%
                                                                                                                                                          FirstGroup
  London Midland               Nov-07              Apr-16             Oct-17
                                                                                                                  12%                                     Arriva

  GTR                          Sep-141             n/a                Sep-21                                                                              Abellio
                                                                                                                      13%                     27%         Others

(1) The Southern and Gatwick Express elements of GTR have been held since 2001 and 2008 respectively; (2) Based on reported revenue.                                                7
INTERNATIONAL
• Limited initial capital deployed to avoid taking market risk in new jurisdictions
• Profits reinvested in international businesses in early years rather than repatriation

• Similar features to London bus market with              • Currently mobilising two contracts to operate
  volume risk borne by the Government                       rail services in the German state of Baden-
                                                            Württemberg from June 2019 to 2032
• Pipeline of opportunities in this market
                                                          • Third 13 year contract awarded in June 2017,
• Expected revenue of c.SGD500m over five
                                                            beginning operations December 2019
  year contract
                                                          • Underpinned by gross cost contracts
• Five year contract awarded to operate bus
  services in Singapore from September 2016               • Expected revenue of c.€2bn across the
                                                            lifetime of the contracts
• c.400 buses on 25 bus routes

                                                                                                            8
KEY INVESTMENT HIGHLIGHTS

1   Established
    Established position
                position in
                         in UK
                            UK markets
                               markets

2   Resilient earnings profile
                       profile

3   Supported by long-term contracts

4   Strong financial profile

5   Experienced management team

                                         9
1        ESTABLISHED POSITION IN UK MARKETS
Business diversification                    Stable market position
• Balanced earnings across core             • 30 year track record since privatisation
  business areas                              in 1980s (bus) and 1990s (rail)
• Exposure to different passenger groups    • Focus on London and the South East
  provides resilience
                                            • Six locally managed regional bus
• Supported by devolved structure where       operations across the UK
  local management teams make local
                                              – c.5,000 buses
  decisions
Adjusted operating profit split (H1 2017)     – 2 million passenger journeys daily
                                                (FY 2016)

                              Regional      • Three major rail franchises
             35%
                                bus           – 1.3bn passenger journeys annually
                                                (FY 2016)

             29%               London       • Strong local brand recognition
                                bus         • Continuously improving customer
                                              experience – USB charging points, Wifi
                                              and contactless payment channels
             36%                  Rail
                                            • Expanding into targeted international
                                              markets

                                                                                         10
2 RESILIENT EARNINGS PROFILE
London bus Regional bus Rail
• Cost-efficient operations underpin strong • Flexibility to optimise fares and routes • Focus on south east region with strong
and stable operating margin sustains earnings profile commuter demand
• No volume risk • Leading margins underpinned by variable • GTR management contract limits
cost base and degree of resilience to revenue risk for rail division
economic cycles
CAGR 12-16: 5.9% CAGR 12-16: 9.3% CAGR 12-16: 20.6%
60 60 80 72
47 50
42 42 44
39 42
40 35 35 36 60 50
40
34 Average: 42 32
40
20 20 21
20
0 0 0
2012 2013 2014 2015 2016 2012 2013 2014 2015 2016 2012 2013 2014 2015 2016
London bus operating profit (£m) Regional bus operating profit (£m) Rail operating profit (£m)*
200 Adjusted group operating profit (£m) * CAGR 12-16: 12.4% 166
139
150
104 115
96
100
50
0
2012 2013 2014 2015 2016
* Adjusted to reflect changes to accounting for rail pension schemes. 113 SUPPORTED BY LONG TERM CONTRACTS
Regional bus Regional bus revenue mix (FY 2016)
• 30% of revenue contracted via concessionary 10%
payments and local authority tenders Passengers fare
20%
• Strong partnership with local authorities Concessionary reimbursement
Tendered contracts
70%
London bus London bus revenue mix (FY 2016)
• 95% of revenue from five to seven year gross 5%
cost contracts with TfL
• Revenue on a per mile basis eliminates volume TfL contracts
risk Other
95%
Rail Rail revenue mix (FY 2016)
• 95% of revenue from passenger fares through 5%
direct award contracts (Southeastern, London
Franchise payments and
Midland) and gross cost contract (GTR) with the subsidies (DfT)
DFT
Other
• Operational risk due to industrial action
mitigated by contractual agreements 95%
124 STRONG FINANCIAL PROFILE
• Stringent financial policy and targets: 4.00x
3.50x
– Adjusted net debt1 / EBITDA target range of 1.5x to
3.00x
2.5x; bank covenant 3.5x
2.50x
– Cashflow / adjusted EBITDA (cash conversion) target of 1.88x 1.94x
2.00x
>1.0x 1.48x
1.17x
1.50x
1.08x
– Dividend cover target of >2x (based on adjusted EPS / 1.00x
DPS, excluding IAS19 incremental impact) 2012 2013 2014 2015 2016
Adjusted net debt / EBITDA Bank covenant Target range
• Robust and sustainable cash flow generation
• Strong liquidity classification with S&P
BBB- Stable
• Explicit commitment to maintain Investment Grade
credit ratings
• Stable outlook with both rating agencies
reaffirmed May 2017 (S&P) and June 2017 Baa3 Stable
(Moody’s)
(1) Adjusted net debt refers to total net debt plus restricted cash from rail; adjusted for impact of rail pension scheme accounting changes. 135 EXPERIENCED MANAGEMENT TEAM
David Brown Patrick Butcher
Group Chief Executive Group Chief Financial Officer
• In post since 2011 • In post since March 2016
• Over 33 years’ industry experience • Over 15 years’ experience as a finance director
• CEO of Go-Ahead’s London bus business from • Former group finance director of Network Rail,
2003 to 2006 and advisor to the main Board DB Schenker and London Underground
Charlie Hodgson Martin Dean
MD of Rail Development MD of Bus Development
• In post since July 2013 • In post since 2008
• Over 15 years’ industry experience • Over 30 years’ experience in the transport
• Previously Associate Director at KPMG and five sector
years in Government, including at the DfT and • Previously held senior management roles in rail
SRA and bus with FirstGroup and National Express
14BUSINESS OVERVIEW
1 Strong financial performance
2 Prudent treasury management
3 Investment projects
4 GTR franchise
5 Sustainable business
6 Looking ahead
15STRONG FINANCIAL PERFORMANCE
Consistent revenue growth (£m) Growing operating profit and stable margin
4,000 CAGR 12-16: 8.5% 200 CAGR 12-16: 12.4% 10%
3,215 3,361 166
2,702 139 8%
3,000 2,572 150
2,424 115
104 96 6%
2,000 100
4.9% 4%
4.3% 4.3% 4.3%
1,000 50 3.7%
2%
0 0 0%
2012 2013 2014 2015 2016 2012 2013 2014 2015 2016
Adjusted operating profit (£m)* Operating margin (%)
Low leverage (x) and consistent net debt (£m) Cash conversion (x)
400 3.0x 1.0 0.88 0.91
0.80
296 300 0.8 0.71
300 260 0.63
245 239 2.0x
0.6
200 1.88 1.94
1.48 0.4
1.0x
100 1.17 1.08 0.2
0 0.0x 0.0
2012 2013 2014 2015 2016 2012 2013 2014 2015 2016
Adjusted net debt Adjusted net debt/ EBITDA (x) Cashflow/ EBITDA (x)
* Adjusted to reflect changes to accounting for rail pension schemes. 16PRUDENT TREASURY MANAGEMENT
• £280m RCF in place, maturing in July 2021, of which £85m was undrawn at H1 2017
• Fuel price risk fully managed via hedging in sterling (100% until FY 2018)
• Limited foreign exchange exposure
• £74m unrestricted cash out of £636m cash balance (FY2016)
Fuel hedging (at H1 2017) Debt composition (FY 2016)
2017 2018 20191 20201 20211
36%
Fixed rate bond
% hedged 100% 100% 60% 30% 10%
Variable rate loans
64%
(1) Assumes consistent usage and that hedging is completed at the Dec-16 market price. 17INVESTMENT PROJECTS
• Track record of successful project delivery
• Future capex influenced by timing of bus and rail contractwins and
extensions
• Capital investment expected to exceed £100m in FY 2017 due to timing
of contract renewals in London bus
• Recent investment in new depots and buses adding 198 regional and
118 London buses
• Two new large depots opened at Three Bridges and Hornsey
• £400m of new rolling stock already delivered
• The programme is expected to complete in 2018
• UK’s largest ever driver training and recruitment programme
18GTR FRANCHISE
• Industrial action is ongoing over the industry-wide roll-out of driver controlled trains
• Consequent increased costs from delays to cost improvement initiatives
• GTR contract with the DfT has protection against the financial impact of industrial action
• Complexity around contract variations creates a range of reasonably possible outcomes. Expected
impact on profitability is within a range of +/- £15m.
Two stages to dialogue with the DfT
• Agree an event of change has happened
• Agree the financial impact
Contract has three drivers of long-term profitability
• Running a reliable service for customers
• Agreeing the costs of running longer and more trains on expanded infrastructure
• Delivering a programme of cost improvements envisaged at the outset of the contract
19SUSTAINABLE BUSINESS
• Customer satisfaction: Highest average score 90%1
• Innovation for our customers:
• USB charging points
• Customer app
• Mobile tickets
• Smartcards
• Next stop audio announcements
• Contactless payment channel
Carbon emissions per journey (kgs)
• First fully electric depot in the UK & largest electric 0.86
0.85
bus fleet (Waterloo) 0.84
0.84
• Alternative fuel buses: 33% of regional fleet; 27% of 0.83
London fleet 0.82
0.82 0.82
• Carbon Trust Standard: Triple re-certification
0.80
• BITC Corporate Responsibility Index: 95% score2 2012 2013 2014 4 2015 2016
(1) Transport Focus National Bus Passenger Survey; (2) Business in the Community Corporate Responsibility Index; (3) Energy management systems certification; (4) Non-favourable CO2 conversions factors for electricity. 20LOOKING AHEAD
Protect and grow core businesses
• Renewal of franchise contracts – awaiting West Midlands bid outcome
• Continuing investment in bus fleet
• Ongoing engagement with the DfT around GTR contract variations
Win new bus and rail contracts
• Expanding international presence – Singapore bus and German rail
contract wins
• Development team is exploring further opportunities in targeted markets
Prepare for the future of transport
• Bus Services Act presents opportunity for closer working with local
authorities
• Implementation of Government policy efficiency measures in rail
• Investment in innovation and technology
21KEY TRANSACTION TERMS
Issuer The Go-Ahead Group plc
Go-Ahead Holding Limited, Go North East Limited, London General Transport Services Limited, Go
Guarantors South Coast Limited, Brighton & Hove Bus and Coach Company Limited, and The City of Oxford
Motor Services Limited
Expected Ratings Moody’s: Baa3 (Stable) / S&P: BBB- (Stable)
Format Reg S, Senior Unsecured, Guaranteed, Bearer Notes
Currency GBP
Size £250m
Maturity Seven years
Coupon Step 125bps in the event of downgrade
Optional Redemption Issuer call at Gilts + [l]bps; three month parcall
Use of Proceeds Refinancing indebtedness and/or general corporate purposes
Denominations £100k + £1k
Listing London
Bookrunners BNP Paribas, HSBC and NatWest Markets
Governing Law English
22Appendix
23INTRODUCTION TO UK BUS & RAIL
Regional bus London bus Rail
• Routes outside London operated on a • Routes in London operated for TfL, which • Franchises operated on behalf of the
predominantly commercial basis sets routes and service frequencies Department for Transport (DfT)
• Accountable to traffic commissioner and • Fares set by Mayor of London • Regulated by Office of Rail & Road (ORR)
other industry bodies
• Gross cost contracts require tight control of • Private operators bid for tenders issued by
• Partnership with local authorities, meet cost base DfT, outlining the premium they are willing
needs of local communities to pay to the DfT, or the subsidy they would
• Fully regulated, with tenders issued by TfL
need to receive to operate the franchise
• Local markets with unique features
• Private operators bid on an individual route
• Peak fares, routes and service frequencies
• Mainly private operators; some local contract basis
are set by DfT
authority owned operations
• Revenue paid to operators by TfL on a
• Franchises typically have initial contract
• Operators largely make own decisions (e.g. revenue per mile basis
terms of around eight years
fares, routes and service frequencies)
• Typically year contracts with two year
• Infrastructure largely owned and managed
• Some tendered services are run on behalf of performance-based extension
by Network Rail
councils (e.g. school contracts)
• Ancillary revenues from advertising, rail
• Trains leased from rolling stock operators
• Operators have a relatively flexible cost replacement bus services, and third party
(roscos)
base, which can be adapted to mitigate contracts
external factors • Operators have a relatively fixed cost base
• Quality Incentive Contracts (QICs) set by
• The Bus Services Act will give new enabling TfL to encourage provision of punctual • New franchises typically have low overall
powers for franchising services capital intensity, albeit revenue risk
24FURTHER BUSINESS MODEL INFORMATION
Revenue Fleet
1. Commercial provision of transport services to fare-paying
passengers, whose revenue covers the cost of service 50%
Leased
and a profit margin (e.g. Regional bus) 100% 100%
Owned
2. Contracted provision of transport services on behalf of 50%
public sector transport authorities (e.g. London bus, Rail)
Regional buses London buses * Trains
Contracts
1. Gross cost contracts: entire revenue comprises Infrastructure
payments made by transport authority, who bears the • Use of track: pay Network Rail track access and other
revenue risk (e.g. London bus, GTR) charges e.g. for electrification
2. Net cost contracts: revenue is a combination of income • Bus stations: pay local authorities for usage
from fares and payments from transport authorities (e.g. • Bus depots: 85% owned freehold
Rail, excluding GTR)
• Rail depots: rented from Network Rail
Where revenue is partly or wholly derived from transport
authorities cost controls are important (e.g. labour utilisation,
fuel efficiency and managing contractual relationships)
* Approximate share. 25Disclaimer
This document is not for publication, release or distribution in and may not be taken or transmitted into the United States of America, Canada, Japan, South Africa or Australia and may not be copied, forwarded, distributed or transmitted in or into
the United States of America, Canada, Japan, South Africa or Australia or any other jurisdiction where to do so would be unlawful. The distribution of this document in any other jurisdictions may be restricted by law and persons into whose
possession this document comes should inform themselves about, and observe any such restrictions. Any failure to comply with such restrictions may constitute a violation of the laws of the United States, Canada, Japan or Australia or any other
such jurisdiction. By accepting this document, you agree to be bound by these restrictions.
This document should not be distributed in the united states or to U.S. Persons as defined in regulation s of the U.S. Securi ties act of 1933, as amended this document comprises the investor presentation providing a general overview and
update on the business and finances of the go-ahead group plc (the "company") and its subsidiaries (together, the "group") and does not purport to deal with all aspects and details regarding the company or the group.
No reliance may be placed for any purposes whatsoever on the information in this document or on its completeness. Neither the company nor any of its directors, officers, employees or advisers nor any other person makes any representation or
warranty, express or implied, as to, and accordingly no reliance should be placed on, the fairness, accuracy or completeness of the information contained in the presentation or of the views given or implied.
Neither the company nor any of its directors, officers, employees or advisers nor any other person has any liability whatsoever for any errors or omissions or any loss howsoever arising, directly or indirectly, from any use of this information or its
contents or otherwise arising in connection therewith.
This document does not and is not intended to constitute, and should not be construed as, an offer, inducement, invitation or commitment to purchase, subscribe to, provide or sell any securities, services or products of the company in any
jurisdiction or to provide any recommendations for financial, securities, investment or other advice or to take any decision. You are encouraged to seek individual advice from your personal, financial, legal, tax and other advisers before making
any investment decisions to purchase any securities.
No action has been made or will be taken that would permit a public offering of any securities described herein in any jurisd iction in which action for that purpose is required. No offers, sales, resales or delivery of any securities described herein
or distribution of any offering material relating to any such securities may be made in or from any jurisdiction except in circumstances which will result in compliance with any applicable laws and regulations.
This document has been prepared by the Company. This document and any materials distributed in connection with this document may include forward-looking statements, in particular, the words "expect", "anticipate", "estimate", "may", "should",
"plans", "intend", "will", "believe", "continue" and similar expressions (or in each case their negative and other variations or comparable terminology) can be used to identify forward- looking statements. These forward-looking statements are
statements regarding the Company's intentions, beliefs or current expectations concerning, among other things, the Company's results of operations, financial condition, liquidity, prospects, growth, strategies and the industry in which the
Company operates. These statements are based on expectations of external conditions and events, current business strategy, pl ans and the other objectives of management for future operations, and estimates and projections of the Company's
financial performance. These expectations may prove to be erroneous. By their nature, forward-looking statements involve risks and uncertainties, many of which are outside the control of the Company. The forward-looking statements are not
guarantees of future performance and the Company's actual results of operations, performance, achievements, cash flows and di vidends and/or industry results may differ materially from those made in or suggested by the forward-looking
statements contained in this document. Save as required by applicable law and regulation, the Company does not undertake any obligation to review, update or confirm expectations or estimates or to release publicly any revisions to any
forward-looking statements to reflect events that occur due to any change in the Company's board of directors' expectations, or to reflect circumstances that arise after the date of this document.
This document is exempt from the general restriction (in section 21 of Financial Services and Markets Act 2000) on the communication of invitations or inducements to engage in investment activity pursuant to the Financial Services and Markets
Act 2000 (Financial Promotion) Order 2005 (the "FPO") on the grounds that it is intended for distribution in the United Kingd om only to persons who (i) are qualified investors (within the meaning of the Prospectus Directive 2003/71/EC) and (ii)
who have professional experience in matters relating to investments who fall within the definition of "investment professiona ls" in Article 19(5) of the FPO and/or to high net worth bodies corporate, unincorporated associations and partnerships
and trustees of high value trusts as described in Article 49(2)(a) to (d) of the FPO or to those persons to whom it may otherwise be lawfully communicated (in each case referred to as "Relevant Persons"). The information contained in this
document is not intended to be viewed by, or distributed or passed on (directly or indirectly) to, and should not be acted up on by any class of persons other than Relevant Persons. It is a condition of your receiving this document that you
represent and warrant to the Company that (i) you are a Relevant Person; and (ii) you have read and agree to comply with the contents of this notice. In the event that a person who is not a Relevant Person receives this document, such person
should not act or rely on this document and should return this document immediately to the Company. Neither the Company, nor any of its subsidiaries or affiliates, nor any adviser or person acting on their behalf, shall (without prejudice to any
liability for fraudulent misrepresentation) have any liability whatsoever for loss however arising, directly or indirectly, f rom the use of information or opinions communicated in relation to this document.
26You can also read