Cumberland County Public Schools - 2021-2022 Proposed School Operating Budget - Amazon AWS
←
→
Page content transcription
If your browser does not render page correctly, please read the page content below
Cumberland County Public Schools

          2021-2022

Proposed School Operating Budget
Page| 1

                                      Cumberland County Public Schools
                                      We serve 1,197 students (1,125 in K-12 and 72 in prekindergarten) in
                                      Cumberland County, Virginia. With rural characteristics, Cumberland
                                      County Public Schools is proud to maintain an elementary school, one
                                      middle school, and one high school.

Total 2021-2022 Funding Request:
                                      Our community has a tradition of pride in our schools and consistently
         $17,562,682.04               values public education as key to a well-educated citizenry, a prepared
  Student Enrollment: 1,125           workforce, a vibrant local economy, and caring community servants.
   1,197 (K-12), 72 (Pre-Kg)

Schools: 3
    ➢ 1 Elementary
    ➢ 1 Middle
    ➢ 1 High

Employees: 228

Students Graduating with Associates
Degrees: 25%

Students Graduating with Advanced
Studies Diplomas: 53%

Students Graduating with Standard
Diplomas: 45%

On-Time Graduation Rate: 94.4%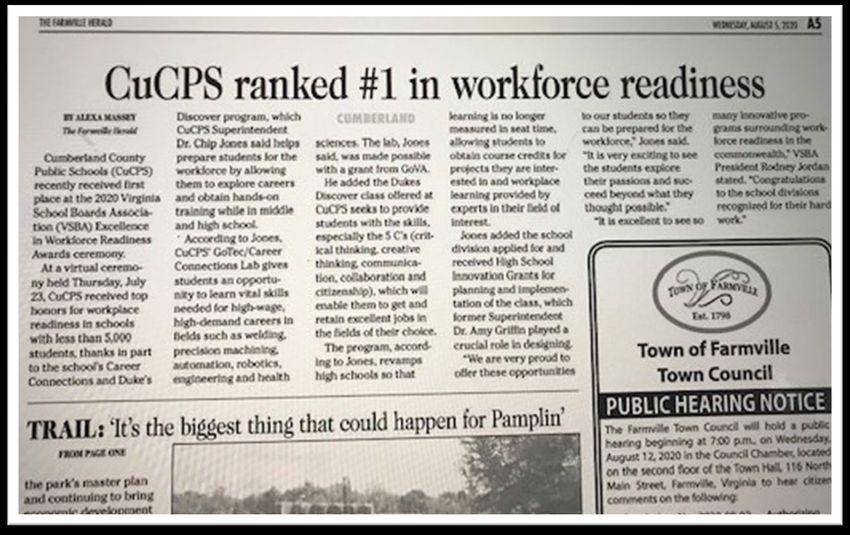
Page| 2

Cumberland County Public Schools
             2021 – 2022
   Proposed School Operating Budget

                   School Board

          Ms. Ginger Sanderson, Chairman
          Dr. Christine Ross, Vice-Chairman
                   Mr. Lee Dowdy
               Ms. Latesha Anderson
                 Ms. Leigh McCrea

       Central Office Administrative Staff

                   Dr. Chip Jones
               Division Superintendent

              Dr. Elizabeth Jamerson
   Assistant Superintendent of Human Resources

                  Mrs. Bernice Ford
           Director of Special Education

                  Dr. Sharon Almond
         Director of Curriculum & Instruction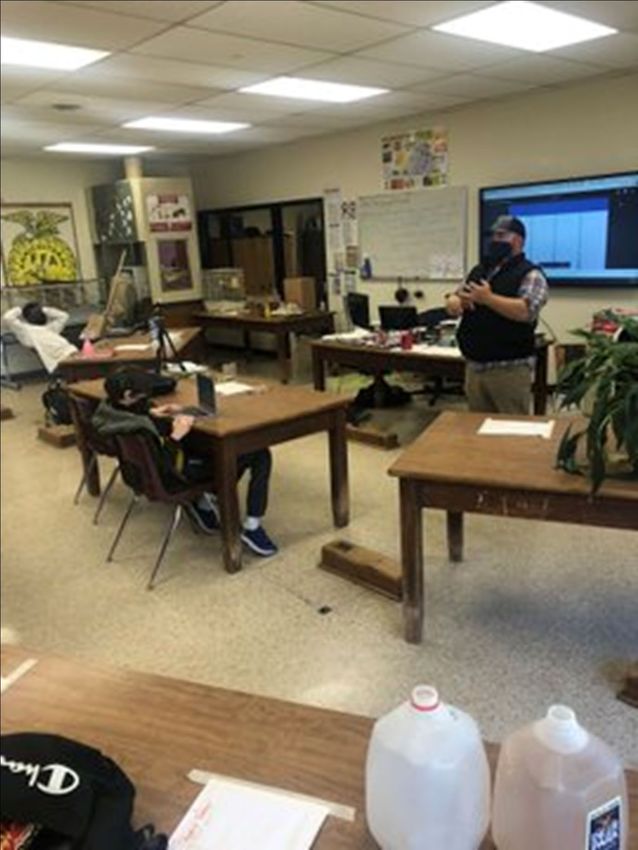
Page| 3

                              Acknowledgement
We would like to thank the budget staff, central office staff, principals, and support staff
for their dedication and commitment in generating the 2021 – 2022 Proposed School
Operating Budget. This process takes a tremendous amount of time and patience.
Their team approach, hard work, and cooperation have allowed us to present an
effective budget.

                                          Budget Staff

                                         Dr. Chip Jones
                                    Division Superintendent

                                        Phyllis Langhorne
                                        Business Manager

                                          Donna Cooke
                                Administrative Assistant, Finance

  §22.1-92 Estimate of moneys needed for public schools; notice of costs to be distributed.

It shall be the duty of each division superintendent to prepare, with the approval of the school board,
and submit to the governing body or bodies appropriating funds for the school division by the date
specified in §15.2-2503, the estimate of the amount of money deemed to be needed during the next
fiscal year for the support of the public schools of the school division.
Page| 4

Contents
CUMBERLAND COUNTY PUBLIC SCHOOLS ........................................................................................................................ 0

2021 – 2022 ................................................................................................................................................ 0

SCHOOL OPERATING BUDGET SCHOOL OPERATING BUDGET ........................................................................................ 0

MESSAGE FROM THE SUPERINTENDENT ....................................................................................................... 5

USER’S GUIDE TO THE CUCPS BUDGET .......................................................................................................... 6

2021 – 2022 BUDGET CALENDAR ....................................................................................................... 7

   2021 – 2022 BUDGET CALENDAR ....................................................................................................................................... 8

HOW TO USE THIS DOCUMENT ......................................................................................................................... 9

THE CUCPS BUDGET STRUCTURE ......................................................................................................................... 10

EXECUTIVE SUMMARY OF OPERATIONS AND FUNDING REQUEST ........................................................... 13

CUCPS ACCOMPLISHMENTS .......................................................................................................................... 14

OVERVIEW OF CUMBERLAND COUNTY PUBLIC SCHOOLS ........................................................................ 15

CUCPS ORGANIZATIONAL STRUCTURE ....................................................................................................... 18

SUMMARY OF REVENUE AND EXPENDITURES............................................................................................. 19

REVENUE AND EXPENDITURES SUMMARY .................................................................................................. 20

REVENUE OVERVIEW: OPERATING FUND .................................................................................................... 21

STATE REVENUE .............................................................................................................................................. 25

FEDERAL REVENUE ......................................................................................................................................... 26

COMPOSITION OF EXPENDITURES ................................................................................................................ 27

INSTRUCTION ............................................................................................................................................ 28

ADMINISTRATION, HEALTH, AND ATTENDANCE ................................................................................. 29

PUPIL TRANSPORTATION ............................................................................................................................... 30

OPERATIONS AND MAINTENANCE ................................................................................................................. 31

TECHNOLOGY ................................................................................................................................................... 32

FEDERAL EXPENDITURES............................................................................................................................... 33

THE GOVERNOR’S SCHOOL OF SOUTHSIDE VIRGINIA ................................................................................ 34

CAFETERIA REVENUE .............................................................................................................................................. 36

CUCPS EMPLOYEE BENEFITS................................................................................................................................. 37

FISCAL YEAR 2021 SALARY SCALES ..................................................................................................................... 39

Page| 5

Message from the Superintendent
Page| 6

User’s Guide to the CuCPS Budget

The CuCPS Budget Development Process
The budget is an estimate of the school division's revenues and expenditures for the fiscal year. It is
based on a snapshot of the current revenue and expenditure structure and modified to reflect changes
in plans, priorities, and circumstances beyond the control of local staff and officials. The sum total of
the modifications represents the final Approved budget for the next fiscal year. The budget is a resource
allocation and policy document that presents the school division's plan and priorities for the upcoming
fiscal year. Through budget planning and discussion, staff, community, and board members guide the
direction of the activities of the school division. The CuCPS budget development process starts long
before the beginning of the fiscal year and involves staff from schools and CuCPS departments, the
School Board, Board of Supervisors, and budget staff.

Schools and departments submit budget requests for the operating budget in two areas. The base
budget request consists of recurring funds allocated to schools and departments. The base budget
amount for departments is calculated by analyzing prior year allocations to determine the level of
funding for recurring activities. Budget requests are also submitted for supplemental allocations.
Supplemental allocations can include requests for additional staffing, as well as requests for non-
personnel resources.

All schools and departments may request supplemental allocations to obtain funding to update
instructional materials and supplies, to implement a new initiative, or to have base budget allocations
increased due to rising costs of operations, such as utilities, insurance prices, or other cost increases.
This permits schools and departments to engage in wide-ranging planning discussions about
programmatic and budget needs. Decisions to fund, modify, or not fund supplemental requests are
made by CuCPS central office staff prior to inclusion in the Superintendent’s Budget.

Decisions on all budgetary items made by the Superintendent are contained in the Superintendent’s
Budget presented to the School Board in February. The School Board reviews the Proposed School
Operating Budget and makes adjustments as it sees fit. The School Board adopts the modified budget
and it is forwarded to the County Administrator at the end of March as the School Board's Approved
Budget. In April, the Board of Supervisors approves the County's final allocation to the schools. The
School Board makes any adjustments necessary to the CuCPS budget and passes the Final Adopted
Budget in early May. Detailed dates are shown below and on the following page.

The CuCPS budget for its Capital Improvement Program (CIP) is prepared on a cycle similar to the
operating budget. The CIP is prepared over the summer and early fall. Final CIP amounts for the school
division are included in the County’s Approved budget in April.
Page| 7

2021 – 2022 Budget Calendar

                                            Cumberland County Public Schools
                     Virginia school law requires budgets to be based upon a fiscal year that begins July 1 and
                     ends June 30. The budget process in Virginia may involve three stages:

                    First, is the preliminary preparation of a budget document which should contain a budget
                    message, a revenue plan, and an expenditure plan. The central
administration receives information from individual schools, school data, special requests, parents,
community, and staff related to needs for the coming year. This information is used to determine the estimated
expenditures for the ensuing year. In addition, the central administration estimates the revenue for the
coming school year. The budget document is presented to the school board for review.

During the second state, the school board evaluates the budget, modifies it if necessary after the required
public hearing, and approves the budget.

In the third stage, the budget is forwarded to the board of supervisors for final approval by May 1 (for counties)
or within 30 days following receipt of estimated state funds (Code of Virginia, §22.1-93). The Approved budget
is to be used for planning purposes for the upcoming year. Funds are not available for spending until the
budget is appropriated in July.

        September:
        ▪ Administrative staff reviews school board goals to determine need for textbooks, supplies, and
           equipment.
        ▪ CIP reviewed by advisory committee, superintendent, and administrative staff.
        October:
        ▪ Principals and Central Office Administration seek parent input for the new budget.
        ▪ Administrative staff seeks staff input for the 2021-2022 school budget.
        ▪ Principals and staff prepare budget requests and submit to superintendent.
        ▪ Superintendent submits CIP requests to County Administrator.
        November:
        ▪ 2nd Preliminary school and department budget requests are submitted to the superintendent.
        December:
        ▪ 3rd Public and School Board input for budget development at the Regular December Board
           Meeting.
        January:
        ▪ Administration develops draft of 2021-2022 School Budget.
        ▪ School Budget Request due to County Administrator.
               st
        ▪   21 School Board Budget Work Session.
        ▪   Teacher Intent forms for the upcoming school year are sent out by Human Resources.
Page| 8

2021 – 2022 Budget Calendar (Cont’d)

    February:
    ▪ 4th Presentation of the Proposed 2021-2022 Budget by the Superintendent (First Read) at the
        Regular February School Board Meeting.
    ▪   School Board and Board of Supervisors conduct a joint budget work session.
    ▪   18th School Board Public Hearing on the 2021-2022 School Budget by the Superintendent.
    March:
    ▪ 4th School Board Approval of the Superintendent’s Proposed 2021-2022 School Budget at
       the Regular March School Board Meeting.
    ▪ County Administrator issues recommended budget to the Board of Supervisors.
    ▪ Board of Supervisors conduct Budget Work Sessions.
    April:
    ▪ Board of Supervisors hold Public Hearing on 2021-2022 Budget.
    ▪ Budget Approved and adopted by the Board of Supervisors.
    May:
    ▪ 7th School Board Adoption of the 2021-2022 School Budget at the Regular May School Board
       Meeting
    June/July:
    ▪ July 1st – Appropriation of Funds effective June 2021.
Page| 9

How to Use this Document
This document provides the public with extensive information about the school division and its budget.
It includes the operating budget for the 2021-2022 fiscal year and reports on the revenues and
expenditures of Cumberland County Public Schools (CuCPS). The document is divided into four sections:

Introduction
Executive Summary
Budget Detail
Supplemental Information

The sections move from the broadest level of information to the most detailed information. The
Introduction provides general information about the budget development process, guidance on how to
read and understand this budget document, and an extensive section defining terms used in the budget
process and in the document itself.

The Executive Summary provides an overview of the operating budget. This section includes
information on the characteristics of the CuCPS student population, general information about the
school division, a narrative summary of the budget and the major changes in the budget compared to
the prior year, fund statements for all CuCPS funds, and budget expenditure reports which present total
operating fund expenditures in various ways.

Revenue and expenditures are presented in detail in the Budget Detail section.

The Supplemental Information section provides additional information on formula-based budgeting
areas such as enrollment projections, employee benefits, and personnel projections. The Supplemental
Information section also includes budgets that are considered outside the operating budget for school
accounting purposes. A federal grants and special projects section show the types of grants and amount
of funds anticipated for CuCPS during FY 2021-2022.
P a g e | 10

The CuCPS Budget Structure
Public sector budgets are governed by accounting and reporting requirements established by the
Governmental Accounting Standards Board. The CuCPS budget structure complies with these
requirements.

The budget is broken into funds. Each fund is a self-balancing set of accounts reflecting the activities
operated through that fund. The funds in the CuCPS budget are:

Operating Fund: This fund includes the school division's primary revenue sources from the
Commonwealth of Virginia, Cumberland County, selected federal sources, and miscellaneous local fees,
and the expenditures charged against these revenues.

School Lunch Fund: The local and federal revenue as well as expenditures for the operation of all school
food services activities are accounted for in this fund.

Grants and Special Projects Fund: Entitlement and competitive grant monies are accounted for in this
fund. Budgeted here are federal funds from the Individuals with Disabilities Education Improvement
Act (IDEA) and the Elementary and Secondary Education Act (ESEA), No Child Left Behind, as well as
other smaller entitlement monies and competitive grants.

Within each fund, every transaction is designated as either a revenue or an expenditure activity and is
assigned an account code that provides significant reporting capability. The major units of the CuCPS
account code structure are shown below. Most of these also have detailed subsidiary units.

The project code identifies the source of funds for the activity. This could be the operating fund, or in
the case of the Grants and Special Projects Fund, the specific grant that is involved.

The cost center code identifies the revenue or expenditure as an elementary, secondary, or
administrative activity.

The site code identifies the location of the activity. These codes cover all distinct physical locations in
CuCPS, including both school and administrative sites.

The department code identifies the major and subsidiary organizational units in CuCPS. This includes
individual schools, the School Board, the Office of the Superintendent, the Office of Human Resources,
and the other organizational units.

The function code defines what type of activity is occurring with the transaction. Examples of function
areas are classroom instruction, social work services, curriculum development services, audio-visual
services, homebound instruction, nursing services, budgeting, accounting, staff recruitment and
placement, vehicle operation, building operation and maintenance, to cite just a few of the available
function codes.
The program code consists of six major areas plus detailed sub-programs. The major units are
instruction, attendance and health, transportation, operations and maintenance, administration, and
food service and other division-wide operations.
P a g e | 11

The object code is based on the Commonwealth of Virginia's object code structure and provides for a
detailed classification of the expenditure. Object codes are grouped into the major categories shown
below, with numerous subsidiary detailed codes.

Expenditure (Object) Descriptions:

Personnel:

1000 Compensation
Major groupings within the compensation codes are:

Administrative: Salaries paid to administrators for full-time and part-time work, including supplements.
Administrators include principals, assistant principals, directors, supervisors, coordinators, managers,
etc.
Classroom Instruction: Salaries and wages paid to classroom teachers for full-time and part-time work,
including supplements. Classroom teachers include K-12, core and elective, specialty, reading, special
education, ESL, dual language, talented and gifted (TAG), alternative education, and differentiated
resources teachers.

Professional Support: Salaries and wages paid to support teachers and other teacher scale positions or
full-time and part-time work, including supplements. Support positions include librarians, guidance
counselors, social workers, technology resource teachers, peer coaches, nurses, and psychologists.

Support: Salaries and wages paid to clerical, technical, custodial, and maintenance staff for full-time
and part-time work, including overtime, shift differential, supplements, and similar compensation.
Support staff includes paraprofessionals, secretaries, bus drivers, custodians, etc.

2000 Benefits
Job-related benefits provided to employees as part of their total compensation. Fringe benefits include
the employer's portion of FICA, retirement, insurance (life, health, disability income, etc.) and employee
allowances.

Non-Personnel:

3000 Purchased Services
Services acquired from outside sources (i.e., private vendors, public authorities, or other governmental
entities, including tuition payments to other school divisions for the education of students with
disabilities). Purchase of the service is on a fee basis or fixed time contract basis. Payments for rentals
and utilities are not included in this account description.

4000 Internal Services
Charges from one department of CuCPS to another for items such as food service, field trips, and
printing activities.

5000 Other Charges
Expenditures to support program operations (e.g., utilities, travel, insurance, phone charges, postage,
leases/rentals).
P a g e | 12

6000 Materials and Supplies
Articles and commodities, including textbooks, that are consumed or materially altered when used and
minor equipment that is not capitalized.

7000 Payment to Joint Operations
Not used by CuCPS.

8000 Capital Outlay
Outlays that result in the acquisition of, or additions to, fixed assets. Capital outlay includes the
purchase of replacement or additional fixed assets.

9000 Other Uses of Funds
This series of codes is used to classify transactions that are not properly recorded as expenditures of
the school division but require budgetary or accounting control. These include fund transfers and
contingency funds.
Public sector budgets are governed by accounting and reporting requirements established by the
Governmental Accounting Standards Board. The CuCPS budget structure complies with these
requirements.
P a g e | 13

                            Executive Summary of Operations and Funding
                            Request
                            “Our mission is to inspire and prepare all students with the confidence,
                            courage and competence to achieve their dreams; contribute to the
                            community; and engage in a lifetime of learning.”
       Goals
                            Our mission is anchored in developing lifelong learning and contributing to
1. Cumberland County        society. Through investment in the recruitment and retention of excellent
   Public Schools will be   personnel to work with our students, and through efficient and sustainable
   student centered.        operations, our 228 employees work every day to inspire, nurture, and
                            develop today’s students into tomorrow’s leaders and inventors.
2. Cumberland County
   Public Schools will
   expand opportunities
   that are equitable
   and collaborative
   for learning that
   empowers
   students.

3. Cumberland County
   Public Schools will
   develop committed
   stakeholders who will
   build positive
   relationships.
   Stakeholders are
   defined as students,
   faculty and staff,       We believe that our students must be competitive against national and
   parents, and             international benchmarks, and our graduates must arrive in college and the
   community members.       workplace with the skills and habits that our employers are demanding. This
                            is the heart of our business, the crux of our vision, and the core of what we
These goals will be the     do every day. Three priorities for our school division’s focus and funding
driving force that will     emerged:
continue Cumberland
County Public School’s                  ➢ Provide quality educational services, supports, and/or
forward momentum and                      opportunities for our students.
serve as the framework                  ➢ Retain and recruit qualified staff.
for the development of
the 2021-2022 Operating                  ➢ Provide staffing required for state standards, mandates,
Budget.                                     and School Board goals.
                            Investment in education today brings positive returns to our economy. So lets
                            begin with the value we delivered this year to our communities, our country,
                            our students, and our owners – the taxpayers of Cumberland County.
P a g e | 14
CuCPS Accomplishments
▪ 94.4% of students graduated on-time. We believe every student deserves to graduate with a
board-certified diploma and to graduate with their peers.
▪ 53% of our students graduated with an Advanced Studies Diploma.
▪ 25% of our graduates earned an Associate’s Degree before graduating from high school.
VSBA Showcase for Success
21st Century Learning
VDOE – High School Re-Design Grant
Communication Focus: Websites, Blogs, Twitter, Facebook, Youtube, Instagram
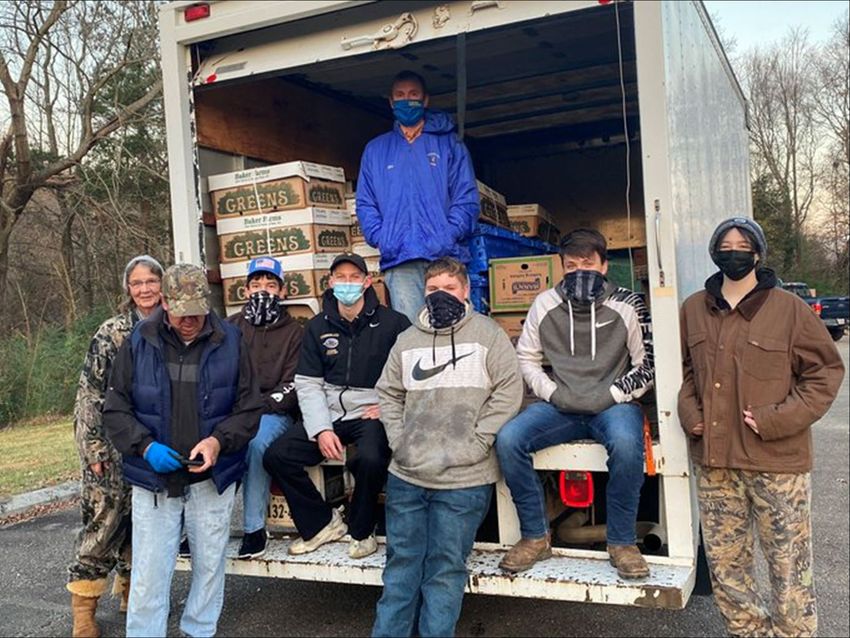
Partnered with Habitat for Humanity
Student Liaison on School Board
Regional and State Athletics Recognition
Governor’s School
Security Grant
Community Service Programs (including Betty Scales Day of Service)
Robotics Team
Virginia’s Tiered System of Supports
Band and Chorus
Theater & Forensics
WagiLabs
Code RVA
Outside CTE Opportunities
Dominion Energy Challenge
Virginia Star Program
Farm to School Grant
Virginia Living Magazine – Top High School Recognized
A thorough review of all aspects of the CuCPS budget was conducted as part of this budget cycle. The
recommendations contained in the school operating budget reflect the need to keep the focus of the
CuCPS budget on continuing our drive to become a model school division. With this focus, CuCPS will
be able to successfully fulfill its mission which is to inspire and prepare all students with the confidence,
courage and competence to achieve their dreams; contribute to community; and engage in a lifetime
of learning.P a g e | 15
Overview of Cumberland County Public Schools
Cumberland County Demographics
Cumberland County is located in the heart of Virginia's vast, rich agricultural belt. Many areas of life
within the county are influenced by our rural lifestyle. Cumberland County is the 117th largest county
in Virginia. Our citizens enjoy the many recreational activities provided by Bear Creek Lake State
Park. The State Park is conveniently located four miles from the public school campus.
As of the July 1, 2019 census, the estimated population was 9,932 people residing in the county. The
racial makeup for the county was 65.8% White and 30.5% Black or African American. 13.8% of the
population lives below the poverty level. 83.5% of residents obtained a high school diploma with 14.9%
holding a college degree.P a g e | 16
Characteristics of Cumberland County Public Schools
The demographic characteristics of the County are only partially reflected in the student enrollment in
Cumberland County Public Schools (CuCPS). There are two demographic characteristics associated with
higher risk student populations:
CuCPS special education enrollment is approximately 13% of the total student population. This is the
same as the state average of 13% but an increase for CuCPS.
Enrollment of Student with
Disabilities 2021-2022
Division Percent of Total
Cumberland 13.0%
The CuCPS cost per student is and projected enrollment for the year will be shown in the following
chart:
State and Local Per Pupil Cost
Cumberland $10,216
Projected Enrollment
Elementary 397 Pre-K 72
Middle 344
High 384
Non-Membership Sub Total 72
Membership ADM (Subtotal) 1,125 Total Enrollment 1,197P a g e | 17 The total student population is projected to be 1,197 including Pre-Kg. The chart below shows the past five years of projected student enrollment, from 2016-2017 through the current year plus the enrollment projections from the 2021 - 2022 school year.
P a g e | 18

CuCPS Organizational Structure
The CuCPS School Board hires and supervises the Superintendent of Schools. Central Office staff at
CuCPS provides leadership for the schools, instructional support units, and support services.
P a g e | 19

Summary of Revenue and Expenditures

                              FY 2022 School Operating Budget

                                        Fund Statements

Operating Fund

The FY 2022 Proposed School Operating Budget will increase by 7.9% compared to the FY 2022 Final
Approved Budget. This is due to the increase in the CARES Act funding of $1,574,809.04

Grants and Special Projects Fund
The Grants and Special Projects Fund is used to manage entitlement and competitive grant funds from
federal and state sources. Federal funds from Every Student Successes Act, the Individuals with
Disabilities Education Improvement Act and Carl Perkins Vocational and Applied Technology
Entitlement are included.

School Lunch Fund
The School Lunch Fund contains all operational revenue and expenditures for the operation of school
food service activities.
P a g e | 20
Revenue and Expenditures Summary
Food Service
Difference Difference
FY 2020-2021 FY 2021-2022 Over/Under %
Enrollment 1,180.00 1,125.00 (55.00) -4.89%
Other Funds
State School Food Service Funds 17,854.00 10,534.00 -7,320.00 -69.49%
Federal School Food Service Fund 643,985.00 791,414.00 147,429.00 18.63%
Cash/Receipts/Interest 275,004.00 256,958.00 -18,046.00 -7.02%
Total Food Service Fund 936,843.00 1,058,906.00 122,063.00 11.53%P a g e | 21
Revenue Overview: Operating Fund
In FY 2022, the primary source of operating revenue, the State Appropriation, is projected to increase
by 7.9%. Federal funds, another major funding source, is projected to increase by 39%. Together,
these two funding sources comprise 7% of all revenue projected for FY 2022.
Types of Revenue
State Funds - $10,701,162
State funding increased from $10,520,822 in FY 2021 to a State Funds
projected level of $10,701,162 in FY 2022 an increase
of $180,340 or 1.7%. Included in the funding is SOQ $7,987,511
the Academic Year Governor’s School. Incentive 1,770,954
Categorical 10,454
State funding is divided into four tiers: Standards of Quality,
Lottery 932,243
Incentive, Categorical, and Lottery Funded programs.
Total $10,701,162
Standards of Quality (SOQ) Accounts
The Standards of Quality prescribe the minimum foundation program that all public schools in Virginia
must meet. Standards are set by the state Board of Education, subject to revision only by the General
Assembly. The State Constitution gives the General Assembly the responsibility to determine the
manner in which state funds are to be distributed to school divisions for the cost of maintaining an
education program that meets the SOQ.
The General Assembly also apportions the cost of funding the SOQ between state and local
governments. Since FY 1993, the state has implemented a policy of paying 55% of the shared SOQ cost,P a g e | 22
adjusted for each locality by an equalization formula. Equalization is accomplished using the Local
Composite Index (LCI), the state's measure of local ability to pay. The LCI mathematically combines
three separate measures of local fiscal capacity into a single index, which weighs a locality's ability to
pay relative to other localities in the state. The LCI is based on true values of real estate and public
service corporations (weighted 50%), adjusted gross income (weighted 40%), and taxable retail sales
(weighted 10%), divided by average daily membership (ADM) and population. Counties and cities with
a lower composite index receive more state funding, while those with a higher index receive less.
Cumberland's current LCI is .2978.
SOQ Programs Basic Aid, the primary component of
Basic Aid $4,481,285 the SOQ, establishes standards for
State Sales Tax 1,534,486 personnel, instructional materials,
Textbooks 84,899 program and system-wide planning
Vocational Education 128,766 and management, as well as
Gifted Education 41,079 performance objectives for the
Special Education 515,064 Virginia Board of Education and local
Remediation 225,143 school divisions. Based on an ADM
VRS Retirement 606,701 projection of 1,125 students, total
Social Security 259,902 Basic Aid is estimated to be
Group Life 18,169
$4,481,285 in FY 2022. In addition to
English as a Second Language 15,117
Basic Aid, smaller amounts of SOQ
Remedial Summer School 76,540
funding are received for special
TOTAL $7,987,511
education, gifted education,
remedial summer school, social security, and group life insurance. Like Basic Aid, each SOQ account is
funded by an individual per pupil rate and equalized by the Local Composite Index (LCI) 0.2978.
Sales tax revenue is projected to be $1,534,486 in FY 2022, a decrease of 6.2% or $94,674. Of the
general 5.3 cent sales-and-use tax levied in Virginia, one cent of the amount collected is returned
directly to the local government for General Fund use and one and one quarter cents is dedicated to K-
12 education. Of the amount collected for K-12 education, one and one-eighth cents is returned to
school districts as sales tax revenue and one-eighth cent is used to fund the state's share of the
Standards of Quality (SOQ). However, when distributing the sales tax revenue to school districts, the
state equalizes the funds among the school divisions based on each locality's number of school-age
children.P a g e | 23
Incentive Programs
Funding for accounts in this grouping Incentive Programs
provides additional resources to school
Academic Year Governor’s School $615,932
divisions primarily to improve technology
At-Risk (Split Funded) 348,347
for mandated SOL testing. The total Virginia Preschool Initiative 247,266
funding for this account is $1,770,954. No Loss Funding 286,116
Additional funds for the Academic Year Community Provider Add-on Funds-Mixed 17,500
Governor’s School will be allocated in the School Meal Expansion 1,164
amount of $615,932. Technology – VPSA 154,000
Bonus Payment 100,629
Categorical Programs
Total $1,770,954
The various categorical programs focus on particular
Categorical Programs
needs of special student populations or fulfill
School Lunch $8,454
particular state obligations. State or federal law or
Special Education Homebound 2,000
regulation typically requires these programs. Included
Total $10,454
in this group are funding for homebound, and school
lunch. The total FY 2022 funding from categorical accounts is estimated to be $10,454.
Lottery Funded Programs Lottery Funded Programs
These payments from the
state are not required by law $5,683
Foster Care
but are intended to target At-Risk 254,815
resources for specific student Early Reading Intervention 37,445
or school needs statewide. In Mentor Teacher Program 900
order to receive funding from K-3 Primary Class Size Reduction 247,565
this category, each school School Breakfast 916
division must provide SOL Algebra Readiness 27,797
certification to the state that Project Graduation 5,308
Special Education-Regional Tuition 35,674
they will meet the
requirements that are unique ISAEP 8,386
to each category. Categories Career and Technical Education 3,469
of funding include at-risk Supplemental Lottery Per Pupil 0
Infrastructure and Operations Per Pupil Fund 304,285
students, pre-school
TOTAL $932,243
initiative, early reading intervention, ISAEP, primary class size reduction, SOL algebra readiness, and
others. The total FY 2022 funding from lottery funded programs is estimated to be $932,243.
Federal Funds
Federal funding is projected to be $3,572,571.04 an increase of 5.9% in FY 2022. Federal
programs are budgeted by the federal government a year in advance of actual use by localities. Actual
entitlements, however, are not known until the beginning of the school year.
CARES Act
Federal funding in the amount of $1,574,804.04 will be received by the division. The funds will be used
to fill gaps that were caused as a result of COVID-19.P a g e | 24 Local Funds Included in this category is revenue received for the operating budget. The total FY 2022 funding is $3,755,419 a decrease of $150,000 from the 2021-2022 budget. Other Funds Included in this category is revenue received for E-rate, local receipts and the Alternative School. The projected amount is $145,457.
P a g e | 25

State Revenue
P a g e | 26

Federal Revenue

Other Funds
P a g e | 27

Composition of Expenditures

              2021-2022 State and Local Expenditures
P a g e | 28 Instruction
P a g e | 29

Administration, Health, and Attendance
P a g e | 30

Pupil Transportation
P a g e | 31

Operations and Maintenance
P a g e | 32

Technology
P a g e | 33

Federal Expenditures
P a g e | 34

The Governor’s School of Southside Virginia

                                    Participating Divisions

               Amelia        Brunswick     Buckingham Charlotte           Cumberland

               Greensville   Lunenburg    Mecklenburg Nottoway            Prince Edward

                                            TBA
                                     2021-2022 Revenue

                                                                          Difference       Difference
                                         FY 2020-2021    FY 2021-2022    Over/Under             %
 Revenue
 Local                                      420,000.00      420,000.00                 -       0.00%
 State                                      569,764.00      615,932.00       46,168.00         8.10%
 Applied Carryover                          160,000.00      160,000.00                 -       0.00%
 Total Budgeting                          1,149,764.00    1,195,932.00       46,168.00         4.02%
 Contingency (LGIP)                         304,107.25      304,107.25                 -       0.00%
 Grand Total                              1,453,871.25    1,500,039.25       46,168.00         4.02%
P a g e | 35
The Governor’s School of Southside Virginia
Instruction
Difference Difference
FY 2020-2021 FY 2021-2022 Over/Under %
Enrollment - - - 0.00%
Teacher Sal ari es 522,899.00 522,899.00 - 5.34%
Longevi ty Bonus 1,000.00 1,000.00 - 100.00%
Adj unct Ins tructi on 6,000.00 6,000.00 - 0.00%
529,899.00 529,899.00 28,899.00 5.45%
FICA - Soci al Securi ty Medi care 40,400.00 40,400.00 - 3.47%
VRS - Reti rement 87,000.00 87,000.00 - 9.20%
Heal th Ins urance Benefi t 60,000.00 60,000.00 - 0.00%
VRS - Group Li fe Ins urance 7,000.00 7,000.00 - 0.00%
VRS - Reti ree Heal th Care Credi t 7,000.00 7,000.00 - 0.00%
Total Benefits 201,400.00 201,400.00 - 4.67%
Workers ' Compens ati on 3,000.00 3,000.00 - 0.00%
Travel Expens e 9,000.00 9,000.00 - -22.22%
Ins tructi onal Materi al s 35,000.00 35,000.00 - 0.00%
Purchas e Servi ces 40,000.00 40,000.00 - -50.00%
Staff Devel opment 9,416.00 9,416.00 - 4.42%
Fi el d Tri p Expens e 10,000.00 10,000.00 - 0.00%
Unempl oyment Expens e 2,000.00 2,000.00 - 0.00%
Textbooks 33,619.00 33,619.00 - -48.73%
Leas es and Rental s 3,000.00 3,000.00 - 0.00%
Capi tal Outl ay Repl acement 13,000.00 13,000.00 - -15.38%
VPSA 31,200.00 31,200.00 - 3.85%
Classroom Instruction 189,235.00 189,235.00 - -20.49%
61110 Classroom Instruction 920,534.00 920,534.00 28,899.00 -0.05%
Admi ni s trati ve Sal ary 89,000.00 89,000.00 - 2.25%
Cl eri cal Sal ary 38,500.00 38,500.00 - 1.30%
CuCPS Servi ces 3,000.00 3,000.00 - 100.00%
130,500.00 130,500.00 - 1.92%
FICA - Soci al Securi ty Medi care 10,000.00 10,000.00 - 0.00%
VRS - Reti rement 21,200.00 21,200.00 - 5.66%
Heal th Ins urance Benefi t 16,270.00 16,270.00 - 50.83%
VRS - Group Li fe Ins urance 1,710.00 1,710.00 - -16.96%
VRS - Reti ree Heal th Care Credi t 1,550.00 1,550.00 - -29.03%
Total Benefits 50,730.00 50,730.00 - 17.21%
Ins urance 7,000.00 7,000.00 - 0.00%
Purchas e Servi ces 8,000.00 8,000.00 - -87.50%
Legal Cons ul ti ng 6,000.00 6,000.00 - 0.00%
Fi nanci al Audi t 8,000.00 8,000.00 - 0.00%
Pol i cy Servi ce 1,000.00 1,000.00 - 0.00%
Admi s s i on Tes ti ng 3,000.00 3,000.00 - -66.67%
Travel 2,000.00 2,000.00 - -50.00%
Materi al s and Suppl i es 10,000.00 10,000.00 - 0.00%
Total Classroom Instruction 45,000.00 45,000.00 - -22.22%
Total Improvement of Instruction 226,230.00 226,230.00 1,230.00 -3.00%
Vehi cl e Fuel 1,500.00 1,500.00 - 0.00%
Purchas e Servi ces 1,500.00 1,500.00 - 0.00%
3,000.00 3,000.00 - 0.00%
Total Operating Budget 1,149,764.00 1,149,764.00 28,899.00 0.07%P a g e | 36
Cafeteria Revenue
Detailed Revenue Summary
Difference Difference
FY 2020-2021 FY 2021-2022 Over/Under %
Enrollment 1,180.00 1,125.00 (55.00) -4.89%
Food Service Fund:
Food Sales 155,246.00 145,000.00 (10,246.00) -7.1%
Other Food Sales - a la carte 43,000.00 35,000.00 (8,000.00) -22.9%
Other Sources - Catering 61,443.00 61,443.00 - 0.0%
Federal/Reimbursement 643,985.00 791,414.00 147,429.00 18.6%
State Lunch Reimbursement 8,082.00 9,618.00 1,536.00 16.0%
Summer Feeding Program 11,515.00 11,515.00 - 0.0%
State Breakfast Reimbursement 9,772.00 916.00 (8,856.00) -966.8%
After School Snack Reimbursement 3,800.00 4,000.00 200.00 5.0%
Total Food Service Fund 936,843.00 1,058,906.00 122,063.00 11.5%
Detailed Expenditures
Difference Difference
FY 2020-2021 FY 2021-2022 Over/Under %
Enrollment 1,180.00 1,125.00 (55.00) -4.89%
Coordinator 63,695.00 59,564.00 (4,131.00) -6.94%
Food Service Workers 177,506.00 171,946.00 (5,560.00) -3.23%
Part-time Food Service Workers 59,136.00 59,136.00 - 0.00%
Total Salaries 300,337.00 290,646.00 (9,691.00) -3.33%
FICA - Social Security Medicare 22,975.77 22,234.42 (741.35) -3.33%
VRS - Retirement 9,987.38 9,899.54 (87.84) -0.89%
VRS - Retirement (Non Professional) 12,620.68 12,208.17 (412.51) -3.38%
Health Insurance Benefit 66,960.00 74,844.00 7,884.00 10.53%
VRS - Group Life Insurance 3,159.73 3,055.93 (103.80) -3.40%
VRS - Retiree Health Care Credit 783.45 2,801.27 2,017.82 72.03%
Hybrid Disability Insurance - 82.68 82.68 100.00%
Total Benefits 116,487.01 125,126.00 8,638.99 6.90%
Travel Expense 500.00 500.00 - 0.00%
Food Supplies 505,057.43 606,834.00 101,776.57 16.77%
Repair and Maintenance 12,661.56 25,000.00 12,338.44 49.35%
Other Operating Cost 1,800.00 10,800.00 9,000.00 83.33%
Operating 520,018.99 643,134.00 123,115.01 19.14%
Total Food Service 936,843.00 1,058,906.00 122,063.00 12.06%P a g e | 37 CuCPS Employee Benefits This section explains the importance and impact of the employee benefit programs on the overall budget. Employee benefits are those ongoing fixed expenses for which the school system contributes a portion of the total cost for the employee or is mandated to contribute an additional amount. The information below summarizes the fringe benefit programs and shows how the school system's costs are determined: Federal Insurance Contributions Act (Social Security and Medicare) Participation and rates are mandated by law. CuCPS contributes 7.65% towards Social Security and Medicare benefits of the employees’ gross pay. The tax rate for the employee share of Social Security portion of FICA is 6.2%; the tax rate for the Medicare portion is 1.45%. For calendar year 2021, the Social Security taxable wage base is pegged at $142,800 and the maximum tax will be $8,853.60. There is no annual taxable wage base for the Medicare portion; all wages and taxable fringe benefits are subject to Medicare tax. Virginia Retirement System (VRS) Participation and rates are mandated by state regulations. The current employer contribution rate for administrators, teachers, clerks and paraprofessionals are16.62% of covered compensation pay. Plan members are required by state statute to contribute 5.0% of their annual covered payroll to VRS for a total of 21.62%. The current employer contribution rate for maintenance workers, custodians, cafeteria staff and bus drivers are 6.52% of covered compensation pay. Plan members are required by state statute to contribute 5.0% of their annual covered payroll to VRS for a total of 11.52%. Virginia Retirement System (Hybrid Retirement Plan) – New First Year Employees Only Participation and rates are mandated by state regulations. The current employer contribution rate for administrators, teachers, clerks and paraprofessionals is 15.62% of covered compensation pay. While 1% is invested with ICMA-RC, Plan members are required by state statute to contribute 5.0% of their annual covered payroll to VRS and the Hybrid Retirement Plan total cost of 20.62%. The current employer contribution rate for maintenance workers, custodians, cafeteria staff and bus drivers are 5.52% of covered compensation pay. While 1% is invested with ICMA-RC, Plan members are required by state statute to contribute 5.0% of their annual covered payroll to VRS and the Hybrid Retirement Plan for a total cost of 10.52%. Standard – VACorp Hybrid Disability Insurance Participation is mandatory. For FY 2022, the Disability Insurance Program rate will be 0.31% for annual covered payroll. Virginia Retiree Health Insurance Credit (VRHIC) Participation is mandatory. Eligible retired teachers and other professional school employees can receive a monthly health credit to be used towards the cost of their individual health insurance premiums. The current employer contribution rate is 1.21% of covered payroll. Now available for non-professional positions.
P a g e | 38

Group Life Insurance
Participation is mandatory. For FY 2022, the Group Life Insurance Program rate will be 1.34% for
annual covered payroll.

Hospitalization (Anthem Key Advantage 250, Anthem Key Advantage 1000 and High Deductible
Health Plan
Participation is optional. The amount contributed for employee health insurance is determined by
the school system.

Worker's Compensation
Participation is mandatory. The budgeted amount is based on an estimate of the open claims CuCPS
will pay in FY 2022.

Unemployment Compensation
Participation is mandatory. Rates are determined by the state. The school system is considered a
Reimbursable Employer. The Virginia Employment Commission invoices the school system on a
quarterly basis.

                                            Funded Fringe Benefit Rates              2022            2021
     Instructional VRS (Employer share) (Does not include RHCC - see below         16.62%           16.62%
                                      Instructional VRS (Employee share)            5.00%            5.00%
                                              Total Instructional VRS Rate         21.62%           21.62%

                         Standard Disability Insurance for Hybrid Members           .312%              .31%
                                                Group Life (Employer Share)         0.79%            0.54%
                                                Group Life (Employee Share)         0.52%            0.80%
                                           Total Group Life Insurance Rate          1.34%            1.34%

     Retiree Health Care Credit (Paid as part of the VRS per pupil amount)          1.21%            1.21%
                                             Non-Professional Support VRS           7.10%            6.52%
                                                             Social Security        7.65%            7.65%

                                    Health Care Premium (Employee Only)             $7,344          $7,344
                                 Health Care Premium (Employee & Child)            $10,008         $10,008
                                Health Care Premium (Employee & Spouse)             $8,208          $8,208
                                            Health Care Premium (Family)           $10,536         $10,356

                       Total Instructional Benefit Percent (Employer Share)        27.13%           27.13%

                            Total Non-Professional Support Benefit Percent         15.82%           15.82%

In compliance with the state mandates, all employees that participate in the Virginia Retirement System must contribute
5% towards their retirement.
P a g e | 39
Fiscal Year 2021 Salary Scales
2021-2022 Salary Scale
July 1, 2021 through June 30, 2022
Position Days 0-5 Years 6-9 Years 10-15 Years 16+ Years
Teacher** 200 42,525 45,449 48,369 57,064
Assistant Principal*** 261 70,651 76,520 82,824 91,411
Principal/Supervisor*** 261 81,237 88,259 95,541 105,541
Technology Staff 261 54,347 65,216 70,651 76,086
Curriculum & Instruction Coordinator 261 70,651 76,520 82,824 91,411
School Pyschologist-10 Month 200 54,347 59,980 66,205 74,901
School Pyschologist-11 Month 220 59,781 65,977 72,824 82,390
Speech Pathologist - 10 Month 200 54,347 59,980 66,205 74,901
Speech Pathologist - 11 Month 220 59,781 65,977 72,824 82,390
Director*** 261 86,955 94,129 101,845 112,497
Assistant Superintendent 261 95,106 99,998 108,259 119,454
Support Staff
Alternative/ISS Officer 200 38,043 41,195 44,565 49,238
Assistant Cafeteria Manager 190 13,730 15,446 17,392 20,137
Bus Driver @ 0-11 Years; 12 Plus 183 14,027 14,027 14,988 14,988
Bus Mechanic 261 27,173 32,608 38,043 45,651
Business Manager 261 39,674 44,674 50,217 58,260
Cafeteria Manager 190 18,306 20,710 23,226 26,888
Cafeteria Staff 190 11,442 12,878 14,497 16,819
Coordinator 261 54,347 58,804 63,695 70,325
Custodian 261 18,156 20,426 22,695 24,965
Paraprofessional**** 185 16,647 19,977 24,416 28,856
*School Board Clerical 261 28,804 32,500 38,151 41,412
School Clerical/Bookkeeper 261 22,826 26,087 29,891 33,695
*Denotes 14-16 Years 17 + Years 46,630
**Master's Degree $2,000
**Doctorate Degree $3,500
***Master Degree Plus 30 Hours $2,500
****Associate's Degree $1,500
****Bachelor's Degree $3,000
Bus Driver @ 0-11-$76.65 and Years; 12 + $81.90You can also read