Innovating for Improvement - Development and evaluation of a renal learning health system across inner east London.
←
→
Page content transcription
If your browser does not render page correctly, please read the page content below
Final report
December 2018

Innovating for
Improvement
Development and evaluation of a renal
learning health system across inner east
London.
Clinical Effectiveness Group (CEG), Queen Mary University of
London
About the project

Project title:
Development and evaluation of a renal learning health system across inner east London.

Lead organisation:
Clinical Effectiveness Group (CEG), Queen Mary University of London

Partner organisation(s):
Barts Health NHS Trust
London South Bank University
Tower Hamlets CCG

Project lead(s):
Dr Sally Hull, Queen Mary University of London
Dr Neil Ashman, Renal Department, Barts Health NHS Trust
Professor Nicola Thomas, South Bank University
Helen Rainey, Specialist Renal Nurse. Barts Health NHS Trust
Sec Hoong, Community Kidney Service Manager, Barts Health NHS Trust

Contents

Part 1: Abstract                                                 3

Part 2: Progress and outcomes                                    4

Part 3: Cost impact                                              13

Part 4: Learning from your project                               15

Part 5: Sustainability and spread                                19

Appendix: Resources and appendices                               24

Appendix 2: Project finance                                      26

Part 1: Abstract
Chronic Kidney Disease (CKD) affects 5% of the adults, with higher rates in multiethnic
and socially-deprived populations. Our intervention was the east London community
kidney service, serving a population of 1.2 million. Conceived as a renal learning health
system, extending across primary and secondary care, with data providing feedback to
improve the delivery of care and clinical performance.

The two innovative components include:
     •    A virtual CKD clinic, in which nephrologists can see the entire GP patient record
          (with consent) and enter management suggestions.
     •    A suite of IT tools for practices to improve identification and management of CKD.
          A novel ‘trigger tool’ alerts GPs to cases of possible CKD progression.

Major impacts include:
     •    A reduction in wait time for a specialist opinion from 64 to 5-10 days
     •    Only 20% of patients referred to the virtual clinic require a hospital appointment
     •    Significant improvements to GP identification and management of CKD.
     •    Nurse led self-management education for patients
     •    96% of GPs were satisfied with the clinical advice they received.

The project successfully negotiated engagement from all CCGs, with rapid sign on by
local practices. Our evaluation illustrates the factors which enable practices to make
effective use of IT innovations such as the CKD trigger tool.

We have also linked GP and hospital clinic data to explore the primary care predictors of
late presentation to renal dialysis.

The service is now ’business as usual’. This process was helped by the established track
record of the Clinical Effectiveness Group, and by effective hospital and CCG leadership.

Innovating for Improvement Round 5: final report                                          3
Part 2: Progress and outcomes

Intervention and innovation

This project used the concept of a learning health system to build and evaluate a
community kidney service in east London. This involves the use of anonymized patient
data to provide rapid feedback to improve the delivery and clinical performance of the
system. All 130 GP practices in the three inner east London CCGs of Tower Hamlets,
Newham and City and Hackney joined the service intervention, 37 practices in a fourth
CCG (Waltham Forest) acted as a comparison group, becoming part of the service at a
later stage.

The system wide changes to the delivery of renal care had two broad components
described below. This report focuses on evaluation of the innovative virtual CKD hospital
clinic, and the use of primary care data to improve recognition and management of CKD.
To assess the impact of the ‘trigger tools’ we adjusted our evaluation plan to include
eight semi-structured interviews with GPs and primary care staff.

Components of the east London Community Kidney Service project

1. The virtual CKD hospital clinic supports electronic referrals from GPs into a locality
     facing service. Development involved the introduction of the EMIS Web platform to
     the renal department, and sign up by all practices to a data sharing agreement to
     enable nephrologists to view the complete primary care electronic health record
     (EHR), with informed patient consent. Nephrologists document advice in the shared
     record which all GP practice clinicians can view. GPs are advised when the notes are
     reviewed by an alert within the EMIS workflow module. The clinic has a short
     response time (5-10 days) to ensure clinical advice for GPs is timely. The
     nephrologists triage the minority of patients who require further investigation into
     traditional face to face out-patient clinics. Each CCG community clinic has assigned
     nephrologists, with the aim of building clinical relationships between GPs and hospital
     specialists.

2. A package of IT tools which support practices to identify patients with CKD, ensure
     diagnostic Read coding, and encourage improvements to blood pressure and
     cardiovascular management. A renal trigger tool (see below) alerts GPs to patients
     with a falling estimated glomerular filtration rate (eGFR). The Clinical Effectiveness

Innovating for Improvement Round 5: final report                                            4
Group (CEG) provides regular practice-based facilitation, which includes training and
feedback on performance. Additional renal specific clinical facilitation, focused on
CKD management, was offered to practice teams in the lowest decile of CKD coding.
Throughout the first year of the service practice and CCG wide education aimed to
familiarize practice staff with the service.
There was a regular programme of patient education for patients referred into the
service, including group and one to one sessions.
We also undertook a case study to examine primary care characteristics and antecedent
care of the 30% of patients with end stage renal disease who start renal dialysis
unplanned.
Evaluation plan and data sources
Project Data chosen for evaluation Data sources
component
Virtual CKD clinics • Appointment numbers Care records system (CRS)
at Barts Hospital • Wait time for specialist review Care records system (CRS)
• Conversion from virtual to OPD clinic Renal department data
• Clinic outcomes Renal department data
• Attendance at patient education Renal department data
• Initial GP response to changes GP survey and interviews
• Nephrologist response to changes Interviews
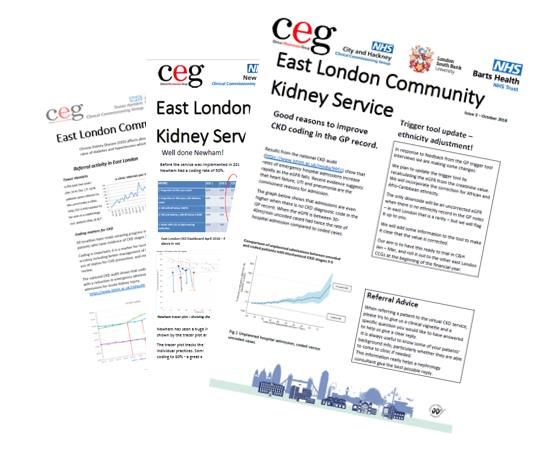
General Practice IT • % CKD cases with diagnostic Read code East London CKD dashboard
renal tools • % cases with BP to target East London CKD dashboard
• % cases on lipid lowering medication East London CKD dashboard
• GP use of renal trigger tools CCG returns, interview data
Unplanned starts to Audit of 1000 dialysis starts at Barts Health Renal department data
renal dialysis Primary care data on coding and management in Linked to
the year prior to dialysis. anonymised GP records
Data on appointment numbers, cost and type were collected from the care records
system (CRS) at Barts Health. This was supplemented by nephrology department data
Innovating for Improvement Round 5: final report 5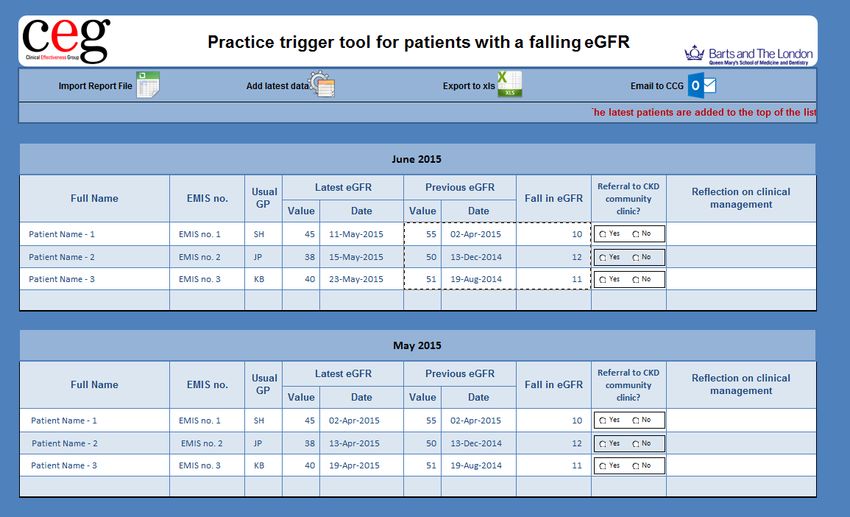
on transfers between virtual and traditional appointments, and reviews in the virtual
clinics. This data was the most difficult to access and interpret, as the virtual clinic was a
novel development.

Anonymised data on practice CKD diagnostic coding and disease management were
collected quarterly using EMIS Web at CEG. Data was collated into CCG and practice
level dashboards and shared with commissioners and practice staff. A quarterly CKD
newsletter (see appendix) provided further feedback to practices on coding performance.

                                                                       East London CKD
                                                                           Dashboard
                                                                            Jan 2017
                                                                       21,560 CKD cases,
                                                                           four CCGs

The falling eGFR trigger tool was run monthly in practices. The tool lists for GPs any
patient where the latest eGFR is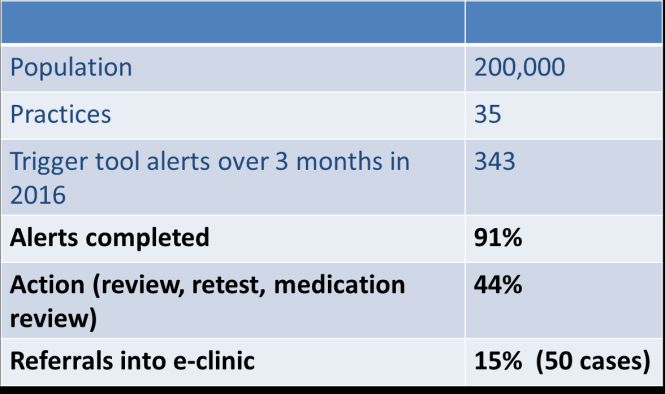
Impact of the changes following the project intervention

Impact of the virtual renal clinic
Referrals to the virtual clinic rapidly exceeded the previous rates of traditional OPD
referral. We found that less than 15% of referrals required a face-to-face appointment.
For the first time nephrologists were able to see ALL the lab tests and GP consultations.
GPs were able to get virtual advice rapidly.

                  During 2015 the average wait for a renal clinic appointment was 64 days.
                  Using the e-clinic the average time to get nephrology advice is 5-10 days.

                                GPs say…                                                       Consultants say…
                                                                                          We can provide comprehensive
                           A model for future care                                         management advice whilst
                           happening right now in                                             avoiding unnecessary
                              Tower Hamlets!                                                   duplication of tests.

First appointment in general nephrology, numbers of virtual clinic and follow-up
appointments for all participating practices in east London

                1200                                                                                              Less than 15%
                                                                                                                    of patients
                                                                                                                  require a face
                1000
                                                                                                                      to face
                                                                                                                   appointment
                 800
    Referrals

                 600                                                                                      FA General Nephrology
                                                                                                          vCKD
                 400                                                                                      Follow-Up

                 200

                   0
                       1    2   3    4   1    2   3    4   1    2   3    4   1    2   3    4    1   2
                           2014/15           2015/16           2016/17           2017/18       2018/19

Innovating for Improvement Round 5: final report                                                                            7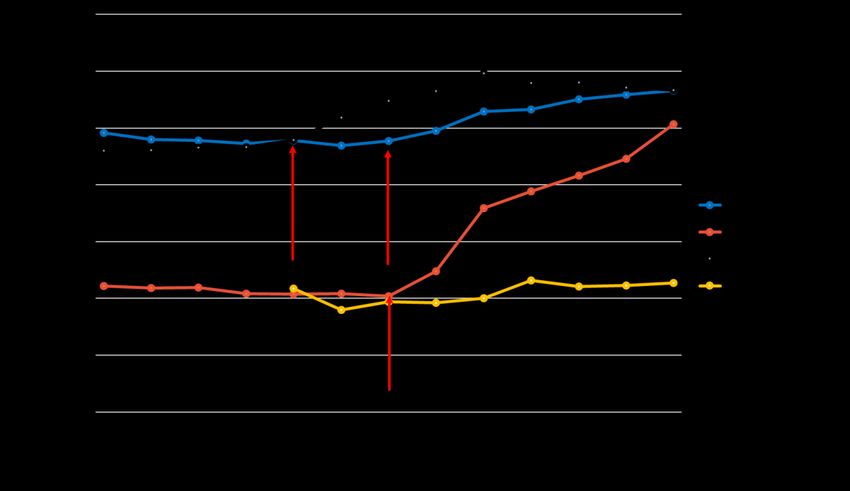
We also measured the ‘hidden work’ of virtual clinics by observing the repeated virtual
 reviews done by nephrologists. More than 30% of initial referrals had a second virtual
 review, and 30% of these had a third review. This work is not easily captured by the
 hospital system.

 Duration in days from first referral to subsequent virtual follow up clinic
 appointments for the period Apr 2017-Mar 2018 for all four CCGs (n=2955)

Third virtual review

Second virtual review

First virtual review

Initial appointment

 We used hospital data to show clinic outcomes at each virtual appointment.

 Virtual Clinic outcomes by first and follow up virtual appointment for the period
 April 2017 March 2018 for all four CCGs

 Innovating for Improvement Round 5: final report                                       8
Some patients were invited from the virtual clinic to attend nurse-led renal education and
self-management sessions. Attendance rates at the one-on-one sessions were better
than for the groups, hence these will continue.

Group education, numbers attended and DNAs

                              40
         Number of patients

                              35
                              30
                              25
                              20
                              15                                              Attended
                              10
                                                                              Did not attend
                               5
                               0
                                    1   2     3    4     1      2     3   4
                                        2016/17                 2017/18
                                                  Time period

One-on-one education, numbers attended and DNAs

                              120
                              110
                              100
    Number of patients

                               90
                               80
                               70
                               60
                               50
                                                                              Attended
                               40
                               30                                             Did not attend
                               20
                               10
                                0
                                    1   2     3     4     1     2     3   4
                                        2016/17                 2017/18
                                                  Time period

Survey data from Tower Hamlets GPs (the pilot locality) captures early perceptions of the
service. Direct patient surveys were not undertaken, patient satisfaction (see below) was
inferred from GP responses.

Innovating for Improvement Round 5: final report                                               9
GP virtual clinic survey in Tower Hamlets (28 responses from 35 practices) Impact of the practice IT tools Searches and Dashboards All three intervention CCGs showed significant diagnostic coding improvement in the year following the intervention. The CCG which started with the highest coding increased from 76% to 90% of CKD cases coded, the CCG with lowest coding rates increased from 52% to 76%. Coding improvement across 3 intervention CCGs in east London compared to the control CCG, arrows indicting start of intervention. Innovating for Improvement Round 5: final report 10
Regression for post intervention trend
 CCG                      Coding change/quarter    P value   95% confidence intervals

 Tower Hamlets            2.85%                    P
Selected quotes from the trigger tool interviews

Innovating for Improvement Round 5: final report   12
Part 3:
Cost Impact of the east London Community Kidney service

Service Commissioning

The service is commissioned by the participating CCGs in inner east London. Initially this
included Tower Hamlets –the pilot site – then extended to City and Hackney and
Newham, which are CCGs covered by CEG primary care data and facilitation services.
During the course of the project we extended to Waltham Forest CCG where renal
services are provided by Barts Health NHS trust and CEG is providing a limited package
of primary care data services.

Initial pump priming for service development came from Tower Hamlets CCG through its
involvement as part of the Vanguard scheme. Continuing funding for the service is based
on:
a) Block contracts for renal services with participating CCGs. Hence all new/changed
activity is contained within this financial envelope.
b) Continuing annual contracts between CEG and the participating CCGs, with the renal
services embedded within these contracts.

Financial evaluation/costs of service delivery

A formal economic evaluation of the project has not been done.

Exemplar costs of General Nephrology First and follow up appointments in Tower Hamlets

 Tower
                                    2015-2016                        2016-2017              2017-2018
 Hamlets CCG
                                N                  £             N               £      N           £
 First
                                     248      £80,007.28             183   £59,701.92    203    £61,056.31
 Appointment
 Follow Up                          1222 £188,224.66             1273 £197,620.52       1119 £156,066.93

Tariff for 2015-6 FA £322.61                       FUp £154.03
Tariff for 2016-7 FA £326.24                       FUp £155.24
Tariff for 2017-8 FA £300.77                       FUp £139.47

Innovating for Improvement Round 5: final report                                                    13
Cost comparison with existing services The cost of the service – when measured only by FA and FUp national tariff figures suggest that the service is cost effective from the perspective of the CCG. However it is worth considering some of the additional costs and benefits from the perspective of the different actors in the service: a) Hospital services Absolute numbers of traditional face to face OPD general nephrology appointments may fall. However there has been growth in the demand for virtual appointments. There is also a considerable amount of “hidden work” in the virtual reviews which hospital clinicians are doing on the population referred into the renal clinic. Clinic administration is more complex, and requires work across IT systems without an efficient interface. Traditional PBR tariffs are not suited to innovative cross boundary services b) Primary care services The virtual referral service was taken up rapidly by practices. However there were concerns in all CCGs about work shift – is unfunded additional work being shifted from secondary to primary care. CCGs provided various financial incentives (in the form of enhanced services) to offset this. These included funding for targets on CKD coding, funding associated with referrals and the increased patient testing and review. c) Patient perspectives (inferred from discussions with GPs) Benefits to patients include speedy assessment, less time spent at hospital OPD services, less personally funded travel time, and less ambulance/hospital transport costs. Virtual clinics are examples of ‘eco-hospital’ services, reducing carbon footprint Innovating for Improvement Round 5: final report 14
Part 4
Achieving Project Objectives

At the start of the project we set out to:
a) evaluate the innovative use of CKD population data. This included population
searches for uncoded CKD, practice/CCG dashboards to show progress in coding, BP
management and statins for CVD prevention. We also produced trigger tools to alert GPs
to cases with falling eGFR.
b) provide data driven practice based facilitation, to support practices in improving CKD
coding and management and use of IT tools.
c) produce a case study of the primary care characteristics of the 30% of patients with
unplanned starts to dialysis to stimulate change over the care pathway.

The previous sections of this report set out in detail how we have met objectives a and b.
For objective c) we have appended the abstract of a paper that is currently in process of
submission to BMJ Open titled:

Predictors of late presentation to renal dialysis: a cohort study of linked primary and secondary
care records in east London.
Authors: Ademola Olaitan, Neil Ashman, Kate Homer, Sally Hull

Enablers of success
There are several factors we can identify which have contributed to the successful
implementation of the project. These include:

i. The Clinical Effectiveness Group
https://www.qmul.ac.uk/blizard/ceg/
This primary care QI group, based in Queen Mary university, has worked with practices
and commissioning organisations across east London for more than 20 years.
Embedded in the local healthcare geography CEG has an excellent track record of QI
delivery alongside a good menu of IT tools for practices. This meant that CCGs and
practices were much more likely to sign up for the service, engage with the QI aspects of
the programme and participate in aspects of the evaluation than if it was delivered by a
commercial or relatively unknown organisation without a local track record.
It was notable that engagement was less in Waltham Forest CCG where practices have

Innovating for Improvement Round 5: final report                                              15
less knowledge of CEG, where the facilitators are less known and where the CCG has
less engagement with service planning than in the other localities.

ii. Key individuals within the renal department were able to facilitate change to build the
hospital aspects of the service. This included engagement with Barts IT department to
ensure that adoption of EMIS Web was part of trust-wide ICT strategy. Also important
was engaging with members of the renal department to encourage change to established
working practices and move to the delivery of a virtual consultation model.
These are hard changes to make, particularly in an environment of heavy workload and
staff changes. The success of this project illustrates the importance of investing in
transformative change as a solution to financial pressures within the NHS.

iii. ‘The tide of history’ was with us. More mundanely the NHS five year forward plan and
the local sustainability and transformation partnership (STP) are keen to drive new
models of OPD care with the aim of decreasing dependency on the traditional face to
face model. The renal project exemplifies these aims, and is frequently cited as an
exemplar new service.

Problems in delivery
Most of the problems related to the delivery and evaluation of the project were
predictable, but often it was a struggle to find an effective mitigation strategy. Examples
of this include:

a) Data driven facilitation
As part of our ‘learning health system’ we used data from the primary care dashboards to
identify practices which had the lowest rates of CKD coding. These were offered
facilitation by a renal specialist nurse. The difficulties we experienced were those of
contacting practices, finding the right person to talk to, making an appointment with
clinicians and enabling the clinical meetings to happen. These attempts at engagement
took far longer than expected, and sometimes failed. These are often the least organised
practices, often without a clinical lead for CVD/CKD. Some of these practices also had
the most difficulty using the virtual referral system and trigger tools to best effect.

Practices most in need of facilitation were often most difficult to access

b) Effective engagement with CCGs and local GP leads
In Waltham Forest – which has the least experience of working with CEG – the virtual

Innovating for Improvement Round 5: final report                                          16
renal service and practice dashboards were introduced with less introductory education,
and no associated enhanced service financial targets.
Some GPs in this locality see the primary care aspects of the service as an imposition
rather than a jointly negotiated QI project.

c) Pathology Laboratory
The Homerton pathology lab processes eGFR values with a range of formulae different
to the national MDRD equation used at Barts. It chooses to add a Black ethnic correction
when it has records from a patient admission. As a result the uniform calculations we
used to create our ‘falling eGFR trigger tool’ work less well in City and Hackney.
We are in process of reviewing how the tool is built to partly mitigate this problem.
We are torn between having a universal tool which can be used everywhere and having
to build tools specific to a locality.

Learning about implementation
We learned about:
The importance of local champions, in the hospital, in the CCG and in every practice to
help drive the change and help identify the difficulties cannot be overstated.
Communication, education and facilitation have to be repeated to keep a new system on
the road.

What does another locality need to know to implement a community kidney
service locally.
a) Is there a vision for change? Do the CCGs and the hospital nephrologists want this?

b) Is there a will to flex the funding system – both for hospital PBR tariffs and CCG
enhanced services?

c) Do you have one GP computer system across the patch? Working with multiple
systems is possible, but more costly and provides less flexibility – as nephrologists are
unlikely to learn more than one GP computer system.

d) How will you build the primary care searches, dashboards and trigger tools? Many
CCGs don’t have easy access to the data required for this, and the capacity to produce
up to date comparative practice data. We consider that investment in CCG and practice
IT, along with agreement on data sharing across practices to allow practice/network

Innovating for Improvement Round 5: final report                                        17
comparisons, is one of the core foundations for future learning health systems – such as
our renal service.

e) How will you evaluate the system, what is success for you?

Innovating for Improvement Round 5: final report                                   18
Part 5:
Sustainability and spread

Continuing beyond the Health Foundation funding period
Our intervention is likely to be sustained beyond the phase supported by the Health
Foundation. It will probably develop differently in the four separate CCG/localities.
However the primary care elements are underpinned by the work of CEG, and will
continue and develop unless this unit (or the CKD service within it) is decommissioned.
CEG, along with the GP practices, need to demonstrate the service value – for example
using evidence of high levels of CKD coding, and improved BP management and statin
prescribing. Understanding that effective management of CKD may also impact on other
prevalent co-morbidities – such as heart failure – where recent evidence indicates that
admissions for heart failure have strong associations with CKD, and hence are a target
for improved preventive care and admission avoidance.

The hospital service element is commissioned by the CCGs, with the service details
determined by clinicians. At present the east London CCG commissioners plan to
continue the virtual clinics and the patient education workstream.

Effective continuation is dependent on
a) Leadership within the Renal department to continue developing the virtual service and
demonstrating its value to commissioners, GPs, patients and nephrologists.
b) Ensuring that a fair funding formula is developed which recognises the activity
associated with virtual consultations.

External Interest and Recognition for the service Development
There has been considerable interest in the east London Kidney service, most coming
from other CCGs and regions as well as the BMA and NHS England.

Neil Ashman and Sally Hull have spoken to many individuals and organisations as well
as presenting at a range of events to stimulate discussion around developing similar
services elsewhere:

Innovating for Improvement Round 5: final report                                        19
Summary of Oral Presentations

 Date                        Event                                      Topic covered

 Oct 2016                    Tower Hamlets QI Seminar with Don          Working across the primary
                             Berwick                                    secondary divide in renal

 Nov 2016                    RCGP conference                            Pilot kidney service

 Jan 2017                    New models of care Symposium at RCGP       Changing the OPD model

 March 2017                  City Health Conference (RCGP)              Virtual CKD service

 April 2017                  British Renal Society                      Community kidney service

 Sept 2017                   Runner Up HSJ awards (acute sector)        Virtual CKD clinics

 Oct 2017                    North East London Clinical Senate at the   Community renal service
                             Kings Fund

 Jan 2018                    BMA council                                Virtual CKD service

 June 2018                   UK Kidney Week                             A novel approach to CKD
                                                                        education in east London

 June 2018                   UK Kidney Week                             Coding Improvement

 July 2018                   Society for Academic Primary Care          Coding Improvement

Conference posters

 WHD poster 2018
    v1.pptx
                             QMUL, William Harvey research poster 2018 “CKD coding improvement”

  SAPC Unplanned
Dialysis SAPC 2018 v1.pptx
                             SAPC GP conference 2018, “Reducing unplanned starts to renal dialysis”

Conference abstracts

SAPC Abstract 2018
CKD Coding SH.docx
                        SAPC GP conference 2018 “QI intervention to improve CKD coding”

Innovating for Improvement Round 5: final report                                                     20
Trigger Tool abstract
SAPC Madingley 2018.docx
SAPC GP conference 2019 “Evaluating the use of trigger tools”
Awards and Media interest
In September 2017 the service was runner up in the Health Service Journal awards (acute
sector)
April 2018 the service was featured in the Evening Standard review of the ‘digital healthcare
revolution’
Innovating for Improvement Round 5: final report 21In May 2018 the community kidney service won the Barts Health/QMUL Innovation award Spreading and scaling up the community kidney service Local spread The kidney service has already spread from the three inner east London CCGs (Tower Hamlets, Newham, City and Hackney) to Waltham Forest. This spread was linked to the contract which CEG now has with Waltham Forest and the delivery of renal services by Barts Health. Not all the practices in this locality use EMIS Web so the virtual clinic only has partial coverage. Barking, Redbridge and Havering CCGs are developing contracts with CEG. In time we plan to roll out the kidney service to these areas, but there are barriers to be managed: a) the variety of GP systems in these localities b) engaging the nephrologists in the referral hospitals. Other specialist departments within Barts Health have expressed interest in the service, and we have worked with them to support their objectives. National spread We have responded to numerous enquiries about how to set up a similar service. Most details of the service are available on the CEG website, and we meet and discuss with other organisations when invited. We consider that the concept is replicable – both to other areas and to other clinical services which rely heavily on test results for management decisions e.g. haematology. The exact form of virtual clinics supported by a primary care learning system are best Innovating for Improvement Round 5: final report 22
developed locally, taking account of the health service geography and context.
Whilst few CCGs can replicate the dashboards which CEG employs in east London,
there are many smaller clusters/networks of practices which can share data and develop
services with their local hospital.

Remaining milestones
We plan to publish our evaluation of the service as follows:

1. Improving coding and primary care management for people with Chronic Kidney Disease: an
observational controlled study in east London. (submitted)
Authors: S.A. Hull1, V. Rajabzadeh1, N. Thomas3, S. Hoong2, G. Dreyer2, H. Rainey2, N. Ashman2

2. Predictors of late presentation to renal dialysis: a cohort study of linked primary and secondary
care records in east London. (submitted)
Authors: Ademola Olaitan1, Neil Ashman1, Kate Homer2, Sally Hull2

3. “Make the right thing easy to do:” (in draft)
Using the electronic health record to build safety alerts for chronic kidney disease
Authors: N. Thomas, V. Rajabzadeh1, S.A.Hull

4. Developing a community renal service for east London (in draft)
Authors: S.A. Hull1, V. Rajabzadeh1, N. Thomas3, S. Hoong2, G. Dreyer2, H. Rainey2, N. Ashman2

Innovating for Improvement Round 5: final report                                                 23
Appendix 1: Resources and appendices

 Practice CKD coding improvement, Newham CCG 2016-18.
The left hand figure shows a funnel plot of practice variation in coding (each dot
representing a practice) at the start of the project. The tracer plot (on the right)
demonstrates the shift in coding achievement for all practices, with the tracers outlining
the improvement journey for the lowest performing practices.

 Word Cloud of Trigger tool reflection data.
The word cloud is a visual reprenstation of the reflection data used as part of evaluating
the CKD trigger tools. The importance of each word is shown with increasing font size.

Innovating for Improvement Round 5: final report                                      24
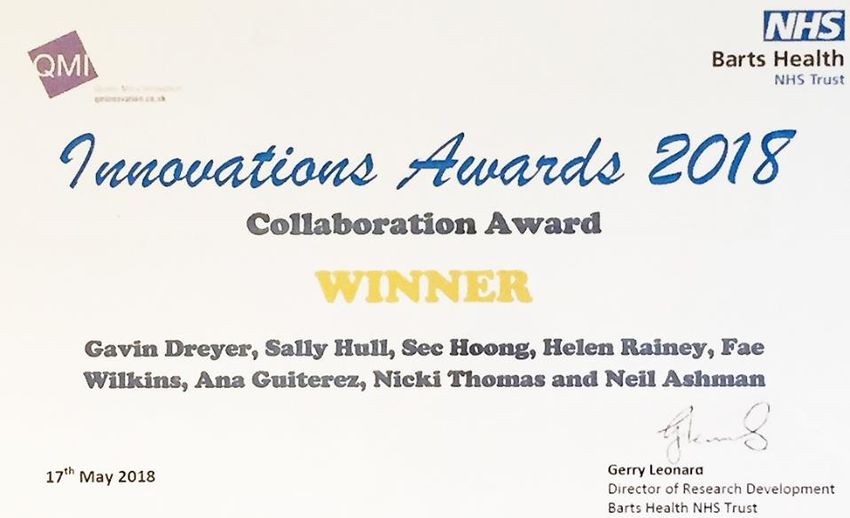
The East London Community Kidney Service newsletters.
The three newsletters distributed to practices and CCG commissioners during the
evaluation period, providing feedback to practices, CCGs and the renal department on
CKD coding performance by CCG.

Innovating for Improvement Round 5: final report                                 25
You can also read