Collection of z/OS Performance Measurement and Tuning Tips
←
→
Page content transcription
If your browser does not render page correctly, please read the page content below
Collection of z/OS Performance
                          Measurement and Tuning Tips

                                       Instructor: Peter Enrico

                                       Email: Peter.Enrico@EPStrategies.com

                                       Enterprise Performance Strategies, Inc.
                                       3457-53rd Avenue North, #145
                                       Bradenton, FL 34210
                                       http://www.epstrategies.com
           z/OS Performance            http://www.pivotor.com
        Education, Software, and
       Managed Service Providers
                                       Voice: 813-435-2297
            Creator of Pivotor®
                                       Mobile: 941-685-6789

Peter Enrico : www.epstrategies.com   © Enterprise Performance Strategies, Inc.   z/OS Performance Tuning Tips - 1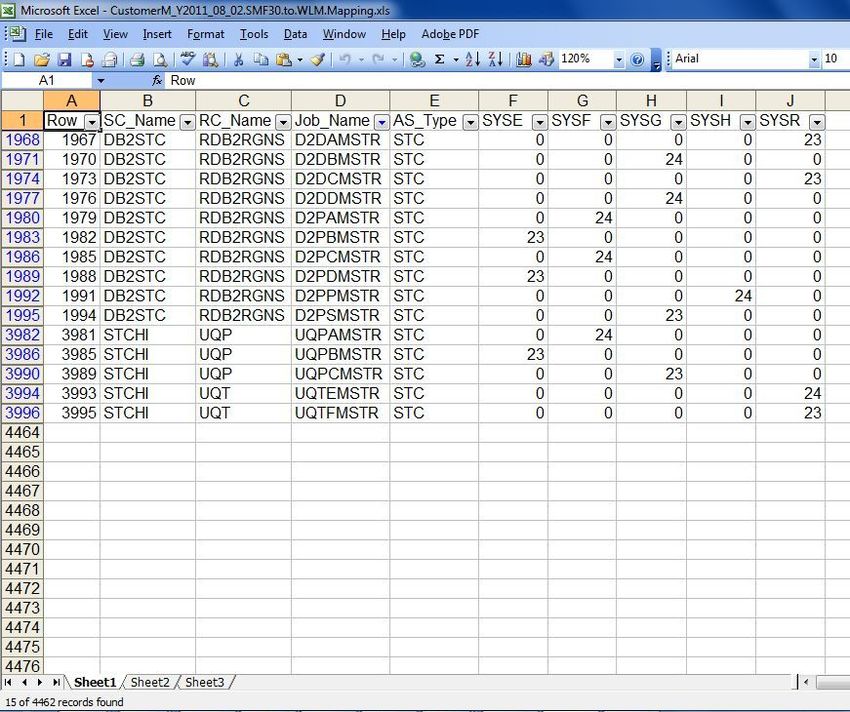
Contact, Copyright, and Trademark Notices
Questions?
Send email to Peter at Peter.Enrico@EPStrategies.com, or visit our website at http://www.epstrategies.com.

Copyright Notice:
© Enterprise Performance Strategies, Inc. All rights reserved. No part of this material may be reproduced,
     distributed, stored in a retrieval system, transmitted, displayed, published or broadcast in any form or by
     any means, electronic, mechanical, photocopy, recording, or otherwise, without the prior written
     permission of Enterprise Performance Strategies. To obtain written permission please contact Enterprise
     Performance Strategies, Inc. Contact information can be obtained by visiting
     http://www.epstrategies.com.

Trademarks:
        Enterprise Performance Strategies, Inc. presentation materials contain trademarks and registered
        trademarks of several companies.

        The following are trademarks of Enterprise Performance Strategies, Inc.: Pivotor®, Health Check®,
        Reductions®

        The following are trademarks of the International Business Machines Corporation in the United States
        and/or other countries: IBM®, z/OS®, zSeries® WebSphere®, CICS®, DB2®, S390®, WebSphere
        Application Server®, and many others.

        Other trademarks and registered trademarks may exist in this presentation
 Peter Enrico : www.epstrategies.com         © Enterprise Performance Strategies, Inc.        z/OS Performance Tuning Tips - 2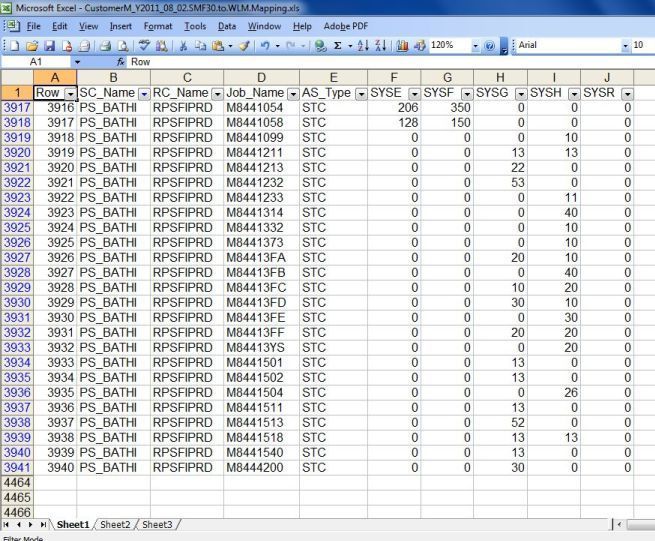
Abstract and Offer
Abstract
For the new z/OS sysprog, z/OS performance measurement and tuning can be a
big and intimidating area to explore. In the z/OS environment there is so many
measurements available, and there are so many areas to be tuned. Where should
one start to become quickly productive.
During this presentation, Peter Enrico will discuss a variety of z/OS performance
measurements and performance tuning recommendations to get any z/OS newbie
quickly productive and started on their journey to z/OS performance optimization.
Peter Enrico : www.epstrategies.com © Enterprise Performance Strategies, Inc. z/OS Performance Tuning Tips - 3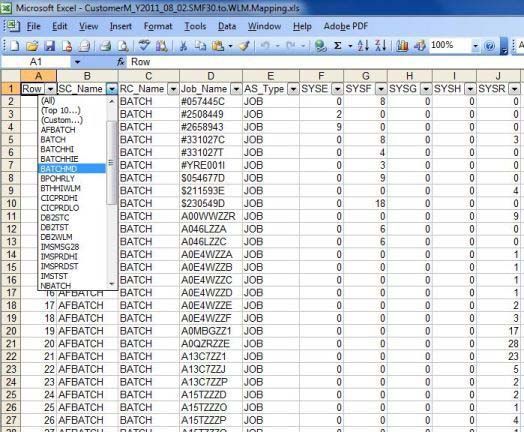
Current 2012 Class Schedule
WLM Performance and Re-evaluating of Goals
Instructor: Peter Enrico
June 11 - 15, 2012 Saint Louis, Missouri, USA
September 17 – 21, 2012 Stamford, Connecticut, USA
Essential z/OS Performance Tuning
Instructor: Peter Enrico and Tom Beretvas
September 10 –14, 2012 Minneapolis, Minnesota, USA
Parallel Sysplex and z/OS Performance Tuning
Instructor: Peter Enrico
July 17 - 19, 2012 Online
August 21 – 23, 2011 Online
z/OS Capacity Planning and Performance Analysis
Instructor: Ray Wicks
No scheduled at this time
Peter Enrico : www.epstrategies.com © Enterprise Performance Strategies, Inc. z/OS Performance Tuning Tips - 4
Presentation Overview Quick Tip – Learn to Write! Quick Tip – Learn A Top Down Approach to Performance Analysis Quick Tip – Simplify WLM Service Definitions by Removing Unnecessary Periods Quick Tip – Evaluate LPAR Weight Enforcement Quick Tip – Verify WLM Address Space Classification Quick Tip – Avoid regular directory reclaims in Coupling Facility Cache Structures Quick Tip – Understand Coupling Facility Sync CPU Spin Seconds Quick Tip – Understand Which DASD I/O Logical Volumes to Concentrate On Peter Enrico : www.epstrategies.com © Enterprise Performance Strategies, Inc. z/OS Performance Tuning Tips - 5
Quick Tip – Learn to Write!

                                      Documentation and communication are key to
                                             a performance assignment!

                                      Write reports for your management and your
                                      team to let them know what you are doing.

Peter Enrico : www.epstrategies.com               © Enterprise Performance Strategies, Inc.   z/OS Performance Tuning Tips - 6
Documentation and Communication
One of the biggest mistakes made by those responsible for performance is failure to properly
communicate
Performance personnel need to…
let others know what performance work is being done
let others know about performance findings, and to put those findings in context
let customers and management know about savings and cost
let everyone know the valuable job they are doing
Document
The problem or area of concern
A proposed solution
An estimate in savings
Try to put this value in real monetary terms
Let others know your accomplishments!
Let others know the work, accomplishments, and value being delivered by the company’s investment
in performance personnel
Peter Enrico : www.epstrategies.com © Enterprise Performance Strategies, Inc. z/OS Performance Tuning Tips - 7
Quick Tip – Learn A Top Down
                     Approach to Performance Analysis

                           Learn a logical approach to attack any performance problem:

                                               Long term analysis
                                                Capacity planning
                                      Real time performance management
                                                       Etc.

Peter Enrico : www.epstrategies.com          © Enterprise Performance Strategies, Inc.   z/OS Performance Tuning Tips - 8
Performance Analysis Fundamentals
Each should be understood in the context of computer performance
Understanding workloads and their requirements
Understanding managed resources
Understanding and managing performance objectives
Knowledge and usage of performance controls
Ability to measure, monitor, and report
Common methodologies and techniques
For Capacity Planning
For Performance Management
For Performance Analysis
For Performance Tuning
Documentation and communication
Peter Enrico : www.epstrategies.com © Enterprise Performance Strategies, Inc. z/OS Performance Tuning Tips - 9The z Performance Environment
The following is a simplified view of the z/OS performance environment
• Monitors
Monitors, Monitoring • Logs and command output
Measurement And • Measurement records
Facilities (such as SMF)
and reporters Reporting • Post Processor Reports
• Data reductions
Performance
of each z/OS Coupling Facilities,
Configuration Image / LPAR Structures, XCF, etc.
and Parameters Performance
and Workload SYS1 of Sysplex
Settings
SYS2
Performance
of each Performance
CEC of DASD I/O
Performance
of each workload Subsystem
SYSn Physical & Logical
on each system Processors
(GP, zAAPs, zIIPs)
Channel, Logical Volume
Control Unit, Cache, Etc.
Storage
Peter Enrico : www.epstrategies.com © Enterprise Performance Strategies, Inc. z/OS Performance Tuning Tips - 10Cookbook Approach to Performing a
System Performance Analysis
High level steps for revisiting your WLM setup and service definition
Step 1: Inventory Your Managed Resources
Step 2: Inventory System Workloads
Step 3: Understand Current WLM Definitions and System Parameters
Step 4: Learn How to Interpret Measurements
Step 5: Analyze the basic system resources
Processor, Storage, DASD I/O
Step 6: Analyze your WLM Service Definition and goals
Step 7: Analyze Sysplex communication and resources
XCF, Coupling Facility and Coupling Facility Structures
Step 8: Analyze your Subsystem work managers
CICS, IMS, DB2, WebSphere, MQ, etc, etc, etc…
Step 9: Analyze your applications
Step 10: Write a report
Peter Enrico : www.epstrategies.com © Enterprise Performance Strategies, Inc. z/OS Performance Tuning Tips - 11Quick Tip – Simplify WLM Service
Definitions by Removing Unnecessary
Periods
While multiple period service classes are sometimes still useful, for the most part
multiple period service classes are very 1990’s thinking.
Investigation: Determine if all periods of a multiple period service class are
necessary
Tuning: If a multiple period service class is not necessary, then simplify you WLM
service definition and performance monitoring by removing the unnecessary
periods.
Peter Enrico : www.epstrategies.com © Enterprise Performance Strategies, Inc. z/OS Performance Tuning Tips - 12Review Your Multiple Period Service Classes
Some key objectives of this evaluation include the following:
Determine if certain periods of a service class can be eliminated, or if any can be
consolidated with other periods
Does the period have enough activity to warrant its existence?
What is the justification?
Verify the usage of the last period of the service class
Many last periods are penalty periods in which transactions are never expected to run
there. If transactions do run there then there is a problem. Is the last period of the
class this type of period?
Determine the effectiveness of the duration
When a transaction transitions to a different period is it really a different type of
transaction that warrants to be managed towards a different goal?
Determine if there is enough work in a service class period to allow for effective WLM
management of the work in that period
A period may have activity, but is there enough activity for it to be effectively managed
by WLM?
Peter Enrico : www.epstrategies.com © Enterprise Performance Strategies, Inc. z/OS Performance Tuning Tips - 13Questions to Ask of Multiple Period Service Classes
Evaluate the activity of each period relative to all the other periods in the
service class.
Are there any periods that never show activity of resource consumption?
Are there any multiple period service classes mistakenly being used to run long
running work?
Note if any work is stuck in the last period of a service class.
Look to see if MPL or ENC are regularly non-zero but ended transactions is zero
Are there any transactions oriented periods that usually have no ended
transactions?
Look at the number of ended transactions for each period and determine if certain
periods just have no activity
Evaluate the CPU consumed by each period in the service class.
Are there any periods with very low activity?
If so, can this period be merged with another?
Peter Enrico : www.epstrategies.com © Enterprise Performance Strategies, Inc. z/OS Performance Tuning Tips - 14Questions to Ask of Multiple Period Service Classes
Evaluate the importance levels of each of the periods belonging to a multiple
period service class.
Are any two periods in the same service class assigned the same importance
level?
If the last period of a service class appears to be setup as a penalty period,
is there ever any activity in this period?
Given the duration of a period and the SU/Sec constant for the LPARs, are
any of the durations in conflict with the response time objectives of the
periods?
Example, assuming all service consumed by work in a period is CPU, is the CPU
time represented by the duration greater than the response time objective of the
period?
Are there any periods that consume so few resources and have so few
ended transactions they probably do not warrant a separate period?
Can any of the low activity periods be consolidated with other periods?
Peter Enrico : www.epstrategies.com © Enterprise Performance Strategies, Inc. z/OS Performance Tuning Tips - 15Example 1 Peter Enrico : www.epstrategies.com © Enterprise Performance Strategies, Inc. z/OS Performance Tuning Tips - 16
Example 1

Peter Enrico : www.epstrategies.com   © Enterprise Performance Strategies, Inc.   z/OS Performance Tuning Tips - 17
Example 1

Peter Enrico : www.epstrategies.com   © Enterprise Performance Strategies, Inc.   z/OS Performance Tuning Tips - 18
Example 2

00:01am                                            Noon                                       11:59pm

Peter Enrico : www.epstrategies.com   © Enterprise Performance Strategies, Inc.   z/OS Performance Tuning Tips - 19
Example 2

00:01am                                            Noon                                       11:59pm

Peter Enrico : www.epstrategies.com   © Enterprise Performance Strategies, Inc.   z/OS Performance Tuning Tips - 20
Example 2

00:01am                                            Noon                                       11:59pm

Peter Enrico : www.epstrategies.com   © Enterprise Performance Strategies, Inc.   z/OS Performance Tuning Tips - 21
Quick Tip – Evaluate LPAR Weight
                                Enforcement

                                Understand when weight enforcement is happening.

     Investigation: If any LPAR is regulary getting more than its weight because
     another LPAR is regularly demanding less than its weight

     Tuning: If the LPAR regularly running below its weight suddenly demands its
     weight (CPU) then it will hurt the LPAR that is regularly enjoying more than his
     weight since that LPAR will have its weight enforced.

     Maybe shift weight so assigned weights are based on regular running state.

Peter Enrico : www.epstrategies.com            © Enterprise Performance Strategies, Inc.   z/OS Performance Tuning Tips - 22
Quick Tuning Tip – PR/SM Weight Enforcement
What you need to get started:
Basic understanding of PR/SM, the LPAR configuration, LPAR weights, etc
Basic understanding PR/SM weight enforcement
Understanding of available SMF 70 PR/SM and z/OS CPU measurements
Several reporting packages
Or RMF (or CMF) Partition Data Report and RMF (or CMF) CPU Activity Report
A calculator or program to measure
Guaranteed LPAR share
Percentage of weight consumed
Delta between LPAR Utilization % and MVS Utilization %
Report to your manager
Pattern of weight enforcement
Peter Enrico : www.epstrategies.com © Enterprise Performance Strategies, Inc. z/OS Performance Tuning Tips - 23Example of RMF Partition Data Report
P A R T I T I O N D A T A R E P O R T
PAGE 2
z/OS V1R9 SYSTEM ID SYP1 DATE 08/05/2009 INTERVAL 15.00.006
RPT VERSION V1R9 RMF TIME 02.29.00 CYCLE 1.000 SECONDS
MVS PARTITION NAME LPARSYP1 NUMBER OF PHYSICAL PROCESSORS 9 GROUP NAME N/A
IMAGE CAPACITY 422 CP 6 LIMIT N/A
NUMBER OF CONFIGURED PARTITIONS 5 AAP 0
WAIT COMPLETION NO IFL 0
DISPATCH INTERVAL DYNAMIC ICF 0
IIP 3
--------- PARTITION DATA ----------------- -- LOGICAL PARTITION PROCESSOR DATA -- -- AVERAGE PROCESSOR UTILIZATION PERCENTAGES --
----MSU---- -CAPPING-- PROCESSOR- ----DISPATCH TIME DATA---- LOGICAL PROCESSORS --- PHYSICAL PROCESSORS ---
NAME S WGT DEF ACT DEF WLM% NUM TYPE EFFECTIVE TOTAL EFFECTIVE TOTAL LPAR MGMT EFFECTIVE TOTAL
LPARSP1 A 54 0 260 NO 0.0 5 CP 00.55.27.732 00.55.30.468 73.95 74.01 0.05 61.62 61.67
LPARSD1 A 12 0 35 YES 0.0 1 CP 00.07.26.536 00.07.28.786 49.61 49.86 0.04 8.27 8.31
LPARSM1 A 3 0 0 YES 0.0 1 CP 00.00.00.000 00.00.00.000 0.00 0.00 0.00 0.00 0.00
LPARSM2 A 3 0 0 YES 0.0 1 CP 00.00.00.000 00.00.00.000 0.00 0.00 0.00 0.00 0.00
LPARSP4 A 28 0 122 YES 0.0 2 CP 00.26.01.838 00.26.02.148 86.77 86.79 0.01 28.92 28.93
*PHYSICAL* 00.00.08.517 0.16 0.16
------------ ------------ ------ ------ ------
TOTAL 01.28.56.106 01.29.09.922 0.26 98.82 99.07
LPARSP1 A 54 1 IIP 00.04.47.344 00.04.47.989 31.93 32.00 0.02 10.64 10.67
LPARSD1 A 12 1 IIP 00.00.01.969 00.00.02.039 0.22 0.23 0.00 0.07 0.08
LPARSM2 A 3 1 IIP 00.00.00.000 00.00.00.000 0.00 0.00 0.00 0.00 0.00
LPARSP4 A 28 1 IIP 00.00.06.040 00.00.06.123 0.67 0.68 0.00 0.22 0.23
*PHYSICAL* 00.00.02.329 0.09 0.09
------------ ------------ ------ ------ ------
TOTAL 00.04.55.355 00.04.58.482 0.12 10.94 11.05
Peter Enrico : www.epstrategies.com © Enterprise Performance Strategies, Inc. z/OS Performance Tuning Tips - 24LPAR Configuration, LPAR Weight%
and Guaranteed Share CPs
Partition Configuration and Setup - CP Processors
Num Guaranteed
Partition Processor LPAR Partition Logical Partition % CPs of Def MSU
Number Type Name Mode Processors Weight Weight Capacity Capping Capacity
1 CP LPARSP1 SHR 5 54 54.0% 3.24 0
2 CP LPARSD1 SHR 1 12 12.0% 0.72 Y 0
3 CP LPARSM1 SHR 1 3 3.0% 0.18 Y 0
4 CP LPARSM2 SHR 1 3 3.0% 0.18 Y 0
5 CP LPARSP4 SHR 2 28 28.0% 1.68 Y 0
10 100 100% 6.00
Partition Configuration and Setup - zIIP Processors
Num Guaranteed
Partition Processor LPAR Partition Logical Partition Partition CPs of
Number Type Name Mode Processors Weight Weight Capacity Capping
1 zIIP LPARSP1 SHR 1 54 55.7% 0.557
2 zIIP LPARSD1 SHR 1 12 12.4% 0.124 Y
4 zIIP LPARSM2 SHR 1 3 3.1% 0.031 Y
5 zIIP LPARSP4 SHR 1 28 28.9% 0.289 Y
4.00 97 100% 1.00
Peter Enrico : www.epstrategies.com © Enterprise Performance Strategies, Inc. z/OS Performance Tuning Tips - 25Percentage of LPAR weight consumed
Value is not reported on any post processor report and few monitors
Need to manually calculate it
Percentage of weight consumed helps us understand:
If a partition regularly consumes more or less than its guaranteed share
If > 100% then LPAR consumed more than its guaranteed share
Example: 150% means LPAR consumed 1.5 times its guaranteed share
If < 100% then LPAR had less demand for CPU than guaranteed share
Example: 50% means LPAR only consumed 50% of its weight
Insights into if weights are being enforced
Which LPARs are competing for CPU
Reminder, when processor demand of LPARs is greater than physical CPU
capacity
Weights are enforced
Peter Enrico : www.epstrategies.com © Enterprise Performance Strategies, Inc. z/OS Performance Tuning Tips - 26What was percentage of LPAR weight consumed?
Scenario 2:
Assume SYSA had 100% demand for its 4 logical capacity
SYSB, and SYSC each had 0% demand for their logical capacity
SYSA guaranteed 50% of 4 physicals but used 100% of 4 physicals
So consumed 200% of its weight
SYSB guaranteed 25% of 4 physicals but used 0% of 4 physicals
So consumed 0% of its weight
SYSA SYSB SYSC Assume the following utilizations:
Physical | Logical | %Weight
• SYSA : 100.0% | 100.0% | 200%
• SYSB : 0.0% | 0.0% | 0%
• SYSC : 0.0% | 0.0% | 0%
====== | |
500 250 250 • Total : 100.0% | |
PR/SM
Reminder:
25% of 4 CPUs = 100% of 1 CPU
Peter Enrico : www.epstrategies.com © Enterprise Performance Strategies, Inc. z/OS Performance Tuning Tips - 27Calculating percentage of weight consumed
Calculating the percentage of weight consumed
% LPAR Weight Consumed =
((Total Physical CPU Busy %) / LPAR Guaranteed Share)) * 100
Where:
Total Physical CPU Busy %
From RMF Partition Data report
LPAR Guaranteed Share
= ((LPAR’s Weight)/(Sum all LPAR’s Weights))*100
Example: LPARSP1:
If LPARSP1 is 61.67% Total Physical Processor Busy
And is guaranteed share is 54%
Then %Weight Consumed = ((61.67%)/54%)*100 = 114.2%
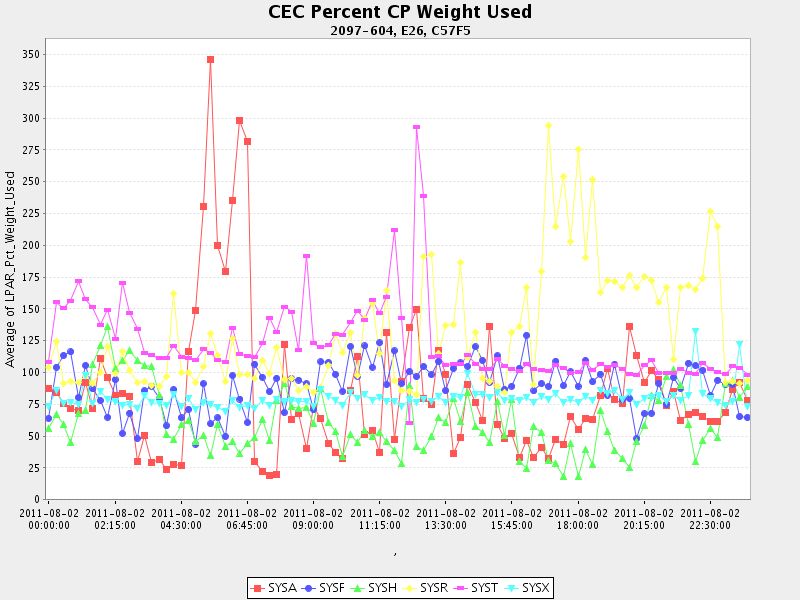
Peter Enrico : www.epstrategies.com © Enterprise Performance Strategies, Inc. z/OS Performance Tuning Tips - 28LPAR Utilization for CEC by LPAR Over
Time
Peter Enrico : www.epstrategies.com © Enterprise Performance Strategies, Inc. z/OS Performance Tuning Tips - 29Percentage Weight Enforcement Peter Enrico : www.epstrategies.com © Enterprise Performance Strategies, Inc. z/OS Performance Tuning Tips - 30
RMF CPU Activity Report - Page 1
Provides information on active processors
Configuration information
Processor Model, number of CPUs, CPU serial number
Resource usage and load calculations
Processor online time percentage
CPU Busy % - LPAR view and MVS view
I/O Interrupt activity - interrupt rate, interrupts handled by TPI
C P U A C T I V I T Y
z/OS V1R9 SYSTEM ID P01 DATE 08/05/2009 INTERVAL 15.00.0
RPT VERSION V1R9 RMF TIME 02.29.00 CYCLE 1.000 SECO
CPU 2094 MODEL 706 H/W MODEL S18 SEQUENCE CODE 00000000000D63FC HIPERDISPATCH=N/A
---CPU--- ---------------- TIME % ---------------- LOG PROC --I/O INTERRUPTS--
NUM TYPE ONLINE LPAR BUSY MVS BUSY PARKED SHARE % RATE % VIA TPI
0 CP 100.00 74.03 100.0 ------ 64.8 7.01 98.99
1 CP 100.00 74.03 100.0 ------ 64.8 6.80 99.00
2 CP 100.00 74.02 100.0 ------ 64.8 6.49 99.02
3 CP 100.00 74.02 100.0 ------ 64.8 6.69 99.04
4 CP 100.00 73.95 100.0 ------ 64.8 8402 23.06
TOTAL/AVERAGE 74.01 100.0 324.0 8429 23.30
C IIP 100.00 32.00 31.96 ------ 100.0
TOTAL/AVERAGE 32.00 31.96 100.0
Peter Enrico : www.epstrategies.com © Enterprise Performance Strategies, Inc. z/OS Performance Tuning Tips - 31LPAR Busy % vs MVS Busy % Peter Enrico : www.epstrategies.com © Enterprise Performance Strategies, Inc. z/OS Performance Tuning Tips - 32
Quick Tip – Verify WLM Address Space
Classification
Understand your WLM service definition and settings.
Investigation: Understand where your work is being classified.
Tuning: Verify where things are being classified
You will learn lots about your workloads
You will learn lots about your WLM configuration
Peter Enrico : www.epstrategies.com © Enterprise Performance Strategies, Inc. z/OS Performance Tuning Tips - 33Quick Tuning Tip – Verify WLM Classification
What you need to get started:
Basic understanding of Workload Manager, service classes, importance level, goals, etc.
Basic understanding of WLM classification rules
Understand your WLM service definition
Visit my website (www.epstrategies.com) to convert your WLM service definition to HTML
format
Understanding of available SMF 30 Address Space SMF records
You will need a SMF data reductions program
SMF 30 records to verify the classification of address spaces
Note: Different exercise to verify classification of enclaves
Make sure work is being classified as expected
If nothing else, you will learn lots about your workloads and WLM management of your
workloads
Peter Enrico : www.epstrategies.com © Enterprise Performance Strategies, Inc. z/OS Performance Tuning Tips - 34Overview of WLM Service Definition
Service Definition Workload Workload
Work coming Policy01
Into the System ONLINE SYSTEM
SC=B RC=RB SC=O RC=RO SC
Classification Rules SC=C RC=RC SC=P RC=RP overrides
to Service Class SC=D RC=RD
ASCH - - Policy02
CB SC=A RC=RA SC=M
CICS SC
Workload Workload overrides
DB2
BATCH SYSPROG
DDF
IMS SC=F RC=RF Application
SC=F RC=RG SC=N RC=RN
IWEB Environments
SC=H RC=RH
JES - SC=M AE1 AE4
SC=E RC=RE AE2 AE5
LSFM AE3
MQ Workload Workload
NETV WEB Scheduling
NEWWORK
OMVS Environments
SC=J RC=RJ SC=NEWWORK
SOM SC=K RC=RK SE1 Res01
RC=NEWMQ SE2 Res02
STC -
Service Classes RC=NEWLSFM Res03
SC=L
TSO have goals and
SYSH importance
RGRP01 RGRP02
Resource
Miscellaneous Controls Groups Minimum=100 Minimum=0
• Service Definition Coefficients Maximum=1500 Maximum=1000
• I/O Management
Peter Enrico : www.epstrategies.com © Enterprise Performance Strategies, Inc. z/OS Performance Tuning Tips - 35Understand Current WLM Definition
Understand your current WLM service definition
It is your starting point for reevaluation of goals
Items to consider:
How many and what service classes and service class periods defined
What are the goals and importance levels of the work of the periods
How do all these relate to each other?
Are report classes being used and if so, how many report classes are there?
Are there application environments or scheduling environment defined?
What are the classification rules?
Do all subsystems have classification rules
Are resource groups being used?
For what purpose
Are critical controls (such as CPU or storage being used)
Etc..
Peter Enrico : www.epstrategies.com © Enterprise Performance Strategies, Inc. z/OS Performance Tuning Tips - 36WLM Policy Editor Peter Enrico : www.epstrategies.com © Enterprise Performance Strategies, Inc. z/OS Performance Tuning Tips - 37
WLM Policy Editor

Peter Enrico : www.epstrategies.com   © Enterprise Performance Strategies, Inc.   z/OS Performance Tuning Tips - 38
Easier Way: Convert Your Service Definition to HTML
When cleaning up your service definition it may help to have it in an easy to
read and analyze format
Convert your WLM service definition to HTML for readability and reference
1. Using the WLM ISPF application:
‘File’ option at top of screen HTML
Sub option ‘Print as GML’
Creates a flat file of service definition with GML formatting tags
2. Download GML version of WLM Service Definition to workstation as text file
2. Go to www.epstrategies.com and select WLM Tool button to convert
5. Follow instructions - select file and fill in email address
6. Presto! HTML file will be emailed to you within minutes
Peter Enrico : www.epstrategies.com © Enterprise Performance Strategies, Inc. z/OS Performance Tuning Tips - 39WLM Service Definition in HTML Format Peter Enrico : www.epstrategies.com © Enterprise Performance Strategies, Inc. z/OS Performance Tuning Tips - 40
Use SMF 30 Records to Verify Classification
SMF 30 job / address space identification information
Name Description
SMF30JBN Job or session name.
SMF30PGM Program name (taken from PGM= parameter on EXEC card).
SMF30STM Step name (taken from name on EXEC card).
SMF30UIF User-defined identification field
SMF30JNM JES job identifier.
SMF30STN Step number (first step = 1, etc.).
SMF30CLS Job class (blank for TSO/E session or started tasks)
SMF30SSN Substep number. This field is set to zero for non-z/OS UNIX System
Services steps. When the z/OS UNIX System Services exec function
is requested, a new substep is begun and this value is
incremented.
SMF30EXN Program name. For a z/OS UNIX program, this contains the UNIX
program that was run or the 8 character name of an MVS program
that was run.
SMF30ASI Address Space identifier
Peter Enrico : www.epstrategies.com © Enterprise Performance Strategies, Inc. z/OS Performance Tuning Tips - 41SMF 30 Measurements to Correlate to SMF 72.3
Can also use SMF 30 WLM information to correlate measurements to the SMF 72.3
records
Name Description
SMF30TRS Number of system resources manager (SRM) transactions.
SMF30WLM Workload name.
SMF30SCN Service class name.
SMF30GRN Resource group name.
SMF30RCN Report class name.
SMF30ETC Independent enclave transaction count.
Use Service Class name and Report Class name to correlate measurements to the SMF
72.3 records
Peter Enrico : www.epstrategies.com © Enterprise Performance Strategies, Inc. z/OS Performance Tuning Tips - 42Great Exercise (for Any Workload)
Using the SMF 30 measurements, it is easy to create a cross reference
spreadsheet to gain insights into the following:
Mapping of which address spaces were active on which system and how many
intervals of time
For every address space SMF 30.2 or 30.3 record, create a CSV file that contains
Address Space Name, Service Class name, Report Class Name, and system where
address space ran.
Mapping of what programs ran
z/OS programs
Could expand to include Unix System Services programs
Etc.
Mapping of address spaces to WLM Service Classes and Report Classes
Helps with review and verification of WLM classification rules
See following slides for some examples.
Peter Enrico : www.epstrategies.com © Enterprise Performance Strategies, Inc. z/OS Performance Tuning Tips - 43Create a SMF30.2 to WLM Mapping Peter Enrico : www.epstrategies.com © Enterprise Performance Strategies, Inc. z/OS Performance Tuning Tips - 44
Example:
         Investigate Address Spaces in PS_BATHI

Peter Enrico : www.epstrategies.com   © Enterprise Performance Strategies, Inc.   z/OS Performance Tuning Tips - 45
Example:
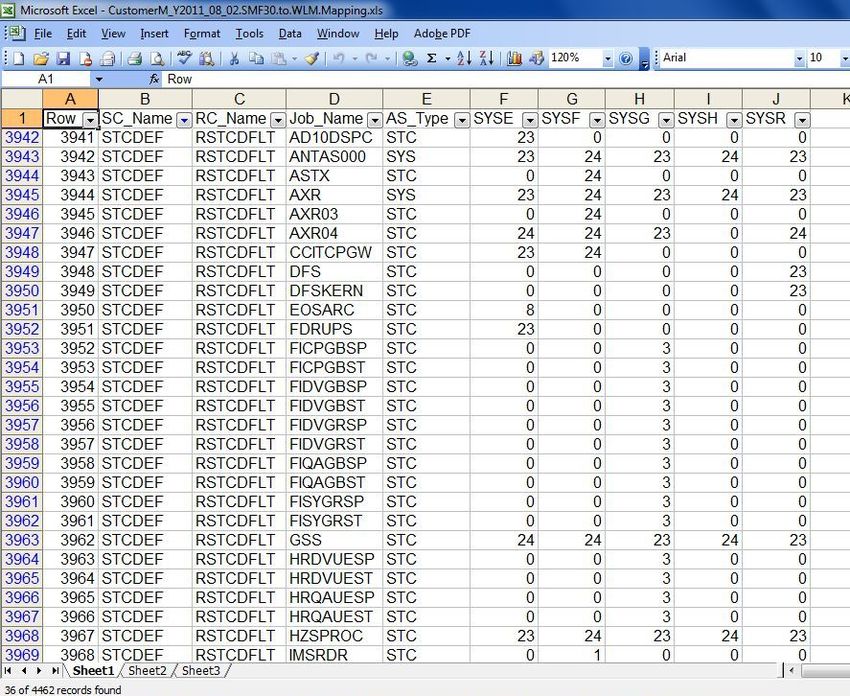
Investigate Address Spaces in STCDEF
Peter Enrico : www.epstrategies.com © Enterprise Performance Strategies, Inc. z/OS Performance Tuning Tips - 46Example:
Investigate Address Space Names Ending in MSTR
Peter Enrico : www.epstrategies.com © Enterprise Performance Strategies, Inc. z/OS Performance Tuning Tips - 47Quick Tip – Avoid regular directory
reclaims in Coupling Facility Cache
Structures
Are there your cache structures regularly going through reclaim processing?
Investigation: Determine the frequency of directory reclaims of your
coupling facility cache structures. If reclaims are regular, then direcotry area
may be too small.
Tuning: Ensure cache structure directories are large enough. May be able to
fix via autoalter or may need to enlarge the structure.
Peter Enrico : www.epstrategies.com © Enterprise Performance Strategies, Inc. z/OS Performance Tuning Tips - 48Quick Tuning Tip – CF Cache Structure
Directory Relaims
What you need to get started:
Basic understanding of the coupling environment, structures, and exploiters
Basic understanding of coupling facility cache structures and directories
Understanding of available SMF 74.4 Coupling Facility measurements
Several reporting packages
Or RMF (or CMF) Coupling facility report
Tune structure to eliminate regular directory area reclaims
May be able to use autoalter to allow for more directory entries
May need to reallocate the larger structure.
Peter Enrico : www.epstrategies.com © Enterprise Performance Strategies, Inc. z/OS Performance Tuning Tips - 49Example: Store-In Cache Structure
Most recent copy of data kept in CF cache Cache
structure and hardened to DASD later Structure
Data Directory
(Asynchronously) Entry
Writes ABC’
Local
CF cache structure contains directory Cache
entries of systems that have registered SYSA SYSB Buffer
interest in the data
Changed data stored in CF
Updated data written to DASD later by ABC ABC’
subsystem. Known as cast out processing.
Data in CF may be different than data on
DASD
Reads
Local cache buffer version of data is used Local
if local cache vector indicates that it is still Cache
valid Vector
If local cache vector indicates that local
copy is invalid, a fresh read from CF
DASD is check as last resort ABC’
Peter Enrico : www.epstrategies.com © Enterprise Performance Strategies, Inc. z/OS Performance Tuning Tips - 50Cache Structure Terminology
The cache structure in the coupling facility has two primary components
Directory Entries
Used to keep track of data entries that are shared among multiple systems
Every system that has a copy of a particular piece of shared data has a
registration entry in this portion of the cache structure.
It is this directory whose entries are used to generate cross invalidation signals
to indicate that a record in a local cache buffer may be invalid
Data Entries
Used to contain a cached version of the data
Optional
Peter Enrico : www.epstrategies.com © Enterprise Performance Strategies, Inc. z/OS Performance Tuning Tips - 51Examine the Directory Portion of Structure
Reclaims could be happening due to regular maintenance, brining down
DB2, etc. The condition being investigated in this exercise is if reclaims are
regularly happening due to the directory area being too small.
Directory Entries
Is the size too small
Forcing cross invalidates?
Forcing castout processing?
Directory Entry Reclaims
The number of times that a page name assignment required a coupling facility
directory entry to be reclaimed (stolen)
In general, it is best to have no directory entry reclaims
Usually occur due to too small directory area
If they do occur, then the are incurred in mass during a burst of activity (rather
than regular activity)
Action:
Enlarge the directory area via autoalter or creating larger structure
Peter Enrico : www.epstrategies.com © Enterprise Performance Strategies, Inc. z/OS Performance Tuning Tips - 52Any directory entry reclaims?
PRDPLEX1
Peter Enrico : www.epstrategies.com © Enterprise Performance Strategies, Inc. z/OS Performance Tuning Tips - 53For directory entries, what is the pattern of
reclaims?
PRDPLEX1
Peter Enrico : www.epstrategies.com © Enterprise Performance Strategies, Inc. z/OS Performance Tuning Tips - 54If directory entry reclaims are regularly
happening, could it be because too few directory
entries?
PRDPLEX1
Peter Enrico : www.epstrategies.com © Enterprise Performance Strategies, Inc. z/OS Performance Tuning Tips - 55Quick Tip – Understand Coupling
Facility Sync CPU Spin Seconds
What is the cost to z/OS for doing Coupling Facility synchronous requests?
Investigation: Determine how many CPU seconds were spent ‘spinning’ for
the processing of coupling facility synchronous requests.
Tuning: Ensure within guidelines; determine most expensive structure if
there is a problem.
Peter Enrico : www.epstrategies.com © Enterprise Performance Strategies, Inc. z/OS Performance Tuning Tips - 56Quick Tuning Tip – CF Host Effect Spin
Seconds
What you need to get started:
Basic understanding of the coupling environment, structures, and exploiters
Basic understanding of coupling facility synchronous request processing and its
effects on processor consumption
Understanding of available SMF 74.4 Coupling Facility measurements
Several reporting packages
Or RMF (or CMF) Coupling facility report
A calculator or program to measure the CPU cost to z/OS for executing Coupling
Facility synchronous requests
Report to your manager the cost due to Coupling Facility Synchronous spin CPU
seconds
By measurement interval for the system
By structure
Peter Enrico : www.epstrategies.com © Enterprise Performance Strategies, Inc. z/OS Performance Tuning Tips - 57Performance Analyst View of CF Resource
z/OS Processing Coupling Facility Processing
S/W processing to make CF request Link time (i.e. time on path)
Request a sub-channel CF busy processing request
Request a path
Data transfer over link
On return, S/W processing to handle CF Structures:
request - list
- lock
CEC Coupling Facility - cache
z/OS SYSA
CF Link Path 1
0
1
0
z/OS SYSB
Link Buffers
Software (z/OS, XES) CF Storage CF Processors
Subchannels
Peter Enrico : www.epstrategies.com © Enterprise Performance Strategies, Inc. z/OS Performance Tuning Tips - 58CF Synchronous Request Processing
Requesting processor spins waiting for CF request to complete
Two types of sync requests
Those that must continuously run as synchronous
Lock requests - XES spins
Those that start out as sync
But converted to async if doing so helps performance
Sync cache/list requests - XES changes to async
Delay Time
(possible)
Subchannel I Service Time
O
Subchannel P
Impacts response
time of sender, and Request
performance of
sending system
Response
Peter Enrico : www.epstrategies.com © Enterprise Performance Strategies, Inc. z/OS Performance Tuning Tips - 59Host Effect Seconds Over Time Peter Enrico : www.epstrategies.com © Enterprise Performance Strategies, Inc. z/OS Performance Tuning Tips - 60
CF Synchronous Request Processing
Synchronous requests cause the requesting CPU to spin waiting for a
response from the CF. Thus, performance is heavily dependant on a number
of factors:
Speed of requesting CPU
Larger processor will ‘waits faster’ for a response
Subchannel busy conditions
Path busy conditions
Time it takes to transmit data to the CF
CF link performance
Speed of data over link
Distance - Geographically dispersed parallel Sysplex?
Speed of CF processor
Shared LPAR?
Dedicated CF?
Peter Enrico : www.epstrategies.com © Enterprise Performance Strategies, Inc. z/OS Performance Tuning Tips - 61CF Subchannel Activity
CPU seconds consumed due to sync immediate Spin
Sync Immediate requests cause processor issuing the request to ‘spin’
How many CPU seconds did the sending LPAR spend spinning?
Logical processor unavailable to other work running in the same LPAR
Physical processor that logical processor is dispatched to is unavailable to other
LPARs
It is helpful to understand capacity consumed to these spinning conditions
CPU Seconds Spinning =
# REQ Sync *Sync Service Time
1,000 ,000
# REQ ----------- REQUESTS ----------- ------------------ DELAYED REQUESTS -----
SYSTEM TOTAL -- CF LINKS -- PTH # -SERVICE TIME(MIC)- # % OF ------ AVG TIME(MI
NAME AVG/SEC TYPE GEN USE BUSY REQ AVG STD_DEV REQ REQ /DEL STD_DEV
SYSD 29203K CBP 2 2 0 SYNC 9047K 14.6 10.9 LIST/CACHE 9714 0.0 574.3 5937
16224 SUBCH 14 14 ASYNC 20201K 47.4 215.1 LOCK 587 0.0 9.9 19.0
CHANGED 6321 INCLUDED IN ASYNC TOTAL 10K 0.0
UNSUCC 0 0.0 0.0
Peter Enrico : www.epstrategies.com © Enterprise Performance Strategies, Inc. z/OS Performance Tuning Tips - 62CF Subchannel Activity
% Effective Utilization due to sync immediate Spin
Sync Immediate requests cause processor issuing the request to ‘spin’
What % CPU utilization did the sending system spend spinning?
When a sync immediate request encounters a busy condition it results in a ‘spin’
condition
It is helpful to understand the percent of an engine (processor busy) that was
devoted to these spinning conditions
% Proc Spent Spinning =
# REQ Sync *Sync Service Time * 100
Interval Seconds *# LP *1Million
# REQ ----------- REQUESTS ----------- ------------------ DELAYED REQUESTS -----
SYSTEM TOTAL -- CF LINKS -- PTH # -SERVICE TIME(MIC)- # % OF ------ AVG TIME(MI
NAME AVG/SEC TYPE GEN USE BUSY REQ AVG STD_DEV REQ REQ /DEL STD_DEV
SYSD 29203K CBP 2 2 0 SYNC 9047K 14.6 10.9 LIST/CACHE 9714 0.0 574.3 5937
16224 SUBCH 14 14 ASYNC 20201K 47.4 215.1 LOCK 587 0.0 9.9 19.0
CHANGED 6321 INCLUDED IN ASYNC TOTAL 10K 0.0
UNSUCC 0 0.0 0.0
Peter Enrico : www.epstrategies.com © Enterprise Performance Strategies, Inc. z/OS Performance Tuning Tips - 63Same exercise could be done on a structure by
structure basis
------------------------------------------------------------------------------------------------------------------------------
COUPLING FACILITY STRUCTURE ACTIVITY
------------------------------------------------------------------------------------------------------------------------------
STRUCTURE NAME = DSNDB3G_LOCK1 TYPE = LOCK STATUS = ACTIVE
# REQ -------------- REQUESTS ------------- -------------- DELAYED REQUESTS -------------
SYSTEM TOTAL # % OF -SERV TIME(MIC)- REASON # % OF ---- AVG TIME(MIC) ----- EXTERNAL REQUEST
NAME AVG/SEC REQ ALL AVG STD_DEV REQ REQ /DEL STD_DEV /ALL CONTENTIONS
SYSA 1946K SYNC 1946K 6.7 15.6 8.4 NO SCH 0 0.0 0.0 0.0 0.0 REQ TOTAL 2226K
1081 ASYNC 0 0.0 0.0 0.0 PR WT 0 0.0 0.0 0.0 0.0 REQ DEFERRED 67K
CHNGD 0 0.0 INCLUDED IN ASYNC PR CMP 0 0.0 0.0 0.0 0.0 -CONT 67K
-FALSE CONT 16K
SYSB 3471K SYNC 3471K 11.9 12.8 7.5 NO SCH 38 0.0 11.4 4.5 0.0 REQ TOTAL 3617K
1928 ASYNC 0 0.0 0.0 0.0 PR WT 0 0.0 0.0 0.0 0.0 REQ DEFERRED 77K
CHNGD 0 0.0 INCLUDED IN ASYNC PR CMP 0 0.0 0.0 0.0 0.0 -CONT 77K
-FALSE CONT 14K
SYSC 9728K SYNC 9725K 33.5 11.9 7.4 NO SCH 10 0.0 9.2 4.6 0.0
REQ TOTAL 9643K
5404 ASYNC 2999 0.0 75.4 89.9 PR WT 0 0.0 0.0 0.0 0.0
REQ DEFERRED 80K
CHNGD 0 0.0 INCLUDED IN ASYNC PR CMP 0 0.0 0.0 0.0 0.0
-CONT 80K
-FALSE CONT 18K
SYSD 4975K SYNC 4975K 17.1 12.5 7.5 NO SCH 583 0.0 9.8 19.1 0.0 REQ TOTAL 5161K
2764 ASYNC 0 0.0 0.0 0.0 PR WT 0 0.0 0.0 0.0 0.0 REQ DEFERRED 58K
CHNGD 0 0.0 INCLUDED IN ASYNC PR CMP 0 0.0 0.0 0.0 0.0 -CONT 58K
-FALSE CONT 13K
SYSE 8928K SYNC 8927K 30.7 13.8 7.4 NO SCH 154 0.0 8.7 4.0 0.0 REQ TOTAL 7229K
4960 ASYNC 1498 0.0 93.7 82.4 PR WT 0 0.0 0.0 0.0 0.0 REQ DEFERRED 94K
CHNGD 0 0.0 INCLUDED IN ASYNC PR CMP 0 0.0 0.0 0.0 0.0 -CONT 94K
-FALSE CONT 20K
------------------------------------------------------------------------------------------------------------------------------
TOTAL 29048K SYNC 29M 100 12.9 7.6 NO SCH 785 0.0 9.7 16.6 0.0 REQ TOTAL 28M
16138 ASYNC 4497 0.0 81.5 87.9 PR WT 0 0.0 0.0 0.0 0.0 REQ DEFERRED 376K
CHNGD 0 0.0 PR CMP 0 0.0 0.0 0.0 0.0 -CONT 375K
-FALSE CONT 81K
Peter Enrico : www.epstrategies.com © Enterprise Performance Strategies, Inc. z/OS Performance Tuning Tips - 64Quick Tip – Understand Which DASD
I/O Logical Volumes to Concentrate On
What is the cost to z/OS for doing Coupling Facility synchronous requests?
Investigation: Determine the I/O Intensity and Queuing Intensity of the
logical volumes, LCUs, physical control units, and the DASDplex.
Tuning: Concentrate on tuning the logical volumes with the highest intensity
values.
Peter Enrico : www.epstrategies.com © Enterprise Performance Strategies, Inc. z/OS Performance Tuning Tips - 65Quick Tuning Tip – Calculate I/O Intensity
What you need to get started:
Basic understanding of DASD I/O subsystem environment
Basic understanding of primary I/O response time component measurements
Reported on a logical volume basis
WLM Service Class and Report Class basis
Etc.
Understanding of I/O Intensity and Queue Intensity
Several reporting packages
A calculator or program to calculate I/O intensity values
Note: Must be calculated on a DASDplex basis
In other words, never look at I/O performance a system at a time. Any logical
volume must be examined at the DASDplex level (by merging all measurements)
Concentrate on logical volumes with the highest I/O queuing intensity
Peter Enrico : www.epstrategies.com © Enterprise Performance Strategies, Inc. z/OS Performance Tuning Tips - 66Results of a Typical DASD I/O Analysis
It is always critical to do a I/O subsystem analysis
Logical volumes impacting the workloads the most
Evaluation of I/O technologies
I/O balancing
Typical SMF measurements analyzed for an I/O analysis include:
SMF 74.1 – Device Activity measurements
SMF 74.5 – Cache Control Unit measurements
These give you a DASD I/O logical volume analysis from the logical volume
point-of-view
A detailed analysis provides exceptional benefit
Peter Enrico : www.epstrategies.com © Enterprise Performance Strategies, Inc. z/OS Performance Tuning Tips - 67Ways of Looking at I/O Performance from an I/O
Subsystem Point-of-View
DASDplex level for all data
Logical Volume level
Problem logical volumes (severe and warnings)
Response Time and Queue Time component analysis, I/O Intensity and Queuing
Intensity analysis
Caching statistics
Logical Control Unit (LCU) Level
Problem LCUs (severe and warnings)
Response Time and Queue Time component analysis, I/O Intensity and Queuing
Intensity analysis
Caching Statistics
Control Unit (CU)
Problem CUs (severe and warnings)
Response Time and Queue Time component analysis, I/O Intensity and Queuing
Intensity analysis
Caching Statistics
Other
Peter Enrico : www.epstrategies.com © Enterprise Performance Strategies, Inc. z/OS Performance Tuning Tips - 68Overview of Components of I/O Response Time
DASD I/O requests and their response times
SSCH Rate - Total number of start sub-channel instructions
Can think of this as the number of DASD I/O requests
RESP - Average DASD I/O response time (ms)
CMF or RMF
I/O Data
I/O Response Time =
IOSQ
IOSQ time
+ Pend time PEND
+ Disconnect time
+ Connect time
DISConnect
Connect
Peter Enrico : www.epstrategies.com © Enterprise Performance Strategies, Inc. z/OS Performance Tuning Tips - 69DASD I/O Response Time Measurements
Measures shown are the I/O responses times broken into their four major
components
IOSQ - IOSQ time is a delay time accumulated while the I/O is still in MVS
and is waiting for a UCB to allow the I/O against the device
PEND - PEND is a delay time that usually occurs on devices with allegiance to
multiple systems, and I/O are delayed waiting for the other system to
complete its I/O
DISC - Disconnect time occurs when an I/O is being setup to complete
CONN - Connect times occurs as the data is being written out to the device.
High disconnect times occur for a variety of reasons.
DASD I/O response time = IOSQ + PEND + DISC + CONN
Peter Enrico : www.epstrategies.com © Enterprise Performance Strategies, Inc. z/OS Performance Tuning Tips - 70Intensity
When it comes to I/O many analysts make the mistake on concentrating on
the following:
Poor I/O response times
Logical volumes with the most activity
It is better to look at the calculated Intensity values
A great measurement to gain insight into what component / workload to
concentrate your analysis on
Intensity = (Rate) * (Average Response Time)
Example: I/O Intensity = (I/O Rate) * (CONN + DISC + PEND + IOSQ)
Example: Queuing Intensity = (I/O Rate) * (DISC + PEND + IOSQ)
Peter Enrico : www.epstrategies.com © Enterprise Performance Strategies, Inc. z/OS Performance Tuning Tips - 71Calculating I/O Intensity and Queue
Intensity
Evaluating I/O performance based mainly on I/O response times is insufficient
Must take I/O rate into consideration
Since frequency of I/O influences the impact of the I/O response times
intensity is a useful measure of the impact I/O may be having on the system
I/O Intensity = (I/O Rate) * (Average I/O Response Time)
Queue Intensity = (I/O Rate) * (Average I/O Response Time – CONN Time)
Intensities can be calculated for
Logical Volumes (on DASDplex basis)
Control Units
LCUs
Service Class Period, Service Class, Report Class, Workload, WLM Service Policy (or system)
Etc.
Regularly monitor
Peter Enrico : www.epstrategies.com © Enterprise Performance Strategies, Inc. z/OS Performance Tuning Tips - 72Why calculate intensity values?
Common I/O guideline: DASD I/O response times should be 3 milliseconds
or below (on average)
Example 1:
Logical volume TSO001 has a 18 ms I/O response time with 10 I/Os per second
CONN = 12, DISC = 5, PEND = 2, and IOSQ = 1
I/O Intensity = (18 ms) * (10 I/O per second) = 180
I/O Queue Intensity = (6 ms) * (10 I/O per second) = 60
Example 2:
Logical volume DBA022 has a 4 ms I/O response time with 1000 I/Os per second
CONN = 1, DISC = 2.5, PEND = 0.5, and IOSQ = 0
I/O Intensity = (4 ms) * (1000 I/O per second) = 4000
I/O Queue Intensity = (3 ms) * (1000 I/O per second) = 3000
Peter Enrico : www.epstrategies.com © Enterprise Performance Strategies, Inc. z/OS Performance Tuning Tips - 73Example: Note Top LVs based on I/O Response Time Peter Enrico : www.epstrategies.com © Enterprise Performance Strategies, Inc. z/OS Performance Tuning Tips - 74
Example: Note Top LVs based on I/O Intensity

Peter Enrico : www.epstrategies.com   © Enterprise Performance Strategies, Inc.   z/OS Performance Tuning Tips - 75
Example: Note Top LVs based on I/O Queue Time

Peter Enrico : www.epstrategies.com   © Enterprise Performance Strategies, Inc.   z/OS Performance Tuning Tips - 76
Example: Note Top LVs based on I/O Queue Intensity

Peter Enrico : www.epstrategies.com   © Enterprise Performance Strategies, Inc.   z/OS Performance Tuning Tips - 77
Presentation Summary Quick Tip – Learn to Write! Quick Tip – Learn A Top Down Approach to Performance Analysis Quick Tip – Understand Your Workloads Quick Tip – Evaluate LPAR Weight Enforcement Quick Tip – Verify WLM Address Space Classification Quick Tip – Avoid regular directory reclaims in Coupling Facility Cache Structures Quick Tip – Understand Coupling Facility Sync CPU Spin Seconds Quick Tip – Understand Which DASD I/O Logical Volumes to Concentrate On Peter Enrico : www.epstrategies.com © Enterprise Performance Strategies, Inc. z/OS Performance Tuning Tips - 78
You can also read