SBTs for Chemical Companies - February 6, 2020 SBTi-Chemicals Scoping Project Launch Webinar - Science Based Targets
←
→
Page content transcription
If your browser does not render page correctly, please read the page content below
SBTs for Chemical
Companies

February 6, 2020
SBTi-Chemicals Scoping Project Launch Webinar

Welcome!
This webinar is being recorded. Slides
and recording will be posted to our
website. They will also be emailed to
you.
There will be time for questions at
multiple points throughout the
webinar.
Please type your questions into
the Q&A box.

                                         2
Today’s Speakers

       Nate Aden                 Salla Sulasuo               Peter Levi                 Michiel Stork
      Senior Fellow           Global Climate Lead          Energy Analyst             Associate Director
     Naden@wri.org          Salla.sulasuo@dsm.com         Peter.levi@iea.org      Michiel.stork@navigant.com
World Resources Institute         Royal DSM         International Energy Agency          Guidehouse
Today’s Discussion

                           Topic                   Time

  SBT-Chemicals introduction and overview           5 min
  Chemical company leadership examples              5 min
  Royal DSM company perspective                    10 min
  IEA chemical sector resources                    15 min
  Dutch & German chemical sector roadmaps          15 min
  Next steps and opportunities for participation   10 min
Science Based Targets initiative

                  The Science Based Targets initiative mobilizes companies to
                     set science-based targets and boost their competitive
                    advantage in the transition to the low-carbon economy.
What are science-based targets?

 “GHG emissions reduction targets that are consistent with the level of decarbonization that, according to
 climate science, is required to keep global temperature increase within 1.5 to 2ºC compared to pre-industrial
 temperature levels.”

                                                                  •   SBTs are consistent with the long-term
                                                                      goal of reaching net-zero emissions in
                                                                      2nd half of century
                                                                  •   Timeframe drives short-term action
                                                                      and enables accountability (5-15 years)
SBTi’s 3-pillar strategy

                                                          STRATEGIES

                                                   Institutionalize the adoption of
       Reduce the barriers to the adoption
                                                  science-based emission reduction            Create a critical mass
            of science-based targets
                                                               targets

                                                           ACTIVITIES

                            Methods              Target setting      Engaging             Validating         Call to Action
       SDA method
                            and tools               manual           amplifiers            targets             platform

                                             800 330 ~ 3
                                             Companies & FIs        Companies         Companies joining
                                               have formally       have approved       the Call to Action
                                              joined the SBTi         targets             every week
                                               Call to Action
SBTi criteria
The SBTi uses 5 core criteria to assess              3. Level of ambition
company targets                                      At a minimum, the target will be consistent with the
                                                     level of decarbonization required to keep global
1. Boundary                                          temperature increase to well-below 2°C compared to
Covers company-wide scope 1 and scope 2 emissions    pre-industrial temperatures, though we encourage
and all GHGs as required in the GHG Protocol         companies to pursue greater efforts towards a 1.5°
Corporate Standard.                                  trajectory.

2. Timeframe                                         Intensity targets are only eligible when they lead to
Commitment period must cover a minimum of 5          absolute emission reductions in line with climate
years and a maximum of 15 years from the date the    science or when they are modelled using an approved
target is submitted for an official quality check.   sector pathway or method (e.g. the Sectoral
                                                     Decarbonization Approach).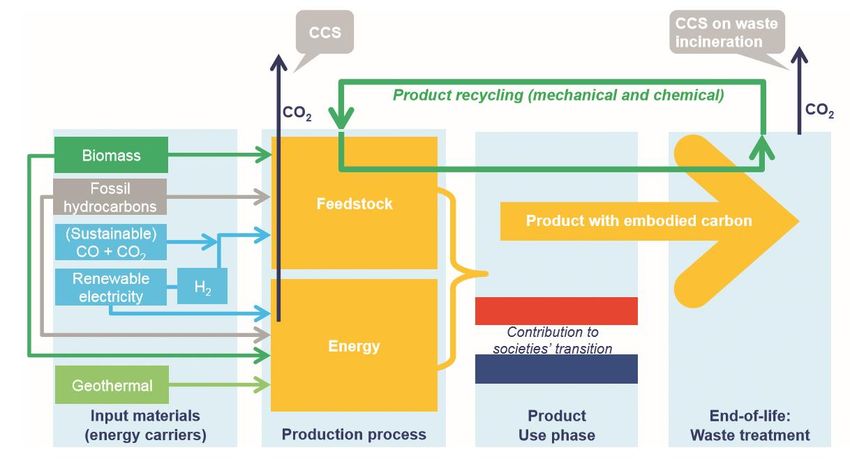
SBTi criteria
4. Scope 3                                               5. Reporting
Companies must complete a scope 3 screening for all      Disclose GHG emissions inventory on an annual
relevant scope 3 categories in order to determine        basis.
their significance per the GHG Protocol Corporate
Value Chain (Scope 3) Accounting and Reporting
Standard.

An ambitious and measurable scope 3 target with a
clear time-frame is required when scope 3 emissions
cover a significant portion (greater than 40% of total
scope 1, 2 and 3 emissions) of a company’s overall
emissions.

The target boundary must include the majority of
value chain emissions as defined by the GHG
Protocol Corporate Value Chain (Scope 3)
Accounting and Reporting Standard
                                                          Source: GHG Protocol Scope 3 Standard
                                                          http://www.ghgprotocol.org/standards/scope-3-standard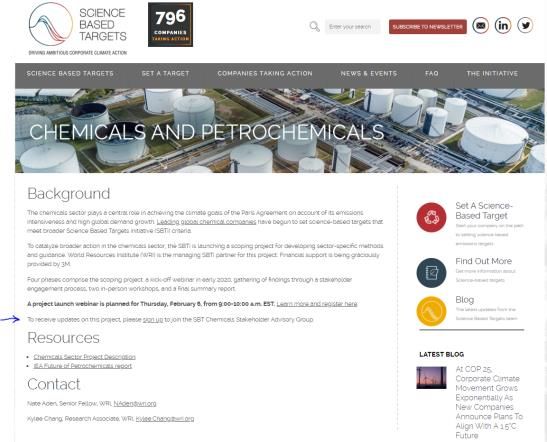
Science-based targets for chemicals companies
The SBTi is launching this project to better
understand challenges to setting SBTs
using existing methods. The project will
recommend options for revising these
methods and developing guidance in light
of current barriers and existing resources.

The project audience includes chemical
companies, industry associations, and other
stakeholders.

WRI gratefully acknowledges financial
support from 3M for this project.
SBTi chemicals scoping process

           Winter                         Spring                  Summer                    Fall
                                           Scoping               Feedback                 Summary
       Project Launch                     Summary                Workshops                 Report

                                  Jan   Feb   Mar    Apr   May   Jun   Jul   Aug   Sep   Oct   Nov   Dec

Scoping interviews and research

                    Workshops

              Summary Report
A global group of 20 chemicals companies have committed to setting SBTs
• Air Liquide Group • Orbia Advance Corporation
• S.A. AkzoNobel S.A.B.
• Borregaard AS • Polygenta Technologies Limited
• Croda International Pl • PTT Global Chemical
• Ecolab • Reliance Chemical Products Ltd.
• Group Fu Plastic Co., Ltd • Royal DSM
• Gujarat Fluorochemicals Ltd. (GFL) • Sekisui Chemical Co., LTD
• International Flavors & • Sumitomo Chemical Co.,
Fragrances Inc. Ltd.
• LOTTE Chemical Corporation • Syngenta
• Novozymes AS • Tata Chemicals Limited
• Univar Solutions
*List as of February 2020; for additional information see https://sciencebasedtargets.org/companies-taking-action/Seven companies have set Science Based Targets
Target
Company HQ Method used Date Set Targets Scope 3 Categories included in target
Classification
• Absolute targets: Novozymes commits to reduce absolute Scope 1 &
2 GHG emissions by 50 % by 2030 from a 2018 base year.
• Absolute targets: Novozymes commits to reduce absolute Scope
Absolute 3 GHG emissions from purchased goods and services by 15 % by
Novozymes A/S Denmark 1.5C Sep 2019 • Purchased Goods and Services
Contraction 2030 from a 2018 base year.
• Renewable energy procurement targets: Novozymes commits to
increase annual sourcing of renewable electricity from 37% in
2018 to 100% by 2030
• Absolute targets: Borregaard AS commits to reduce absolute Scope
• Purchased goods and services, Capital goods, Fuel and
1 and 2 GHG emissions 53% by 2030 and 100% by 2050 from a 2009
energy related activities, Upstream transportation and
base-year*
Absolute distribution, Waste generated in operations, Business
Borregaard A/S Norway WB2D Jul 2019 • Absolute Scope 3 GHG emissions by 30% by 2030 and 75% by 2050
Contraction travel, Employee commuting, Downstream transportation
from a 2017 base-year.
and distribution, Processing of sold products, End-of-life
*The target boundary includes biogenic emissions and removals
treatment of sold products
associated with the use of bioenergy.
• Absolute targets: International Flavors & Fragrances, Inc. commits to
reduce absolute scope 1 and 2 GHG emissions 30% by 2025, from a
International
Absolute 2015 base-year. International Flavors & Fragrances, Inc., also • Purchased goods and services, Upstream transportation &
Flavors & United States WB2D Jun 2018
Contraction commits to working with its suppliers (representing 70% of its supply distribution, Business Travel
Fragrances Inc.
chain emissions) so that they set their own science-based targets
and report annual emissions by 2025.
• Purchased goods and services, Capital goods, Fuel and
energy related activities, Upstream transportation and
• Intensity targets: Syngenta AG commits to reduce scopes 1, 2 and 3 distribution, Waste generated in operations, Business
Syngenta Switzerland WB2D Intensity Oct 2019 GHG emissions 67.6 % per $ Value Added by 2030 from a 2016 base travel, Employee commuting, Upstream leased assets,
year. Downstream transportation and distribution, Processing
of sold products, End-of-life treatment of sold products,
Downstream leased assets
*List as of February 2020; for additional information see https://sciencebasedtargets.org/companies-taking-action/Seven companies have set Science Based Targets
Target
Company HQ Method used Date Set Targets Scope 3 Categories included in target
Classification
• Absolute targets: DSM commits to reduce absolute Scope 1 & 2 GHG emissions 30% by 2030 from a
Intensity & 2016 base-year. • Purchased goods are services, Upstream
Royal DSM Netherlands 2C Absolute Mar 2019 • Intensity targets: DSM commits to reduce Scope 3 GHG emissions from “purchased goods & transportation and distribution, Waste
Contraction services”, “waste generated in operations” and “upstream transportation and distribution” with at generated in operations
least 20 % per ton of sold product by 2030 from a 2016 base-year.
• Absolute targets: Japanese multinational chemical company Sumitomo Chemical commits to
reduce absolute Scope 1+2 GHG emissions 30 % by 2030 and reduce more than 57% by 2050 from a
Sumitomo
Absolute 2013 base-year while actively providing solutions to the value chain for developing a sustainable • Purchased goods and services, Capital goods,
Chemical Co., Japan 2C Oct 2018
Contraction low carbon society. Fuel and energy related activities
Ltd.
• Sumitomo Chemical also commits that 90 % of its suppliers by weight-base will institute GHG
reduction targets with science-base by 2024.
Sekisui • Absolute targets: SEKISUI CHEMICAL CO., LTD. commits to reduce absolute Scope 1and 2 GHG
Absolute • Purchased goods and services, Use of sold
Chemical Co., Japan 2C Jun 2018 emissions 26 % by 2030 from a 2013 base-year, and reduce absolute Scope 3 GHG emissions 27 %
Contraction products
Ltd by 2030 from a 2016 base-year.
Aggregated Base Year Emissions (tCO2e) of Seven Approved Companies
Scope 1 Scope 2 Scope 3
10,010,953 3,431,518 25,713,481
*List as of February 2020; for additional information see https://sciencebasedtargets.org/companies-taking-action/Q&A
Purpose led,
performance driven.
Creating Brighter
Lives for all.

Salla Sulasuo, Global Climate Lead
For Internal Use Only

DSM at a glance
Royal DSM: a company with a purpose

                                     Animal Nutrition   •   Sales ~€8.9bn (7% growth in 2018)
                                        & Health
                                                        •   EBITDA €1,532m (6% growth in 2018)
                                                        •   ROCE 13.3% (up 100bps)
Materials
                                                        •   Global company with 65% of sales outside
                                                            Europe
                                                        •   Highly engaged workforce: ~23,000
                                                            employees
                                                        •   Intrinsically innovative company: 19% sales
                                                            from innovation
                                                        •   ~ 43% sales from high-growth economies
               Human Nutrition & Health
            Food Specialties & Personal Care
                                                        •   Strategy well aligned with the Sustainable
                                                            Development Goals
For Internal Use Only
Purpose drives growth opportunities
Our competences Provide growth Creating a growth With targets
and purpose… opportunities in the focus company… that underpin
domains… our mission.
A science-based company OUR 2019-2021 TARGETS:
in health, nutrition and
sustainable living:
Company growth High single-digit
percentage annual
Adj. EBITDA increase
+ Nutrition
& Health
Climate
& Energy
~10% average annual
Adj. Net Operating
Free Cash Flow increase
+
Resources &
Mega Circularity
Trends
Sustainable
Value-creating M&A
LivingFor Internal Use Only
DSM Climate and Energy Agenda Nutrition Climate &
& Health Energy
Resources &
Circularity
Improve. Enable. Advocate.
Reach NetZero emissions by We enable low carbon Stanyl®: high performance Advocate accelerated climate
2050; realize -30% GHG economy. Through our range of polyamide used for example action and system
reduction for scope 1&2 in solutions, we help our in automotive applications. transformation creating
absolute terms and -28% per customers to reduce their GHG While cutting down engine markets in which low-carbon
ton product for scope 3 emissions. With animal nutrition friction it contributes to products can thrive, with a focus
(compared to 2016), via solutions like Bovaer® from our reducing emissions. on renewable energy and
energy efficiency, 75% Project Clean Cow, we help to carbon pricing.
renewable purchased significantly reduce methane
electricity and stimulated by emissions from cows.
an internal carbon priceOur target setting journey
• Strong climate focus for several years with vocal advocacy
efforts supporting ambitious climate policies in the lead up to
COP21 in 2015
• We already had targets we thought were ambitious -clear
wake-up call when we realized the difference in ambition from
SBT approach
– All sectors have to play a part in reducing emissions
– “DSM’s science based targets represent our fair share”
• Internal process for SBT’s lasted for about a year, Scope 1&2
targets “approved” much earlier and published along with
new strategy in June 2018
– Extensive upfront mapping: what is possible from feasibility
studies, costs and resource perspective
• Final targets (including Scope 3) reviewed and approved by
the Science Based Targets Initiative in February 2019, as first
company in our sector in EuropeLong-term target:
DSM’s Science Based Targets NetZero emissions by
2050
• Our approved targets:
– Reduce absolute scope 1 and 2 GHG emissions 30% by
2030 from a 2016 base year.
– Reduce scope 3 GHG emissions from purchased goods
and services, upstream transportation and distribution
and waste generated in operations by 28% per ton of
product produced by 2030 from a 2016 base year.
– Target update process aligned with our strategic cycle
30% 28%
Emissions reduction Value chain
and internal process from operations emissions
• We are effectively decoupling emissions from reduction
economic growth and simultaneously working with
a long-term pathway to NetZero GHG emissions
In absolute terms Per ton of product
across value chains by 2050, aligned with the 1.5°C
by 2030 vs. 2016 by 2030 vs. 2016
ambitionFor Internal Use Only
Progress to date...
• Strong leadership from top management from the
beginning for robust process and financial resources to
deliver
• Deep-dives, short-, mid-, and long-term roadmaps for
sites conducted throughout 2019:
– Identify further opportunities and requirement
(technologies, costs, resources)
– Socialize learnings from all sites, internal engagement
• Supportive processes and complementary targets
– On the road to RE100, 75% of purchased electricity
renewable by 2030 (already 50% achieved in 2019)
– Internal Carbon Price (50€/tCo2e) & carbon neutral
investment rules within Business Groups
• Scope 1&2 reductions at this point mostly driven by fuel
switching and efficiency improvements
(with detailed focus on structural improvements)For Internal Use Only
...involves addressing challenges
• Finalizing our scope 3 target was a long process
– Scope 3 (especially category 1) covers the vast majority of DSM’s
total emissions
– CO2REDUCE program focusing on the most CO2 intensive
materials, engagement with 200 priority suppliers (70% of Scope
3), shared learnings, product level data collection and identifying
new opportunities
– As an intermediate producer, some downstream categories (use
and processing) excluded from inventory as per GHG protocol
guidance
– Some assumptions on external environment accelerating our
suppliers efforts to reduce emissions
– Impact from GHG protocol methodology update tbc
• New due diligence in acquisitions
• Target review process
• Customer engagement on how we can support them to meet
their SBT’s
• Predictable and ambitious policies are needed to create
systemic change – no one can succeed aloneFor Internal Use Only
Q&A
The Future of Petrochemicals
Peter Levi, Energy Technology Policy Division
SBTi Chemicals Launch Webinar, February 2020

IEA 2020. All rights reserved.
Exploring key “blind spots” in global energy

The IEA is shining a light on areas of the energy system that do not garner as much attention as they deserve.
Petrochemicals are all around us
The importance of petrochemicals in oil and gas demand

                   Primary oil demand (2017)                Primary gas demand (2017)

                        12%     14%                             12%    8%               Chemicals
                   8%                 5%                                                Power
                                        5%                21%                           Other Industry
                                                                              40%
                                                                                        Transport
                                                                                        Buildings
                                                          4%
                          56%                                   15%                     Other

Today, petrochemicals account for 14% of global oil, and 8% of global gas demand.
Petrochemical products have been growing fast
Production growth for selected bulk materials and GDP
1 200
Steel
1 000
Index (1971 = 100)
Aluminium
800
600 Cement
400 GDP
200
Plastic
1970 1975 1980 1985 1990 1995 2000 2005 2010 2015
Demand for plastic has grown faster than for any other bulk material, nearly doubling since the millennium.“Feedstocks” fly under the radar
Petrochemicals take an environmental toll

                                                      Global final energy demand and direct CO2 emissions by sector in 2017

                                  1 500                                                                             2500

                                                                                                                           Direct CO2 emissions (MtCO2/yr)
     Final energy demand (Mtoe)

                                  1 200                                                                             2000

                                                                                                                                                             Final energy demand
                                   900                                                                              1500

                                                                                                                                                             DirectCO2 emissions
                                   600                                                                              1000

                                   300                                                                              500

                                     0                                                                              0
                                          Chemicals     Iron and Steel   Cement      Pulp and Paper   Aluminium

Despite being the largest industrial energy consumer, the chemical sector ranks third among industrial CO2
emitters.
Plastics continue their strong growth trajectory…
Production of key thermoplastics
800 80
800 80 PET
700 70
700 70 HDPE
600 60
Production (kg/capita)
600 60 PVC
Production (kg/capita)
Production (Mt)
500 50 50 LDPE
Production (Mt)
500
PP
400 400 40 40
PS
300 300 30 30
Other
200 200 20 20 RTS per capita
High demand variant
100 100 10 10
0 0 0 0
1980 19801990 2017 2017
19902000 2000 2010 2010 2020 2020 20302030 20402040 2050
2050
Production of key thermoplastics more than doubles between 2010 and 2050, with global average per capita
demand increasing by more than 50%.Petrochemicals grow more than any other oil demand driver
Oil demand growth to 2030
mb/d
10
8 3.2
6
2.5 9.6
4
1.7
2
0.6 1.6
0
Shipping/ Passenger Aviation Road freight Petrochemicals Growth
other vehicles 2017-2030
Petrochemicals are the fastest growing sector of oil demand, accounting over a third of growth to 2030, and
nearly half to 2050.Building towards a more sustainable chemical sector
Pollutants from primary chemical production Relevant UN SDGs
Index Reference Technology Scenario
Index 2017 = 100
Index 200 Carbon dioxide
Air pollutants
Carbon dioxide
150 200
150 Water pollutants
Air pollutants
100
50
200
100 0
150 Carbon dioxide
Water pollutants
Clean Technology Scenario
100
2017 2017
50
0 Air pollutants
Carbon dioxide
50
Water pollutants
Air pollutants
0 Water pollutants
2017 2030 2050
The Clean Technology Scenario, helps achieve several UN Sustainable Development Goals. By 2050,
environmental impacts decrease across the board, including CO2, air and water pollutants.Plastic recycling increases sharply in the CTS
Secondary plastic production, primary chemical production savings and plastic collection rates
200 100%
Global production/savings (Mt)
Global average collection rate
Secondary plastic production (2017)
160 80%
Secondary plastic production (RTS)
120 60%
Secondary plastic production (CTS)
80 40%
Primary chemical savings (CTS)
40 20%
Global average collection rate
0 0%
2017 2030 2030 2050 2050 2030 2050
Secondary plastic production Primary chemical
savings
By 2050, the collection rate for recycling nearly triples in the CTS, resulting in a 7% reduction in primary
chemical demand.Challenges for refiners as feedstock dominates oil demand…
Oil demand for chemical feedstock and share in total oil demand by scenario
RTS CTS
24 30%
Feedstock oil demand (mb/d)
20 26% 25%
16 20%
16%
12 15%
8 10%
4 5%
0 0%
2017 2020 2025 2030 2035 2040 2045 2050 2017 2020 2025 2030 2035 2040 2045 2050
Feedstock oil demand Proportion of total oil demand
The share of chemical feedstock in total oil demand in the CTS is much higher than in the RTS, despite lower
absolute volumes, as oil demand for other sectors declines much more sharply.A more sustainable chemical sector is achievable
Contribution to cumulative CO2 emissions reductions between the CTS and RTS
6%
9% Alternative feedstocks
35% Plastic recycling
25% Energy efficiency
Coal to natural gas feedstock shifts
25% CCUS
A balanced portfolio of options are required to deliver cumulative emissions reductions relative to the RTS of
24% between 2017 and 2050, in the CTS.Conclusions: Shining a light on “blind spots” of global energy • Petrochemical products are deeply embedded in our economies and everyday lives. They also play a key role in many components of clean energy technologies. • Petrochemicals are the largest driver of global oil demand, accounting for more than a third of the growth to 2030, and nearly half to 2050. • China, the United States and the Middle East lead the growth in petrochemicals production. • The production, use and disposal of chemicals take an environmental toll but achievable and cost-effective steps can be taken to make these more sustainable. • The IEA will continue to shine a light on energy “blind spots”: trucks, air conditioners, modern bioenergy… now petrochemicals… and more to come.
Slide notes
General notes
Primary chemicals refers to HVCs, ammonia and methanol. HVCs = high-value chemicals (ethylene, propylene, benzene, toluene and mixed xylenes), COG = coke oven gas. Mtoe = million
tonnes of oil equivalent.
Slide 4
Outputs of different industrial sectors are displayed on an indexed basis referred to 1971 levels. Aluminium refers to primary aluminium production only. Steel refers to crude steel
production. Plastics includes a subset of the main thermoplastic resins. Sources: Geyer, R., J.R. Jambeck and K.L. Law (2017), “Production, use, and fate of all plastics ever made”,
https://doi.org/10.1126/sciadv.1700782; Worldsteel (2017), Steel Statistical Yearbook 2017; IMF (2018), World Economic Outlook Database; USGS (2018a), 2018 Minerals Yearbook:
Aluminium; USGS (2018b), 2018 Minerals Yearbook: Cement; USGS (2018c), 2018 Minerals Yearbook: Nitrogen.
Slide 5
Petrochemicals includes process energy and feedstock.
Slide 6
All flows in the diagram are sized on a mass basis. Secondary reactants and products are the compounds specified within chemical reactions that do not form part of the feedstock or main
products. Key examples include water, CO2, oxygen, nitrogen and chlorine. Some of the secondary products entering the sector on the left of the figure may well coincide with those leaving
it on the right – CO2 emitted from ammonia facilities and utilised in urea production is a key example. Mtce = Million tonnes of coal equivalent. Source: Adapted from Levi, P.G. and J.M.
Cullen (2018), “Mapping global flows of chemicals: From fossil fuel feedstocks to chemical products”, https://doi.org/10.1021/acs.est.7b04573.
Slide 7
Final energy demand for chemicals includes feedstock, and, for iron and steel, it includes energy use in blast furnaces and coke ovens. Direct CO2 emissions includes energy and process
emissions in the industry sector.
Slide 8
Other refers to a selection of other thermoplastics: acrylonitrile butadiene styrene, styrene acrylonitrile, polycarbonate and polymethyl methacrylate. Volumes of plastic production shown are
independent of the level of recycling. The impact of recycling is registered in the lowering of demand for primary chemicals required to produce the plastic volumes shown above. The RTS
high demand sensitivity variant is a separate scenario performed to explore the sensitivity of our results to higher than expected demand. Only the per capita demand figures are show for
the high demand sensitivity variant in Figure 4.2. Details of the high demand sensitivity variant analysis can be found in the online annex accompanying this publication. Sources: Data
consulted in making projections from Geyer, R., J.R. Jambeck and K.L. Law (2017), “Production, use, and fate of all plastics ever made”, https://doi.org/10.1126/sciadv.1700782; Levi, P.G.
and J.M. Cullen (2018), “Mapping global flows of chemicals: From fossil fuel feedstocks to chemical products”, https://doi.org/10.1021/acs.est.7b04573; OECD (2018), Improving Markets
for Recycled Plastics: Trends, Prospects and Policy Responses.
Slide notes
Slide 9
Other includes the net contribution of all other oil demand sectors.
Slide 10
All environmental impacts relate to primary chemical production (ethylene, propylene, benzene, toluene, mixed xylenes, methanol and ammonia). Air pollutants includes nitrous oxides,
sulphur dioxide and fine particulate matter. Water pollutants refers to ocean-bound plastic leakage. Carbon dioxide refers to direct emissions from the chemical and petrochemical sector.
Slide 11
Error bars show the range of resin-specific global average collection rates. Projected volumes of total plastic production are independent of the level of recycling. The impact of recycling is
registered in the lowering of demand for primary chemicals. Sources: Data consulted in making projections from Geyer, R., J.R. Jambeck and K.L. Law (2017), “Production, use, and fate of all
plastics ever made”, https://doi.org/10.1126/sciadv.1700782; Levi, P.G. and J.M. Cullen (2018), “Mapping global flows of chemicals: From fossil fuel feedstocks to chemical products”,
https://doi.org/10.1021/acs.est.7b04573; OECD (2018), Improving Markets for Recycled Plastics: Trends, Prospects and Policy Responses.
Slide 12
Cumulative direct CO2 emission reductions refer to primary chemical production and not to the total chemical sector, and cover the period 2017-50. Coal to natural gas savings include the
reduction of process emissions in the production of methanol and ammonia. CO 2 emission savings resulting from feedstock shifts within the same energy commodity (e.g. naphtha to ethane)
are included in energy efficiency.
Slide 13
In the RTS, quantities of plastic leakage are estimated based on projections of plastic waste and estimates of current rates of leakage, the latter of which are assumed to remain constant.
Current rates of leakage from Jambeck, J.R. et al. (2015), “Plastic waste inputs from land into the ocean”, https://doi.org/10.1126/science.1260352.
Q&A
SCIENCE BASED TARGETS FOR
                                       THE CHEMICAL INDUSTRY
                      KEY TAKE-AWAYS OF DUTCH AND
                      GERMAN ROADMAPS
                      MICHIEL STORK

                      FEBRUARY 6TH, 2020

47 / ©2020 NAVIGANT CONSULTING, INC., N/K/A GUIDEHOUSE, INC. ALL RIGHTS RESERVED
DISCLAIMER Notice Regarding Presentation his presentation was prepared by avigant onsulting, nc., n/k/a uidehouse, nc. (“ avigant”),1 for informational purposes only. Navigant makes no claim to any government data and other data obtained from public sources found in this publication (whether or not the owners of such data are noted in this publication). Navigant does not make any express or implied warranty or representation concerning the information contained in this presentation, or as to merchantability or fitness for a particular purpose or function. This presentation is incomplete without reference to, and should be viewed in conjunction with the oral briefing provided by Navigant. No part of it may be circulated, quoted, or reproduced for distribution without prior written approval from Navigant. 1 OnOctober 11, 2019, Guidehouse LLP completed its previously announced acquisition of Navigant Consulting, Inc. In the months ahead, we will be working to integrate the Guidehouse and Navigant businesses. In furtherance of that effort, we recently renamed Navigant Consulting, Inc. as Guidehouse, Inc. 48 / ©2020 NAVIGANT CONSULTING, INC., N/K/A GUIDEHOUSE, INC. ALL RIGHTS RESERVED
INTRODUCING

                                                                        Michiel Stork
                                                                        Associate Director at Navigant
                                                                        - 10 years experience in chemical industry (DSM, Sabic);
                                                                        - 2 years at Dutch government (energy covenant);
                                                                        - 8 years at Ecofys – Navigant – Guidehouse;
                                                                           - European chemical industry roadmap (CEFIC);
                                                                           - European fertilizer roadmap (Fertilizer Europe);
                                                                           - Innovation Fund (DG CLIMA);
                                                                           - Re-use of Gaseous Industrial Effluents (DG GROW);
                                                                           - Dutch chemical industry roadmap (VNCI);
                                                                           - SPIRE Roadmap;

49 / ©2020 NAVIGANT CONSULTING, INC., N/K/A GUIDEHOUSE, INC. ALL RIGHTS RESERVED
THE EMISSIONS IN THE CHEMICAL INDUSTRY
Emissions of German chemical industry (2020) split by scope (in Mton CO2e)1)
Scope Currently Pathway 1 - 2050 Pathway 2 - 2050 Pathway 3 – 2050
(no additional investments, current (some additional investment, limited (no limitations, GHG neutrality in
technologies) RES, with innovation) 2050)
1 32,9 25 12,6 1,5
2 23,4 0,6 0,6 0,6
3 (partly) 56,5 56,5 31,2 0
Scope 3
1) https://www.vci.de/vci/downloads-vci/publikation/2019-10-09-studie-roadmap-chemie-2050-treibhausgasneutralitaet.pdf
50 / ©2020 NAVIGANT CONSULTING, INC., N/K/A GUIDEHOUSE, INC. ALL RIGHTS RESERVEDTHE EMISSIONS OF THE CHEMICAL INDUSTRY
A couple of chemicals emit the majority of the greenhouse gases
Emissions of German chemical industry (2020) split by chemical (in Mton CO2e)1)
1) https://www.vci.de/vci/downloads-vci/publikation/2019-10-09-studie-roadmap-chemie-2050-treibhausgasneutralitaet.pdf
51 / ©2020 NAVIGANT CONSULTING, INC., N/K/A GUIDEHOUSE, INC. ALL RIGHTS RESERVEDOVERVIEW OF CO2 EMISSION REDUCTION MEASURES
Value Chain Effects
Avoided emissions
Modified from: https://www.vnci.nl/Content/Files/file/Downloads/VNCI_Routekaart-2050.pdf
52 / ©2020 NAVIGANT CONSULTING, INC., N/K/A GUIDEHOUSE, INC. ALL RIGHTS RESERVEDREDUCING EMISSIONS TO ZERO IN 2050
Emission reduction of the Dutch chemical industry (in Mton CO2e)1)
1) https://www.vnci.nl/Content/Files/file/Downloads/VNCI_Routekaart-2050.pdf, combination pathway to illustrate a high-value approach in a constrained world.
53 / ©2020 NAVIGANT CONSULTING, INC., N/K/A GUIDEHOUSE, INC. ALL RIGHTS RESERVEDADDING IT ALL UP
• Differences between sub-sectors:
– Base chemicals: 0% growth / year;
– Specialty chemicals: 2% growth/year;
Changes in product mix
• Scope 1:
– Energy efficiency: Depending on the sub-sectors, for example1):
▪ Declining from 0,5%/year → 0,0%/year for base chemicals;
▪ Declining from 2,0%/year → 0,5%/year for specialty chemicals;
– Electrification;
• Scope 2:
– In Dutch and German roadmap → Electricity emission factor 0 in 20501) 2)
• Scope 3: Bio-based, recycling, CCU (synthetic fuels);
• Consequences:
– Steep increase of electricity consumption → pathway 3 in German roadmap: * ±131)
– Steep increase of biomass consumption → pathway 3 in German roadmap: * ± 51)
– Additional investments needed for complete emission reduction: ± 68 billion€1)
1) https://www.vci.de/vci/downloads-vci/publikation/2019-10-09-studie-roadmap-chemie-2050-treibhausgasneutralitaet.pdf Innovation
2) https://www.vnci.nl/Content/Files/file/Downloads/VNCI_Routekaart-2050.pdf
54 / ©2020 NAVIGANT CONSULTING, INC., N/K/A GUIDEHOUSE, INC. ALL RIGHTS RESERVEDCONTACTS
MICHIEL STORK
Associate Director
+31 30 662 3734
Michiel.Stork@Navigant.com
55 / ©2020 NAVIGANT CONSULTING, INC., N/K/A GUIDEHOUSE, INC. ALL RIGHTS RESERVEDQ&A
Next Steps
and
Discussion
Opportunities for participation

       • Join the SBT-Chemicals
         Stakeholder Advisory Group

       • Attend the SBT-Chemicals
         Summer 2020 Stakeholder
         Consultation Workshops or
         Webinars

       • Commit your company to setting
         an SBT
Thanks for your time!
f you haven’t already, join SBTi-Chemicals stakeholder list
at https://sciencebasedtargets.org/chemicals-and-petrochemicals/
www.sciencebasedtargets.org info@sciencebasedtargets.orgYou can also read