Te Kāhui Ako o Kaipara - Kaipara Community of Learning - Ministry Of Education
←
→
Page content transcription
If your browser does not render page correctly, please read the page content below
Te Kāhui Ako o Kaipara
              Kaipara Community of Learning

Sarah McBeath - Kaipara River

                            ‘With the change of light the Kaipara is reborn”

  The landscape is who we are: The spirals of the river weave the knowledge, learning and people together

                            Plan for Achievement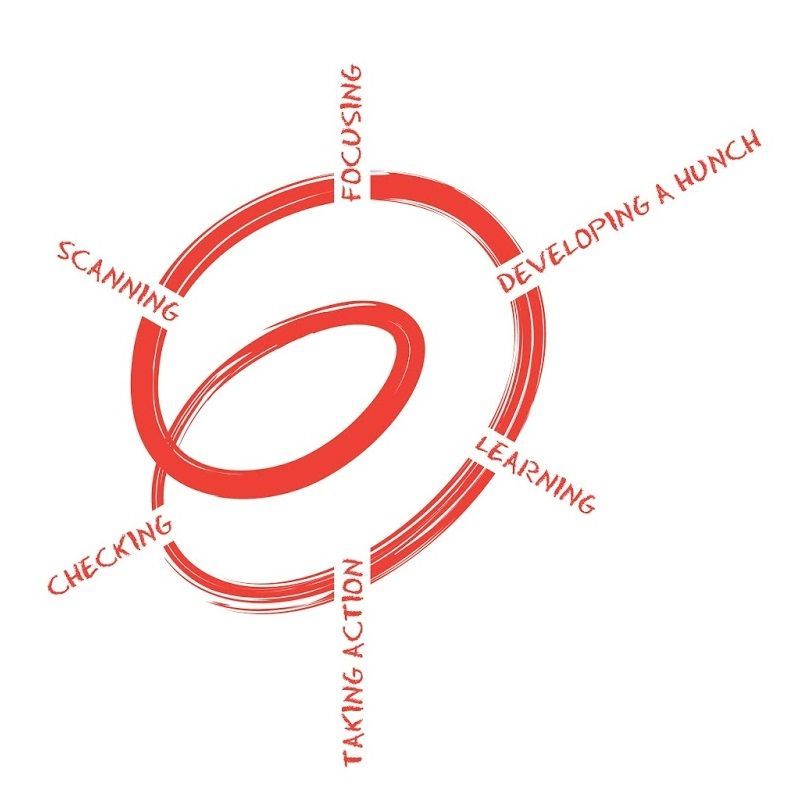
TABLE OF CONTENTS

Our Vision:                                                                          4

Our Approach                                                                          4

Our Scanning and Focusing Analysis                                                    4

Year 1-8 National Standards Achievement Data                                          7
   Aggregated Year 1-8 Data for Mathematics                                           7
   Year 1 - 8 Achievement Challenge Targets for Mathematics                           8
   Year 1 - 8 Achievement Challenge Targets for Mathematics by School                 9
   Aggregated Year 1-8 Data for Writing                                              10
   Year 1 - 8 Achievement Challenge Targets for Writing                              11
   Year 1 - 8 Achievement Challenge Targets for Writing by School                    12

Kaipara College NCEA Secondary Achievement Data                                      13
   2016 NCEA Level 1 Results                                                         13
   2016 NCEA Level 2 Results                                                         13
   2016 NCEA Level 3 Results                                                         13
   Secondary Achievement Challenge Targets - Year 9 & 10                             14
   Secondary Achievement Challenge Targets - NCEA                                    14

Plan of Approach                                                                     15
   1. Teaching as Inquiry                                                            15
   2. Develop a connected learning community based on powerful relationships         19
   3. Culturally responsive and relational pedagogies                                19
   4. Create effective pathways and transitions from ECE to Post-Secondary Success   21
Kaipara Community of Learning Organisational Structure                               22

                                                                                      1
Our Community
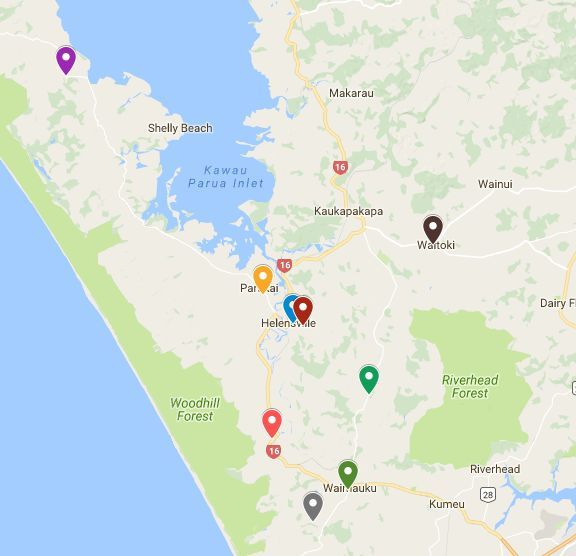
Te Kahui Ako o Kaipara is diverse and inclusive of Early Childhood Education through to Post-Secondary
Success. It is there to fully encompass nga akonga katoa. The community consists of two ECE: Gumboots
ELC and The Cottage Kindergarten. We have six full primary schools: Helensville Primary School, Parakai
School, Waimauku School, Waioneke School, Waitoki School, Woodhill School and one High School: Kaipara
College.
This Kaipara Community extends from Waimauku in the South to Waitoki in the East and as far as Waioneke
out on the South Head peninsula. The student population is ethnically diverse, with 21.5% Maori, 3% Pasifika ,
3% Asian and 72% Pakeha in the 2017 primary cohort. In the secondary cohort the population is 26% Maori,
68% Pakeha, 3% Pasifika and 3% Asian.
Our parents and whanau want their children to achieve in all aspects of their learning. They have high
expectations of our learning environments to help our rangatahi to achieve their aspirations. Changes in
Principals (Tumuaki) have occurred over the past couple of years and a solid base of cooperation is
flourishing.
There are five local Ngati Whatua o Kaipara marae: Araparera, Haranui, Kakanui, Puatahi and Reweti in our
Kaipara Community of Learning - Kāhui Ako. Our community celebrates the bi-cultural partnership of the
Treaty of Waitangi and is committed to the integration of te reo me nga tikanga into the learning experiences of
all our students. This means that cultural lineage and the identity of Maori learners are validated, as well as
fostering the understanding and national identity for all akonga.
Our diversity, geographic distances and rural location within Auckland City make a COL the perfect
educational vehicle to provide the best outcomes for our children, teachers, whanau and wider communities.
2
Our Vision:
Every akonga will have dignity, purpose, ambition and the desire to succeed.

We will reflect this by:
   ●   Developing confident, connected, actively involved learners, starting at ECE
   ●   Celebrating the bi-cultural partnership of Te Tiriti o Waitangi
   ●   Challenging students to achieve personal standards of excellence in an innovative environment
   ●   Promoting our students to become inquiry focussed and knowing how to learn

Our Approach
   ●   Use Spirals of Inquiry to drive professional learning, collaboration and inquiry across the community of
       learning.
   ●   Develop a connected learning community based on powerful relationships and shared knowledge
   ●   Use culturally responsive pedagogies
   ●   Create effective pathways and transitions from ECE to Post-Secondary Success

Our Scanning and Focusing Analysis
We have considered a range of evidence from across all learning environments in our Community of Learning
including:
    ● OTJ for Writing, Maths and Reading.
    ● Summative assessments such as PAT’s, Asttle Maths and Writing, JAM testing, Gloss Testing, GAP
        Spelling.
    ● Ongoing formative Assessments, writing samples
    ● Student Wellbeing surveys and attendance data.
    ● NCEA Level 1 Numeracy and Literacy data,
    ● NCEA Level 1,2,3 Achievement data, including course endorsement statistics.
    ● A minimum of 85% or a minimum 5% shift over three years

ECE Data Analysis

The New Zealand curriculum guiding document for ECE services is Te Whariki. It is founded on aspirations for
children to grow up as competent and confident learners and communicators, healthy in mind, body and spirit,
secure in their sense of belonging and in the knowledge that they make a valued contribution to society.
Our ECE services use learning stories as means for planning and assessment. There is a strong focus on
dispositional learning and “learning through play”. Therefore there is no actual data analysis.
ECE data analysis is reflected in the first year school assessments. It will be collaboration between first year
teachers and ECE services that provides the first true reflection of a child’s ability against assessment
standards that can be analysed and strategies reviewed.
ECE services work very closely with the Ministry of Education Early Intervention team of specialists. There is a
strong relationship with them and tamariki who are at risk of not meeting expected milestones are referred to
the Early Intervention team for learning assistance. There is a strong belief that the biggest gains in a
developmental deficit can be made with swift intervention in the early years.

                                                                                                              3
National Standards Writing Analysis
Analysis of our Year 1-8 Overall Teacher Judgement (OTJ) data has highlighted that we have challenges in
Writing.
Our writing data tells us that currently:
● In Writing across the Kaipara Kāhui Ako we are achieving 75.9% (1172/1545) At or Above. However
this drops to 72.7% (128 /176) at end of Year 3 and 73.7% (115/156) at end of Year 8.
● In Writing our European/Pakeha students are achieving 77.8% (859/1104), our Asian students 83.7%
(36/43), our Pasifika Students 80.8%(42/52) but this drops to 68.1% (231/339) for our Maori students.
● In Writing our girls achieve at 84.4% (615/729) but this drops for boys to 68.3% (557/816)
● Proportionally Maori continue to underachieve with 31.9% (108/339) Below National Standard.
● Boys are a concern with 31.8% (259/816) Below National Standard
● Overall this data demonstrates the need for more deliberate teaching at Year 3/4 and the senior end of
the school and an inquiry into the level of cognitive and behavioural engagement of Maori, Pasifika and
male students in Writing.
National Standards Mathematics Analysis
Analysis of our Year 1-8 data has highlighted that we have challenges in Mathematics
Our mathematics data tells us that currently:
● In Mathematics across the Kaipara Kāhui Ako schools 81.5% (1260/1546) are achieving At or Above.
However at the end of Year 6 this drops to 79.2% (152/192), and again at the end Year 7 to 73.9%
(133/180)
● In Maths Our Asian students are achieving the best at 93% (40/43), Pasifika are achieving well at
84.6% (44/52) our European/Pakeha at 83.7% (925/1105) however this drops to 72.9% (247/339) for
our Maori students . (92/339 students are below and well below )
● Overall this data demonstrates the need for more deliberate teaching at Year 3/4 and the senior end of
the school – Levels 3 and 4 of the NZC
We do not know at this stage if any of the Well Below and Below students are Special Needs learners or
English language learners. We will gain baseline data for these students at the beginning of our work together,
build profiles for them and track them accordingly.
NCEA Levels 1- 3 Analysis
Analysis of our NCEA data at Level 1 has highlighted that there was a dramatic improvement in pass rates
at L1 to 77%, a gain of 19%. Students from the SEU and transient students as well as early leavers are
included in the roll based data which will have had a negative impact (however most schools have an issue in
this area). The disparity between boys and girl’s achievement has been decreased to just 3% (7% in 2015).
There was some effective work with target students in term 3 onwards which enabled a large number of our
male students who were at risk of Not Achieving getting over the line. For literacy and numeracy (pre
requisites for a L1 award) we moved from 76.1 to 90.1 for literacy and 74.6 to 92.0 in Numeracy.
Excellence endorsements have dropped off by 2%, in part due to the higher number of students passing,
therefore an increase in both Merit and Excellence endorsements a key target for us. There is still a significant
disparity between Internal and External achievement and this is an area that will be addressed in order to raise
achievement. Use of better writing strategies across the school will support improvement in this area, currently
literacy is poor in relation to general and subject specific terminology.
4For Level 1 Maori data, Kaipara had 50 students (from a roll of 166) that identified as Maori (30% - higher than
the school average of 27%). 66% passed L1 (roll based) with males outperforming females by 2%. The gap is
therefore 11% below the rest of the cohort and 19% less than NZ European. Despite the shifts in culturally
responsive and relational pedagogy the gap is still very significant, demonstrating that ongoing focus needs to
be on the academic outcomes for these students. In 2015 the pass rate was 49%, so gains have been made
but inequitable outcomes have increased in comparison to NZ European students. In other decile 7 schools,
the inequity is less with Maori achieving 73% against 80%. Interestingly, the average % of the cohort that
identify as Maori in other decile 7 schools is 15%. When Maori participation based statistics are looked at, it
was the Level 1 females who fell behind, with our boys beating the decile 7 by 6% and being 15% ahead of the
girls. We had 3 Pasifika students at L1, with only 1 passing, however 1 was in the SEU in Y12. There were 8
students who identified as Asian, with 100% pass rates.
Analysis of our NCEA data at Level 2 data shows there was an enormous lift from this cohort from 58% to
85% in roll based pass rates. Boys achievement surpassed that of girls, however at the top end it is girls who
dominate the Excellence endorsements. 5 students gained over 85 Excellence credits. The rise in Excellence
endorsements was not replicated at Merit level, and this needs to be a focus for teachers as we are at least
15% below where we would hope to be. Over time this will be reflected in higher Excellence endorsement
targets. At Level 2, 25% of the roll were Maori, 82% passed against a school wide 85%, most pleasing was
that 100% of Maori males passed (against a decile 7 male average of 79%). Again, the female Maori pass
rates were much more disappointing with only 13 students passing, giving a percentage pass of 62. There was
a 24% difference between Maori females and NZ European females. Much of the support at Level 2 was male
driven, and it now important to consult with those female students who did not pass to find out how we can
adjust our programmes for their benefit. Three Pasifika students were at Level 2, with two passing, however
the third was in the SEU, as previously mentioned.
Analysis of our NCEA data at Level 3 data shows results were the one area of slight disappointment in
comparison to the other areas. Roll based rates show a school record 70% pass rate (up 7%), this is due to
more students staying on to get their L3 before leaving school and is 2% behind other decile 7 schools. Boys
achievement rose by 18%, and is an indicator that students were taking more appropriate courses. However,
participation pass rates dropped back from 89% to 87%. University Entrance pass rates slipped back, and is
an area of concern given that we are 8% behind decile 7 schools. Merit rates declined significantly and lag
behind schools of similar demographic intake.
Level 3 saw 30% of the cohort identify as Maori (against 13% in similar schools). 63% passed, compared to
72% for the school. Maori females outperformed males, 69% to 57%. A 14% disparity between Maori males
and NZ European males emerged. However, there was a 12% increase in Maori male performance against
2015. For University Entrance, there is cause for concern when comparing outcomes for Maori. Only 35%
gained this, with the split being 46% for females and a very poor 22% for males. This compares to a 43%
decile 7 Maori UE rate, with 36% for males. In 2015 only 20% of Kaipara College students gained UE, with
only 8% (roll based) getting entry. Participation based UE statistics are better, however inequity is still very
evident (35% Maori males, 46% Maori females). Progress has been made, but the level of acceleration is not
quick enough.
5Year 1-8 National Standards Achievement Data
Aggregated Year 1-8 Data for Mathematics
Well below Below At Above Total
COHORT
No % No % No % No % No
All Students 57 3.7% 229 14.8% 937 60.6% 323 20.9% 1546
Māori 18 5.3% 74 21.8% 202 59.6% 45 13.3% 339
Pasifika 3 5.8% 5 9.6% 32 61.5% 12 23.1% 52
Asian 0 0.0% 3 7.0% 29 67.4% 11 25.6% 43
European 35 3.2% 145 13.1% 671 60.7% 254 23.0% 1105
Male 30 3.7% 117 14.3% 476 58.2% 195 23.8% 818
Female 27 3.7% 112 15.4% 461 63.3% 128 17.6% 728
Well below Below At Above Total
YEAR LEVEL
No % No % No % No % No
After 1 year at school 2 1.1% 22 11.7% 155 82.4% 9 4.8% 188
After 2 years at school 1 0.5% 33 15.1% 164 74.9% 21 9.6% 219
After 3 years at school 4 2.3% 34 19.3% 109 61.9% 29 16.5% 176
End of Year 4 5 2.3% 29 13.2% 109 49.5% 77 35.0% 220
End of Year 5 13 6.0% 26 12.1% 118 54.9% 58 27.0% 215
End of Year 6 10 5.2% 30 15.6% 99 51.6% 53 27.6% 192
End of Year 7 11 6.1% 36 20.0% 90 50.0% 43 23.9% 180
End of Year 8 11 7.1% 19 12.2% 93 59.6% 33 21.2% 156
2016 Baseline Data for Analysis for Mathematics by Cohort are achieving At or Above National Standards
1260 of our 1546 (81.5%) of All learners.
247 of our 339 (72.9%) Māori learners.
44 of our 52 (84.6%) Pasifika learners.
40 of our 43 (93%) Asian learners.
925 of our 1105(83.7%) European learners.
671 of our 818 (82%) Male learners.
589 of our 728 (80.9%) Female learners.
2016 Baseline Data for Analysis for Mathematics by Year Level are achieving At or Above National Standards
164 of our 188 (87.2%) of after 1 Year learners.
185 of our 219 (84.5%) of after 2 Years learners.
138 of our 176 (78.4%) of after 3 Years learners.
186 of our 220 (84.5%) at the end of Year 4 learners.
176 of our 215 (81.9%) at the end of Year 5 learners.
152 of our 192 (79.2%) at the end of Year 6 learners.
133 of our 180 (73.9%) at the end of Year 7 learners.
126 of our 156 (80.8%) at the end of Year 8 learners.
6Year 1 - 8 Achievement Challenge Targets for Mathematics
Target : A minimum of 85% or a minimum 5% shift over three years
At and Above Projected Projected Progress Projected Progress Total Cohort
COHORT Cohort Baseline Data Progress 2018 2019 2020 Shift
Number No % No % No % No % No %
All Students 1546 1260 82% 1294 84% 1328 86% 1363 88% 103 6%
SUB COHORT TARGETS
Males 818 671 82% 688 84% 705 86% 721 88% 50 4%
Females 728 589 81% 607 83% 625 86% 642 88% 53 7%
Māori 339 247 73% 260 77% 273 81% 289 85% 42 12%
Pasifika 52 44 85% 44 85% 44 85% 47 90% 3 6%
Year 3 176 140 80% 144 82% 148 84% 156 89% 16 9%
Year 7 180 133 74% 141 78% 149 83% 156 87% 23 13%
All Student Achievement All learners will make accelerated progress in Mathematics by the end of 2020 in ways that
build on their confidence and skill level.
In Years 1-8 there will be a sustained increase from 1260 of our 1546 (81.5%) learners At or Above the standard to 1363
of our 1546 (88%), across all schools increase of 103 learners (6%).
Māori Achievement: Māori learners will make accelerated progress in Mathematics by the end of 2020 in ways that build
on and support their language, culture, identity and community engagement and connections:
In Years 1-8 there will be a sustained increase from 247 of our 339 (73%) learners At or Above the standard to 289 of our
339 (88%), across all schools increase of 42 learners (12%).
Pasifika Achievement: Pasifika learners will make accelerated progress in Mathematics by the end of 2020 in ways that
build on and support their language, culture, identity and community engagement and connections:
In Years 1-8 there will be a sustained increase from 44 of our 52 (84.6%) learners At or Above the standard to 47 of our
52 (90%), across all schools increase of 3 learners (6%).
End of Year 3 Achievement: Learners will increase their achievement in Mathematics across all areas of the curriculum
by the end of 2020 in ways that will engage them in a range of authentic contexts to bridge the deficit that currently
exists:
In Years 1-8 there will be a sustained increase from 140 of our 176 (80%) learners At or Above the standard to156 of our
176 (89%), and across all schools increase of 16 learners (9%).
End of Year 7 Achievement: Learners will increase their achievement in Mathematics across all areas of the curriculum
by the end of 2020 in ways that will engage them in a range of authentic contexts to bridge the deficit that currently
exists:
In Years 1-8 there will be a sustained increase from 133 of our 180 (74%) learners At or Above the standard to 156 of our
180 (87%), and across all schools increase of 23 learners (13%).
7Year 1 - 8 Achievement Challenge Targets for Mathematics by School
Target: A minimum of 85% or a minimum 5% shift over three years
At and Above Projected Projected Progress Projected Progress Total Cohort
MĀORI Cohort Baseline Data Progress 2018 2019 2020 Shift
Number No % No % No % No % No %
Helensville 116 86 74% 90 78% 94 81% 99 85% 13 11%
Waioneke 16 10 63% 11 69% 12 75% 14 85% 4 23%
Waitoki 12 7 58% 8 67% 9 75% 10 85% 3 27%
Parakai 72 48 67% 52 72% 56 78% 61 85% 13 18%
Woodhill 10 7 70% 8 80% 9 90% 9 85% 2 15%
Waimauku 113 89 79% 91 81% 93 82% 96 85% 7 6%
Total 339 247 73% 260 77% 273 81% 289 85% 42 12%
Cohort At and Above Projected Projected Progress Projected Progress Total Cohort
PASIFIKA Number Baseline Data Progress 2018 2019 2020 Shift
No % No % No % No % No %
Helensville 20 17 85% 17 85% 17 85% 18 90% 1 5%
Waioneke 0 0 n 0 n 0 n 0 0% 0 n
Waitoki 0 0 n 0 n 0 n 0 0% 0 n
Parakai 13 11 85% 11 85% 11 85% 12 90% 1 5%
Woodhill 0 0 n 0 n 0 n 0 0% 0 n
Waimauku 19 16 84% 16 84% 16 84% 17 89% 1 5%
Total 52 44 85% 44 85% 44 85% 47 90% 3 6%
Cohort At and Above Projected Projected Progress Projected Progress Total Cohort
BY THE END OF YEAR
Number Baseline Data Progress 2018 2019 2020 Shift
3
No % No % No % No % No %
Helensville 51 39 76% 40 78% 41 80% 43 85% 4 9%
Waioneke 12 x x x x x x x x x x
Waitoki 12 x x x x x x x x x x
Parakai 23 19 83% 19 83% 19 83% 20 88% 1 5%
Woodhill 2 x x x x x x x x x x
Waimauku 76 67 88% 68 89% 69 91% 71 93% 4 5%
Total 176 140 80% 144 82% 148 84% 156 89% 16 9%
Cohort At and Above Projected Projected Progress Projected Progress Total Cohort
BY THE END OF YEAR Number Baseline Data Progress 2018 2019 2020 Shift
7
No % No % No % No % No %
Helensville 62 49 79% 50 81% 51 82% 53 85% 4 6%
Waioneke 16 9 56% 11 69% 13 81% 14 85% 5 29%
Waitoki 10 x x x x x x x x x x
Parakai 24 12 50% 15 63% 18 75% 20 85% 8 35%
Woodhill 2 x x x x x x x x x x
Waimauku 66 55 83% 56 85% 57 86% 58 88% 3 5%
Total 180 133 74% 141 78% 149 83% 156 87% 23 13%
Note: x = data has been redacted for privacy
8Aggregated Year 1-8 Data for Writing
Well below Below At Above Total
COHORT
No % No % No % No % No
All Students 64 4.1% 309 20.0% 950 61.5% 222 14.4% 1545
Māori 19 5.6% 89 26.3% 193 56.9% 38 11.2% 339
Pasifika 2 3.8% 8 15.4% 35 67.3% 7 13.5% 52
Asian 2 4.7% 5 11.6% 31 72.1% 5 11.6% 43
European 41 3.7% 204 18.5% 687 62.2% 172 15.6% 1104
Male 47 5.8% 212 26.0% 469 57.5% 88 10.8% 816
Female 17 2.3% 97 13.3% 481 66.0% 134 18.4% 729
Well below Below At Above Total
YEAR LEVEL
No % No % No % No % No
After 1 year at school 3 1.6% 48 25.3% 127 66.8% 12 6.3% 190
After 2 years at school 1 0.5% 47 21.8% 150 69.4% 18 8.3% 216
After 3 years at school 4 2.3% 44 25.0% 106 60.2% 22 12.5% 176
End of Year 4 9 4.1% 42 19.1% 137 62.3% 32 14.5% 220
End of Year 5 11 5.1% 39 18.1% 124 57.7% 41 19.1% 215
End of Year 6 12 6.3% 32 16.7% 113 58.9% 35 18.2% 192
End of Year 7 12 6.7% 28 15.6% 105 58.3% 35 19.4% 180
End of Year 8 12 7.7% 29 18.6% 88 56.4% 27 17.3% 156
2016 Baseline Data for Analysis for Writing by Cohort are achieving At or Above National Standards
1172 of our 1545 (75.%) of All learners.
231 of our 339 (68.1%) Māori learners.
42 of our 52 (80.8%) Pasifika learners.
36 of our 43 (83.7%) Asian learners.
859 of our 1104 (77.8%) European learners.
557 of our 818 (68.3%) Male learners.
615 of our 729 (84.4%) Female learners.
2016 Baseline Data for Analysis for Writing by Year Level are achieving At or Above National
Standards
139 of our 190 (73.2%) of after 1 Year learners.
168 of our 216 (77.8%) of after 2 Years learners.
128 of our 176 (72.7%) of after 3 Years learners.
169 of our 220 (76.8%) at the end of Year 4 learners.
165 of our 215 (76.7%) at the end of Year 5 learners.
148 of our 192 (77.1%) at the end of Year 6 learners.
140 of our 180 (77.8%) at the end of Year 7 learners.
115 of our 156 (73.7%) at the end of Year 8 learners.
9Year 1 - 8 Achievement Challenge Targets for Writing
Target : A minimum of 85% or a minimum 5% shift over three years
At and Above Projected Projected Progress Projected Progress Total Cohort
COHORT Cohort Baseline Data Progress 2018 2019 2020 Shift
Number No % No % No % No % No %
All Students 1545 1172 76% 1238 80% 1304 84% 1368 89% 196 10%
SUB COHORT TARGETS
Māori 340 231 68% 250 74% 269 79% 289 85% 58 17%
Pasifika 52 42 81% 45 87% 48 92% 52 100% 10 19%
Males 816 557 68% 610 75% 663 81% 719 88% 162 20%
Year 3 176 128 73% 136 77% 144 82% 154 88% 26 15%
Year 7 180 143 79% 147 82% 151 84% 158 88% 15 8%
All Student Achievement All learners will make accelerated progress in Writing by the end of 2020 in ways that build on
their confidence and skill level. In Years 1-8 there will be a sustained increase from 1172 of our 1545 (75.9%) learners At
or Above the standard to 1368 of our 1545 (89%), across all schools increase of 196 learners (10%).
Māori Achievement: Māori learners will make accelerated progress in Writing by the end of 2020 in ways that build on
and support their language, culture, identity and community engagement and connections. In Years 1-8 there will be a
sustained increase from 231 of our 340 (68%) learners At or Above the standard to 280 of our 340 (85%), across all
schools increase of 58 learners (17%).
Pasifika Achievement: Pasifika learners will make accelerated progress in Writing by the end of 2020 in ways that build
on and support their language, culture, identity and community engagement and connections. In Years 1-8 there will be a
sustained increase from 42 of our 52 (80.8%) learners At or Above the standard to 52 of our 52 (100%), across all
schools increase of 10 learners (19%).
Male Achievement: Males will increase their achievement in Writing across all areas of the curriculum by the end of 2020
in ways that will engage them in a range of authentic contexts to bridge the gender deficit that currently exists. In Years
1-8 there will be a sustained increase from 557 of our 816 (68%) learners At or Above the standard to 719 of our 816
(85%), across all schools increase of 136 learners (16.7%).
End of Year 3 Achievement: Learners will increase their achievement in Writing across all areas of the curriculum by the
end of 2020 in ways that will engage them in a range of authentic contexts to bridge the deficit that currently exists. In
Years 1-8 there will be a sustained increase from 128 of our 176 (72.7%) learners At or Above the standard to 150 of our
176 (88%), and across all schools increase of 26 learners (15%).
End of Year 7 Achievement: Learners will increase their achievement in Writing across all areas of the curriculum by the
end of 2020 in ways that will engage them in a range of authentic contexts to bridge the deficit that currently exists. In
Years 1-8 there will be a sustained increase from 143 of our 180 (79%) learners At or Above the standard to 158 of our
180 (88%), and across all schools increase of 15 learners (8%).
10Year 1 - 8 Achievement Challenge Targets for Writing by School
Target:: A minimum of 85% or a minimum 5% shift over three years
At and Above Projected Projected Progress Projected Progress Total Cohort
MĀORI
Cohort Baseline Data Progress 2018 2019 2020 Shift
Number No % No % No % No % No %
Helensville 116 80 69% 86 74% 92 79% 99 85% 19 16%
Waioneke 16 10 63% 11 69% 12 75% 14 85% 4 23%
Waitoki 12 8 67% 9 75% 10 83% 10 85% 2 18%
Parakai 72 52 72% 55 76% 58 81% 61 85% 9 13%
Woodhill 11 8 73% 8 73% 8 73% 9 85% 1 12%
Waimauku 113 73 65% 81 72% 89 79% 96 85% 23 20%
Total 340 231 68% 250 74% 269 79% 289 85% 58 17%
Cohort At and Above Projected Projected Progress Projected Progress Total Cohort
PASIFIKA Number Baseline Data Progress 2018 2019 2020 Shift
No % No % No % No % No %
Helensville 20 17 85% 18 90% 19 95% 20 100% 3 15%
Waioneke 0 0 n 0 n 0 n 0 0% 0 n
Waitoki 0 0 n 0 n 0 n 0 0% 0 n
Parakai 13 10 77% 11 85% 12 92% 13 100% 3 23%
Woodhill 0 0 n 0 n 0 n 0 0% 0 n
Waimauku 19 15 79% 16 84% 17 89% 19 100% 4 21%
Total 52 42 81% 45 87% 48 92% 52 100% 10 19%
Cohort At and Above Projected Projected Progress Projected Progress Total Cohort
MALES Number Baseline Data Progress 2018 2019 2020 Shift
No % No % No % No % No %
Helensville 282 185 66% 205 73% 225 80% 245 87% 60 21%
Waioneke 60 36 60% 41 68% 46 77% 51 85% 15 25%
Waitoki 52 39 75% 41 79% 43 83% 45 86% 6 11%
Parakai 81 59 73% 62 77% 65 80% 69 85% 10 12%
Woodhill 11 8 73% 8 73% 8 73% 9 85% 1 12%
Waimauku 330 230 70% 253 77% 276 84% 300 91% 70 21%
Total 816 557 68% 610 75% 663 81% 719 88% 162 20%
BY THE END OF YEAR Cohort At and Above Projected Projected Progress Projected Progress Total Cohort
3 Number Baseline Data Progress 2018 2019 2020 Shift
No % No % No % No % No %
Helensville 51 36 71% 38 75% 40 78% 43 85% 7 14%
Waioneke 12 x x x x x x x x x x
Waitoki 12 x x x x x x x x x x
Parakai 23 21 91% 21 91% 21 91% 22 96% 1 5%
Woodhill 2 x x x x x x x x x x
Waimauku 76 51 67% 56 74% 61 80% 65 85% 14 18%
Total 176 128 73% 136 77% 144 82% 154 88% 26 15%
BY THE END OF YEAR At and Above Projected Projected Progress Projected Progress Total Cohort
Cohort Baseline Data Progress 2018 2019 2020 Shift
7
Number
No % No % No % No % No %
Helensville 62 49 79% 50 81% 51 82% 53 85% 4 6%
Waioneke 16 8 50% 10 63% 12 75% 14 85% 6 35%
Waitoki 10 x x x x x x x x x x
Parakai 24 22 92% 22 92% 22 92% 23 97% 1 5%
Woodhill 2 x x x x x x x x x x
Waimauku 66 53 80% 54 82% 55 83% 56 85% 3 5%
Total 180 143 79% 147 82% 151 84% 158 88% 15 8%
Note: x = data has been redacted for privacy
11Kaipara College NCEA Secondary Achievement Data
2016 NCEA Level 1 Results
According to 2016 end of year data 127 of our 166 (76.5%) learners attained NCEA Level 1.
The table below gives a further breakdown by gender and ethnicity:
NCEA Male Female Asian European Māori Pasifika *Other Overall
Level 1 Pākeha
Cohort 76 90 8 97 50 4 7 166
No % No % No % No % No % No % No % No %
Achieved
57 75 70 77.8 8 100 82 84.5 33 66 x x x x 127 76.5
*Other includes international students
2016 NCEA Level 2 Results
According to 2016 end of year data 91 of our 107 (85%) learners attained NCEA Level 2.
The table below gives a further breakdown by gender and ethnicity:
NCEA Male Female Asian European Māori Pasifika *Other Overall
Level 2 Pākeha
Cohort 60 47 2 70 27 3 5 107
No % No % No % No % No % No % No % No %
Achieved
55 91.7 36 76.6 x x 63 90 22 81.5 x x x x 91 85.0
*Other includes international students
2016 NCEA Level 3 Results
According to 2016 end of year data 53 of our 75 (70.7%) learners attained NCEA Level 3.
The table below gives a further breakdown by gender and ethnicity:
NCEA Male Female Asian European Māori Pasifika *Other Overall
Level 3 Pākeha
Cohort 37 38 1 48 20 1 5 75
No % No % No % No % No % No % No % No %
Achieved
27 71.1 26 70.7 x x 38 79.2 10 50 x x x x 53 70.7
*Other includes international students
Note: x = data has been redacted for privacy
12Secondary Achievement Challenge Targets - Year 9 & 10
To encourage teachers to have high expectations of all students we have set % targets.
We are challenging ourselves to lift the achievement of our Year 9 & 10 students by progressing writing and Maths achievement for
students who are achieving below the expected level of the curriculum. To do this we will adjust our use of standardised tests, and
use the Learning Progressions Framework to ensure our judgements are accurate.
Our targets therefore are:
To raise the numbers of students at or above the appropriate curriculum level in Maths at the end of Year 9.
To raise the numbers of students at or above the appropriate curriculum level in Writing at the end of Year 9.
Baseline Data Projected Progress Projected Progress Target Total
2016 2018 2019 2020 Cohort Shift
No % No % No % No % No %
Groups
Year 9 Maths 130 70% 135 73% 139 75% 142 77% 12 7%
Year 9 Writing 131 71% 135 73% 139 75% 142 77% 11 6%
Total Kahui Ako shift of students 5 3% 4 2% 4 2% 12 7%
Secondary Achievement Challenge Targets - NCEA
To encourage teachers to have high expectations of all students we have set % targets.
We are challenging ourselves to lift the achievement of our NCEA students get the necessary credits per subject per year to achieve
at the appropriate level and so continue at school. These credits will lead to wider pathways at Level 3, enabling more effective
transition into post secondary education and employment.
Our targets therefore are:
● 85% students to gain 80 credits at Level 1 including Literacy and Numeracy
● Excellence Endorsements to increase to 25% at L1, 22% at L2, 18% at L3
● 80% students to gain 60 credits at Level 3.
Baseline Data Projected Progress Projected Progress Target Total
2016 2018 2019 2020 Cohort Shift
No % No % No % No % No %
Groups
Level 1 127 76.5% 134 81% 138 83% 141 85% 14 8.5 %
Level 1 Excellence 23 18.1% 28 21% 32 23% 35 25% 12 6.9%
endorsements
Level 2 Excellence 14 15.4% 15 17% 18 20% 20 22% 6 6.6%
endorsements
Level 3 53 70.7% 56 75% 58 77% 60 80% 7 9.3%
Level 3 Excellence 5 9.4% 7 12% 9 15% 11 18% 6 8.6%
endorsements
Total Kahui Ako shift of students - (Based on 8 8 8 24
Excellence endorsement)
13Plan of Approach
To ensure this will happen we will:
● Train key staff in standardised tools - particularly a writing tool such as easttle
● Strengthen dispositional learning and the links to key competencies
● Focus on fine motor skills and oral development leading into literacy in ECE
● Liaise with Primary schools over spelling progression and acceleration.
● Work with primary schools to ensure reliable OTJ data from the contributing schools so we can identify
students for acceleration and begin teaching from Day 1 Term 1.
● Track the cohort from year to year and investigate the retention rate
● Every teacher of Years 11-13 to try and ensure that every student achieves 14 credits per subject,
aiming to increase Merit and Excellence endorsements where possible.
● Use the Learning Progression Framework developed at Level 5 and 6 is available in 2018 we will use it
for professional learning and development.
● Work on structure of the junior curriculum to enable effective reporting against curriculum levels.
● Identify those not on track to get 14 credits per subject are the target students for 2018. Teachers will
have a target student roll and will gather evidence from lessons to ensure there is acceleration, this will
be aided by targeted programmes and the construction of IEP’s for at risk students.
● Identify common literacy strategies and access professional learning and development to support the
teachers across all subject areas to accelerate writing. In 2018 there will be a literacy and possibly
numeracy class introduced into Y10 to accelerate the achievement of targeted students.
● Teachers to gather daily information formatively to inform teaching and meet learning needs. This will
enable them to provide evidence of shifts on an ongoing basis-day by day.
● The ongoing development of culturally responsive pedagogy will increase engagement and outcomes
for students.
● Create data checkpoints that enable increased tracking of students-could be self assessment, student
voice, student work, etc not testing
1. Teaching as Inquiry
The primary purpose of teaching as inquiry is to improve outcomes for students through purposeful
assessment, planned action, strategic teaching and focused review.
(The New Zealand Curriculum Update – Issue 12 August 2011)
We will use Teaching as Inquiry to drive professional learning, collaboration and inquiry across the community
of learning to raise student achievement and professional knowledge.
Teachers of the Kaipara Community of Learning are reflective practitioners who adapt their teaching practice
in response to the evaluation of their impact on student learning. Therefore, it is expected that all teachers will
carry out an ongoing cycle of inquiry into their pedagogy and practice as part of our collective approach to our
achievement challenges in Mathematics and Writing.
14Systematic, collaborative inquiry processes and challenging professional learning opportunities aligned
with the Communities vision, values, goals and targets
EFFECTIVE PRACTICE INDICATORS IMPACT MEASUREMENT TOOLS
The professional community:
● shares high, clear and equitable expectations for student learning, Student Achievement Data - formal and anecdotal
Observations
achievement, progress and wellbeing
Inquiry Planning
● gathers, analyses and uses evidence of student learning and
outcomes to improve individual and collective practice Student evidence - artefacts
Collection and analysis of Student Voice
● engages in systematic, evidence-informed professional inquiry to
Classroom Observations
improve outcomes for students.
Records of Practice Analysis Conversations
Teacher Reflections
Professional learning opportunities:
● integrate theory and practice Meeting Minutes
● engage, and if necessary, challenge teachers’ prior beliefs Regular Target Student Reports
● promote cultural and linguistic responsiveness
● encourage teachers to individually and collectively take responsibility
for their own professional learning and improvement
● deepen understanding of the curriculum and of pedagogical and
assessment practices that promote conceptual understanding and
learning-to-learn capabilities
● develop teacher knowledge and adaptive expertise using
context-specific approaches that are informed by research
● provide multiple opportunities to learn and apply new knowledge, and
to process it with others
● enable teachers to activate educationally powerful connections.
Organisational structures, processes and practices enable and sustain
collaborative learning and decision making
● Clear plans for improvement incorporate multiple professional Student Achievement Data - formal and anecdotal
learning opportunities and monitoring of anticipated changes in Observations
teacher practice and student outcomes. Inquiry Planning
● Leaders provide for deep learning by focusing on one or two areas Student evidence - artefacts
until substantial gains in outcomes are achieved. Collection and analysis of Student Voice
Classroom Observations
Leaders and teachers: Records of Practice Analysis Conversations
Teacher Reflections
● use evidence of student learning and progress as a catalyst for
Meeting Minutes
professional dialogue
Regular Target student reports
● participate in regular, purposeful classroom visits and observations
and provide formative feedback
● engage in open-to-learning conversations as they identify and
investigate problems of practice, set goals and develop
evidence-based solutions, asking themselves what works (practical
insight) and why (theory.
● work collaboratively to plan curriculum, design tasks and activities,
and assess and evaluate
● develop and share resources, materials and smart tools
● monitor and evaluate the impact of actions on student outcomes.
● Relationships characterised by mutual respect and challenge,
support development of self-efficacy and agency.
● Leaders and teachers seek evidence about the effectiveness of
professional learning processes in terms of teacher practice and
student outcomes.
● Professional leaders and teachers engage with and contribute to the
wider education community.
15There are five key elements to the Teaching as Inquiry process we will use.
Focused on…
● Teacher’s inquiry cycles will be focused on individual students or groups of students with specifically
identified needs that relate to the CoL achievement challenges.
● Students will initially be identified using a range of data and other evidence that has been critically
analysed in terms of the students’ progress in relation to National Standards and/or the expected
achievement levels as set out in the New Zealand Curriculum. Other identifiers will be taken into
consideration as part of the inquiry planning process.
● The focus of the inquiry will be on teaching practice that will remove barriers to learning and improve
the students’ outcomes. This practice may not be limited to classroom teaching strategies –
consideration must be given to other forms of support that may be required.
Planned for…
● Using cyclical model of inquiry for example, Timperley’s Spiral of Inquiry, but encompassing the models
used by individual schools.
● Each inquiry plan will be a living document and evidence regular reflection, ongoing decision-making
and evaluation for future inquiries.
● Each teacher will plan for regular check-points with a critical friend and will engage in planned practice
analysis conversations.
● Due to the spiral nature of inquiry, links between different and/or ongoing cycles should be evidenced.
Principles of Learning…
● Learner at the centre
● The social nature of learning
● Emotions are integral to learning
● Recognising individual differences
● Stretching all students
● Assessment for learning
● Building horizontal connections
16Inthe early phases of planning an inquiry, teachers will give full consideration not only to specifically
targeted teaching/learning strategies and activities but also to the wider principles of learning (where
applicable) in order to gain a wider perspective on the student(s) and their learning.
Collaborative…
● At every stage of the teaching as inquiry process, teachers will engage in professional discussion with
parents and whanau, colleagues and other outside agencies where and when appropriate.
● Every teacher will be encouraged to have a critical friend with whom to discuss and review their
teaching as inquiry planning, implementation, outcomes and reflection/evaluation on a regular basis.
● Every teacher will be coached in conducting practice analysis conversations and targeted observations.
Initially this will form part of the across schools or within schools role, however by building teacher
capability in this area we can ensure sustainable practice in teaching as inquiry across the CoL.
● Teachers will be encouraged to participate in whole staff meetings and across school meetings (if
required) focusing on teaching as inquiry where every teacher will be expected to share and discuss
their inquiries, give and receive constructive feedback and reflect on the impact of their teaching on the
target student(s).
● Teaching as Inquiry is a critical element of the school appraisal process.
Measurable…
● Identification of students will be based on robust data gathered in formal and informal assessments.
This data will be referenced back to National Standards expectations and/or established achievement
criteria.
● When planning and implementing an inquiry, a range of evidence will be collected (over time) that
supports the decisions made about a student’s progress.
● Teachers will aim to bring students closer to the expected level at a rate faster than expected –
accelerated progress. Emphasis will be placed on maintaining accelerated progress until the expected
level is achieved – students may be the focus of a second or third spiral of inquiry to achieve this.
● Evidencing learning through effective planning and learning stories in ECE
172. Develop a connected learning community based on powerful relationships
By working effectively together to understand the strengths and weaknesses of our students we will be able to
leverage the knowledge and skills of our teachers and the wider community to promote positive outcomes.
Community collaborations enrich opportunities for students to
become confident, connected, actively involved, lifelong learners
EFFECTIVE PRACTICE INDICATORS IMPACT MEASUREMENT TOOLS
● Teachers, parents, whänau and community engage in
joint activities and interventions to improve learning Artifacts
● Documents
and/or behaviour. ● Meeting Minutes
● Planning
● C.O.L and community work together to support students Quantitative
to make effective transitions at critical points on their
● NS Data
educational journey.
● Termly assessment tools
Qualitative
● The C.O.L proactively identifies and draws on ● Surveys / Interviews
community resources to enhance student learning ● Commonality of Language.
opportunities, achievement and wellbeing. ● Observations
3. Culturally responsive and relational pedagogies
Culturally responsive and relational pedagogy is understood to be the contexts for learning where learners are
able to connect new learning to their own prior knowledge and cultural experiences. Each learner’s ‘cultural
toolkit’ (Bruner 1996), is accepted as valid and legitimate. In this way, cognitive levels and learning activities
are responsive to the interests and abilities of the individual learner (Kep.org.nz).
WIthin culturally responsive relational pedagogy the aim is that learning activities are interactive, dialogic and
spiralling and students have opportunities to engage within their zone of proximal development (Vygotsky,
1976). This will improve engagement, increase academic achievement and promote life long learners.
To embed a culturally responsive and relational pedagogy within a kura it is essential there is a triangulation of
agents involved in process. These agents enable sustainable change to occur involving the school, whanau
and staff is essential. The development of shared understanding of what culturally responsive and relational
pedagogy looks like within the context should be developed through the co-construction of pedagogical
practices of all those involved.This process will promote engagement and support well-being within schools.
Teaching and learning roles are interdependent, fluid and dynamic; students and teachers are able to learn
with and from other learners (ako). Feedback and feed-forward provides learners with specific information
about what has been done well and what needs to be done to improve (Kep.org.nz).
This is especially important for Maori students. The vision of Ka Hikitia – Accelerating Success 2013–2017 is
‘Māori enjoying and achieving education success as Māori’. This vision means ensuring that all Māori
students, their parents and their whānau participate in and contribute to an engaging and enjoyable
educational journey that recognises and celebrates their unique identity, language and culture. This journey
will support Māori students to achieve the skills, knowledge and qualifications they need to achieve success in
te ao Māori, New Zealand and in the wider world. This can only happen when the educational context is
operating in a culturally responsive and relational manner.
While working to co-construct a culturally responsive and relational pedagogy it is important that agency is
driving this process. Culturally responsive and relational leaders and teachers need to be potential focused.
18They must understand they have the agency to create contexts for learning and they use evidence of this to
understand their own effectiveness (Kep.org.nz).
Involving students as agents of change is empowering and when done in a culturally responsive and relational
manner ownership is shared and a true community of learning can be built.
Utilising a common pedagogy that responds to the culture of our learners will increase levels of engagement.
This in turn will provide a lens through which we can examine how effectively our current school/ECE
processes, practices and activities are promoting equitable outcomes for all students. Inc student agency and
parent voice.
Effective, culturally responsive pedagogy supports and promotes student learning
EFFECTIVE PRACTICE INDICATORS IMPACT MEASUREMENT TOOLS
● Student identities and whänau and community knowledge,
language and culture are represented in curriculum materials Artifacts
and the enacted curriculum.
● Documents
● Meeting Minutes
● The curriculum makes connections to learners’ lives, prior ● Planning
understandings, out-of-school experiences and real-world
contexts. Quantitative
● The cultural competencies for teachers of Mäori students – ● NS Data
● Termly assessment tools
tätaiako: manaakitanga, ako, whanaungatanga, wänanga and
tangata whenuatanga – can be observed in teacher practice. Qualitative
● Teaching practices are consistent with culturally responsive and Cultural Competency aspect Lead by Senior Kaipara College
relational pedagogies. Students.
● Surveys / Interviews - Student voice.
● Teachers use differentiation and a variety of teaching strategies
● Surveys / Interviews - Teacher voice.
to engage students and ensure a balance of surface, deep and ● Commonality of Language.
conceptual learning. ● Observations
● Teaching practices such as questioning, wait time, and providing External - Third Party
opportunities for application, problem solving and invention
engage students in learning and thinking. ● NZCER WellBeing Survey
● Student learning is scaffolded through the use of practices such
as prompts, open questions, explanations, worked examples
and active discussion and through the provision of appropriate
tools and resources.
● Students develop learning-to-learn capabilities by engaging in
disciplinary thinking (for example, nature of science or historical)
and in thinking that extends across learning areas.
● Teachers promote achievement of learning outcomes by
deliberately aligning task design, teaching activities and
resources, and home support.
● Students use digital devices and ICT resources in ways that
promote productive thinking and digital and technological
fluency.78
194. Create effective pathways and transitions from ECE to Post-Secondary Success
“Effective transitions are critical to the development of children’s
self-worth, confidence and resilience and ongoing success at school.”
(Continuity of Learning: transitions from early childhood services to schools, Education Review Office, May 2015)
By adopting a collective approach to managing transitions we will establish a shared understanding of good
practice within our community of learning. This will promote rigour and knowledge across our educational
settings, providing each new transition step with the knowledge necessary to accelerate student achievement.
Community collaborations enrich opportunities for students to
become confident, connected, actively involved, lifelong learners
EFFECTIVE PRACTICE INDICATORS IMPACT MEASUREMENT TOOLS
● Teachers, parents, whänau and community engage in
joint activities and interventions to improve learning Artifacts
● Documents
and/or behaviour. ● Meeting Minutes
● Planning
● C.O.L and community work together to support Quantitative
students to make effective transitions at critical points ● NS Data (Year 1) Year 9 Data
● Termly assessment tools
on their educational journey.
Qualitative
● Surveys / Interviews - sample of transitioning /
● The C.O.L proactively identifies and draws on transitioned students
community resources to enhance student learning ● Commonality of Language.
opportunities, achievement and wellbeing.
The Kaipara Community of Learning recognises three essential and closely-linked aspects in the successful
transition from our contributing Early Childhood Services to Post-Secondary success:
● Effective Relationships
● Connected Curricula
● Shared Achievement Information
A.Effective Relationships
As a Community of Learning, the Kaipara CoL will collectively seek to develop processes that ensure
continuity in the relationships between the student, their whanau and the ECE and school in order to support
children settling into school successfully. Increased communication between ECE and school is critical for
new entrant teachers to develop real, in-depth knowledge of their newly enrolled students, their whanau and
the students interests and achievements. Increasing reciprocal visits, transition programmes and opportunities
to share information and exchange ideas between both services, whanau and students will be explored.
Collaboration and sharing of information between new entrant teachers at CoL schools will provide a degree of
continuity in the Kaipara region, as ECE services contribute to all our schools.
The primary school students attend manual at Kaipara College which allows them to build effective
relationships with staff and students prior to attending the college. Open days and evenings are organised to
ensure whanau can transition easily from primary school into the secondary context.
20B.Connected Curricula
A deep understanding of both Te Whariki and the New Zealand Curriculum (especially the literacy learning
progressions and literacy and mathematics National Standards) has proven essential in contributing to
successful transition to primary school. A collaborative approach to planning a programme for the first few
weeks at school that is targeted to the child’s strengths, interests, culture and capabilities and bridges the
transition period may be considered.
C. Shared Achievement Information
By developing systems and processes for ensuring the transfer of achievement information between ECE and
school services, new entrant teachers will develop a better understanding of the akonga entering their classes.
While parents are generally encouraged to share their child’s learning journals there seem to be few formal
processes for ensuring this takes place. By formalising this process and with increased understanding of the
learning recorded through learning stories, ease of the continuity of learning will be ensured. Similarly, sharing
of school entry assessments, observations and anecdotal information with ECE providers will serve to better
inform their transition programmes. Data is also shared by the primary schools with the secondary school on
the student’s achievement. The primary schools also provide valuable qualitative data to help with class
placements and this allows the secondary school to create positive learning spaces.
All three aspects rely on developing a strong, collaborative learning community in the Kaipara region.
Kaipara Community of Learning Organisational Structure
21You can also read