Bridging the Gap Between BER and Eye Diagrams - A BER Contour Tutorial
←
→
Page content transcription
If your browser does not render page correctly, please read the page content below
Bridging the Gap Between BER and
Eye Diagrams — A BER Contour Tutorial
Application Note

Abstract
This paper provides an introduction to the BER Contour
measurement – what it is, how it is constructed, and why it is
a valuable way of viewing parametric performance at gigabit
speeds. It also provides illustrative examples of BER Contour
in action, takwith a BERTScope Bit Error Rate Analyzeri.
Application Note

Figure 1. Simple BER.

BER and Eye Diagrams: Why Neither
is a Complete Depiction
Most communication links are ultimately judged on their Bit
Error Rate (BER) per-formance – how many bits arrive at their
destination in error. Like a test at school, a BER tester (BERT)
will tell you the link’s test score, whether 9 out of 10, or 1 out
of 10. Unfortunately, this doesn’t tell you qualitative information   Figure 2. Eye diagram.

on why that score was achieved, or how to go about getting
a better score. For this, people have tradition-ally turned to
                                                                      1. First, they grab a small part of any signal at a time, and that
sampling oscilloscopes to show eye diagrams.
                                                                         small part is only taken at a rate of a few hundred thousand
Eye diagrams are an intuitive way of viewing parametric                  per second. This compares to real data bits flying past at
performance. If done correctly, an eye should show every                 rates of 10 billion per second (for a 10 Gb/s link). This is a
possible pattern combination overlaid, one on top of the other.          very sparse sampling of what is really going on, and makes
With all combinations in one place, it becomes easy to see               it extremely unlikely that a sampling oscilloscope will catch
when rise times are too slow, when overshoot is present, or              the one mistake in 1,000,000,000 bits that is being sought.
when the eye is being closed due to jitter. So, why not use eye
                                                                      2. Sampling scopes and BERTs have very different methods
diagrams as the main measurement of link performance?
                                                                         of acquiring data – the former has very wide bandwidth
A big problem comes from the expectations that are set for               but sparse sampling – the latter measures every bit but
communica-tions links. Instead of the link being expected to             has a limited input frequency response, more in line with
achieve 9 out of 10, or 99 out of 100 (as is the case for some           the network equipment that it is emulating. These differ-
wireless connections), many high speed links are expected                ences mean that there can be significant result differences
to achieve a score of 999,999,999 out of 1,000,000,000                   between each class of instrument.
correctly delivered bits (a BER of 1x10⁻⁹) or better. Frequently,
                                                                      A method of viewing link performance that is intuitive, but
1x10-12 is the requirement, although many system vendors are
                                                                      that contains all of the information needed to judge real
asking their component suppliers to prove their components
                                                                      link performance would be handy. This is the reason that
to 1x10-15 or better.
                                                                      engineers are increasingly turning to BER contour as a
In order to construct an eye, a sampling scope measures               powerful indicator. To understand how a BERT Contour is
voltage samples. These voltage snapshots differ from                  constructed, it is useful to understand how a BERT gathers
measured BER points in a number of important ways.                    information.

2    www.tektronix.com/bertscope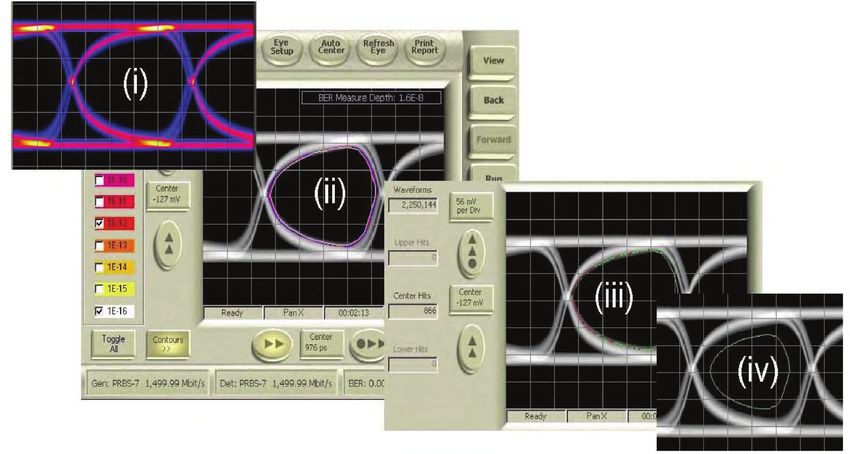
Bridging the Gap Between BER and Eye Diagrams

Figure 3. BERT Decision Point in the center of the eye.              Figure 4. Moving the decision point in time.

Introducing BER Contour                                              A small movement has no effect in this example – the decision
                                                                     point is in an unobstructed region and each decision made is
A BERT Error Detector front-end behaves a lot like a digital         the correct one. It becomes more interesting as the decision
receiver in any high-speed communications link – its purpose         point is moved further. As it nears the crossing point of the
is to make the correct decision on whether an incoming signal        eye diagram, it still gets the answer right most of the time.
is a one or a zero. To do this, it takes a snapshot at an instant    However, eventually it will encounter the latest arriving edge –
of time. At that instant, the incoming signal is compared to         the one edge that is furthest to the right in our example. This
a voltage threshold – which side of the threshold the signal         edge might have separated from the majority of edges, and
happens to be on dictates whether it is judged a one or a            be later in time, because it arose from a particular bit pattern
zero. It does this on every single incoming bit, triggered by        combination that was the most difficult for this particular
a clock that is synchronous with the data. Unlike many data          link under test; a runt ‘1’ in a bandwidth-limited system, for
receivers, a BERT Error Detector is able to place the decision       example. This one edge means that the decision point sees a
point very accurately in voltage and time.                           voltage level higher than it was expecting to see, and registers
Under normal conditions, a decision point is placed in the           it as an error. This is not the normal operating condition of a
middle of the eye, roughly halfway through the bit period, and       conventional receiver; instead, it is an artificial condition we
halfway between the bottom and top voltage rails. This gives         have created that allows us to probe the anatomy of that part
the detector the best chance of making the correct decision          of the eye diagram.
on each bit.
The picture gets more interesting when the decision point
is moved away from this ideal. Imagine a decision point at
a voltage half way between the two rails, in the center of
the eye. Moving the delay setting between clock and data
channels will have the effect of keeping the decision point at
the same voltage level, but moving it in time. This looks like the
decision point moving left or right within the eye diagram.

                                                                                                                    www.tektronix.com/bertscope   3
Application Note

Figure 5. Creating a horizon-tal slice through the eye cros-sing point to map out the   Figure 6. Moving the decision point voltage to take a vertical slice through the eye.
anatomy of jitter.

Moving the decision point further to the left, more late edges                          The discussion so far has been about moving the decision
will be encountered, and more errors registered. By the time                            point in time. This is very useful in probing the jitter
the middle of the crossing point is reached, the incorrect                              performance of a link, and scanning like this is called for in
decision is being made a lot of the time. Plotting time on                              standards such as MJSQii for a test known as Bathtub Jitter or
one axis, and errors encountered on the other axis will                                 BERTScan.
create a very informative plot. For example, if the first edge
                                                                                        A similar idea can be applied to the vertical (voltage) direction.
encountered is observed frequently and is tightly bunched
                                                                                        With the decision point in the center of the eye, keeping
with all of the other edges, we have a healthy eye that has
                                                                                        the delay setting constant, the threshold voltage is moved.
nothing lurking to catch us out in normal operation. Placing
                                                                                        Imagine an example where the threshold is moved up in
a normal receiver with a decision point in the center of the
                                                                                        voltage. Eventually it will reach a point where it encounters
eye at the end of this link will give us a score better than our
                                                                                        the bit that has the lowest one level. This might be a bit that
999,999,999 out of 1,000,000,000 correctly interpreted bits.
                                                                                        never quite reaches full height before being forced back to
Of more concern is a situation where one edge occasionally
                                                                                        zero in the next bit period, and could have arisen because of
is caused to appear very late – late enough to mean that even
                                                                                        charge effects in the semiconductor from which the circuit is
with the decision point in the middle of the eye, the wrong
                                                                                        constructed. Once again, scanning further upwards will cause
decision is made. Infrequently occurring events like this are the
                                                                                        more ‘low ones’ to be encountered, until most logic ones are
difference between an unhappy customer returning parts and
                                                                                        falling below the threshold level and are being counted as
canceling contracts, and a correctly functioning link. These
                                                                                        zeros. We can plot the errors detected against the threshold
events occur seldom enough to mean that a sparsely sampled
                                                                                        voltage and produce another slice through the eye that tells us
measurement system such as a sampling scope is unlikely to
                                                                                        about the health of the system.
catch them.

4    www.tektronix.com/bertscope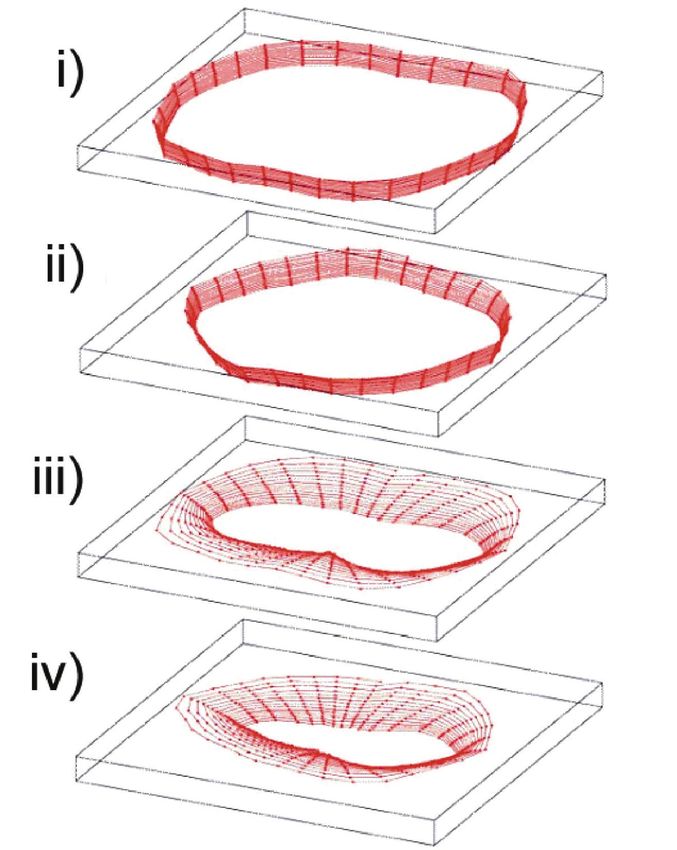
Bridging the Gap Between BER and Eye Diagrams

Figure 7(a) & 7(b). Taking multiple slices through the eye at different angles to construct a more complete anatomical view. 7(b) shows a real BER Contour measurement in progress.

The next logical step is to extend this idea to slices taken                               where (if anywhere) we could place a decision point to achieve
at other angles than the two orthogonal ones picked so far.                                error-free operation. Notice that the BER contours fall inside
These slices build up a more complete picture of the eye,                                  the visible representation of the eye in Figure 8. In other words,
expressed in BER terms. Taking each curve and finding the                                  there are infrequently occurring events that are not visible in
1x10⁻⁶ BER point, for example, and joining this point to the                               a conventional eye diagram that are physically present and
other 1x10⁻⁶ points obtained from the other curves creates a                               would limit system performance.
contour of “iso-BER”. In simpler terms, it creates something
                                                                                           Before discussing some real examples of BER contour, the
similar to a topographical map of the eye, where the hills are
                                                                                           next section will discuss some of the practical considerations
poor BER and the valleys are good BER.
                                                                                           of the Eye Contour measurement.
This view is far more revealing than the two separate simple
slices we discussed before. We can now see whether there
are lurking problems at any point in the eye, and can see

                                                                                                                                           www.tektronix.com/bertscope            5
Application Note
necessary to achieve the re-quired result. They tend to be
complex to control, and non-linear – linear voltage changes
do not often give linear changes in delay. There can also be
gaps, hysterisis, and changing relationships with temperature
and frequency. In commercial instruments, these problems
are mitigated by calibrating the delay function, and with
calibration, 100-fs steps are reliably and repeatably achievable
(not to be confused with claims of 100 fs typical resolution,
which gives no information about the accuracy of delay
setting). In order to get accurate BER contour results, it is vital
that calibration of such small steps is carried out immediately
before the measurements are taken.
Detector Input Performance
How It’s Done – Instrument BERTs are often judged by the quality of their pattern
generator output waveform. These have generally become
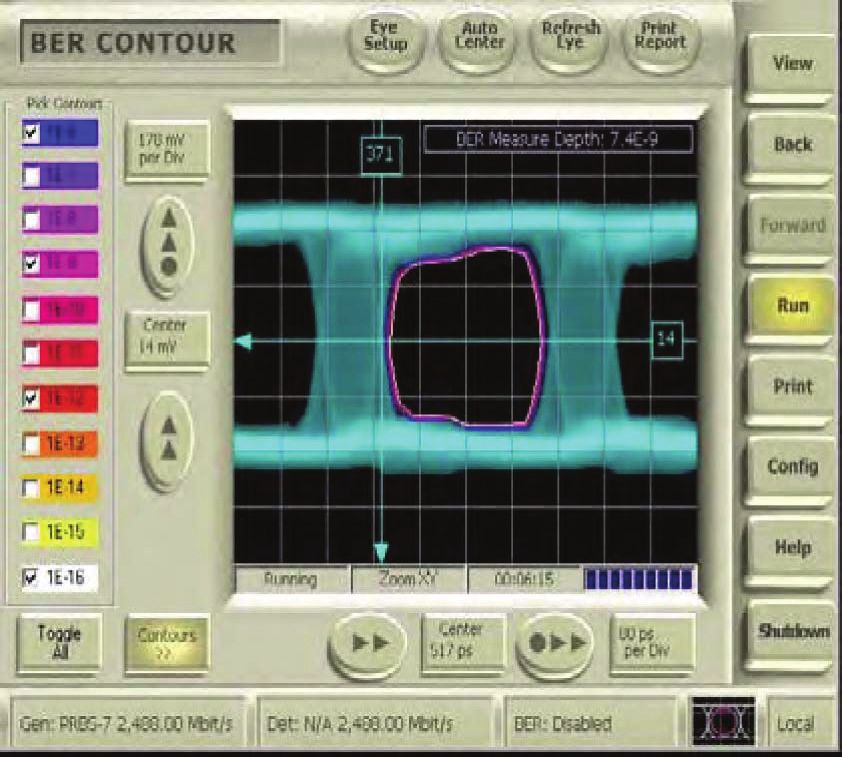
Figure 8. BER Contour display showing lines of constant BER. so good that most BERTs in the marketplace have waveform
quality far exceeding the performance of the devices that they
are intended to stimulate. Of more importance for many of the
advanced measurements now possible with modern BERTs
Considerations is the error detector input performance. This is an instrument
quality input, and so should have sufficient bandwidth so
Accuracy and Setting of the Decision Point
that when it is convolved with the device being measured,
Moving a BERT decision point with the exactness and it does not significantly alter the result. Similarly, the input
repeatability necessary for an accurate BER contour requires circuitry should have a well-controlled frequency response
precision. Setting the voltage threshold precisely turns out to and high return loss to faithfully represent and not alter the
be relatively easy with modern components. A harder task signal being measured. Carefully designed custom integrated
is the setting of precision delays. Most high-performance circuits and modules can be created and packaged to offer
electronic delay line mechanisms are a mixture of fixed excellent single-ended and differential performance faithfully
sections and variable sections, switched in and out as representing detector decision circuits.
6 www.tektronix.com/bertscope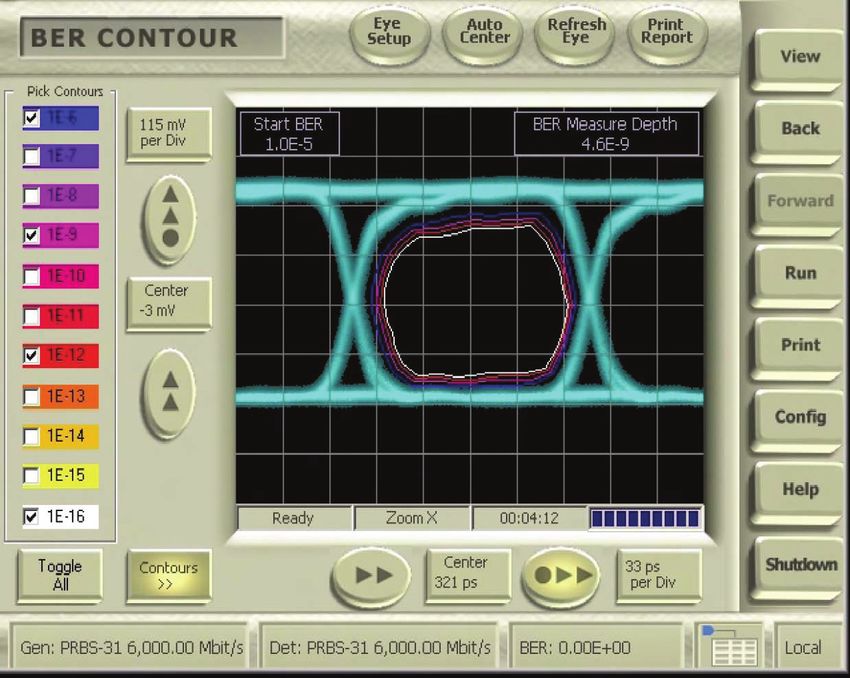
Bridging the Gap Between BER and Eye Diagrams

Speed                                                                Model
1. A third consideration is speed of measurement. Traditionally,     MJSQ is one standard that describes the application of
   BER contour has been a very slow measurement to take.             the double-delta, or Dual-Dirac model. This is one way of
   There have been two reasons for this: Control of the delay/       predicting the behavior of jitter at different points in the eye,
   voltage threshold has been slow, both because of the use          and provides simplification of an often complex situation. It
   of an external delay line and external computer control, and      does this by differentiating between deterministic components
   because of slow responses from the BERT.                          (elements that behave the same way each time they occur;
                                                                     i.e., are bounded) and random components (elements
2. Greatest accuracy of measured points comes from ac-
                                                                     such as noise that are unpredictable at any given instant,
   curately measuring low BER levels. BER levels like 1x10-12
                                                                     and are assumed to obey Gaussian statistics – known as
   take a long time to measure, as each measurement requires
                                                                     ‘unbounded’). By modeling the two components separately
   billions of bits. Such measurements can be required mul-
                                                                     and then adding the behaviors together, it is possible to
   tiple times.
                                                                     predict with reasonable accuracy the behavior of the BER/time
Rather than as an after-thought, by knowing the need                 curve. This was developed for the jitter domain, but has been
to quickly reposition decision points in voltage and time            extended and adapted in the BERTScope to also work in all
and measure even short-segment bit error rates, modern               of the slices used. As is shown in MJSQ Appendix H (January
instruments can address the delay control issue very well. For       draft), greater accuracy of extrapolation can be achieved by
instance, it is possible to reposition a decision point in a few     ignoring points higher up the curve in favor of measured points
microseconds. This capability, coupled with a fully integrated       at lower (longer to measure) BERs. The Dual-Dirac model is an
user interface that automatically determines sampling points         approximation, and users wishing to use their own modeling
and presents the results in an easy-to-view presentation             tools are free to export the underlying data and make their
superimposed on the eye diagram, provides for a very fast            own calculations.
response.
The second point is more complex, and depends upon the
accuracy required. A more-clever approach to the problem
of BER contours takes the quicker-to-measure points first,
and as the measurement is left to run, gradually fills in the
points that take longer. The first points it takes are used to
extrapolate what the lower BER contours will look like, and
then these predictions are gradually enhanced as more data
is taken. Useful information is usually available in less than two
minutes. In this way, the longer measurements needed for the
deepest BER points are taken when absolutely needed, while
intermediate results are immediately available for viewing.

                                                                                                        www.tektronix.com/bertscope   7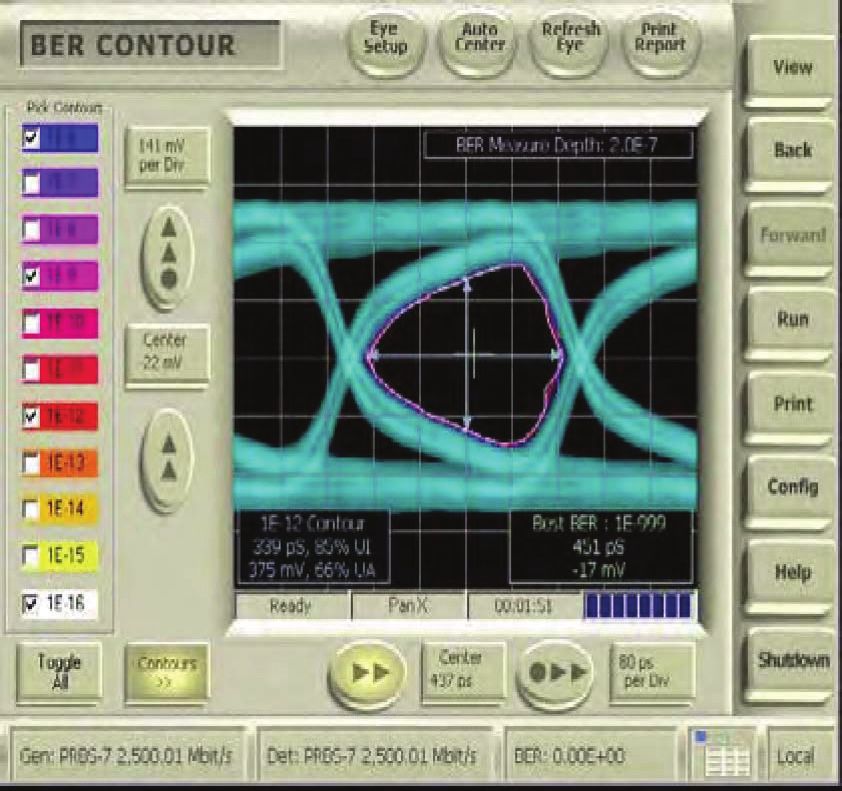
Application Note

Figure 9. Translating BER Contour into a 3-Dimensional “Eye Bowl”.

What BER Contour Can Show You
Looking in 3-D to visualize eye closure –
the “Eye Bowl”
It can be helpful to visualize BER contour in three dimensions
to get a feel for what it is showing you. Figure 9 shows a
BER contour translated into 3-D to give the idea. The 3-D
representation has been dubbed an “Eye Bowl”. The Eye Bowl
images in Figures 9 and 10 were created by exporting BER
Contour data and importing it into a PC-based math program.
In Figure 9, the BER contour data has been mapped as a 3-D
plot, where the unit cell forms the top dimensions and depth
represents BER, with the top face representing approximately         Figure 10. Eye Bowls showing increasingly poorer link performance and increasing BER
10-2, the bottom face 10-16. A BER contour (light blue) has          Contour closure.

been superimposed to aid understanding of the transformation
that has taken place.

8    www.tektronix.com/bertscope
Bridging the Gap Between BER and Eye Diagrams

Figure 11. Benchmarking mask test performance using a BER contour from a golden device. (i) shows the eye diagram. (ii) shows the BER contour. The 10-16 contour was then
exported, and used as a mask. The mask test was run, and failures recorded (iii). The mask is also scalable – (iv) shows 25% margin added in time and voltage.

Having made the transformation, it is then easy to see the                               ‘golden performance’ benchmark, used to perform eye mask
effect of eye closure. The series in Figure 10 shows systems                             testing on subsequent devices to monitor process control,
with steadily worse performance, much of which would be                                  quality, etc. Here the BER contour shape is retained, but
undetectable with a low sample rate eye diagram (although the                            the measurement becomes a fast voltage sampling (a few
BERTScope is uniquely equipped with eye diagram capability                               seconds) as with conventional mask testing, rather than a
that allows orders of magnitude more samples to be taken,                                slow BER-based measurement. Which contour line picked for
and so allows more low probability events to be detected).                               export will decide how stringent the test will be, with low-BER
                                                                                         (small) contours being easier in the voltage domain than high-
An interesting side-note on BER contour is that the iso-BER
                                                                                         error (larger) contours. The sequence is shown in Figure 11.
contour itself can be used as a benchmark, even in fast
manufacturing test applications. By picking one contour
line and exporting it as a mask file, it can become a tailored

                                                                                                                                       www.tektronix.com/bertscope          9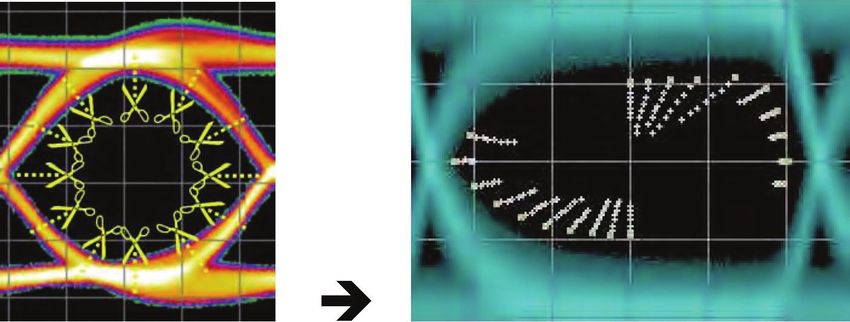
Application Note
Figure 12. Eye diagram and BER Contour of a system with a bounded interference. While this appears like a degraded eye, BER Contours show the system would function
error-free easily, with tightly grouped contour lines.
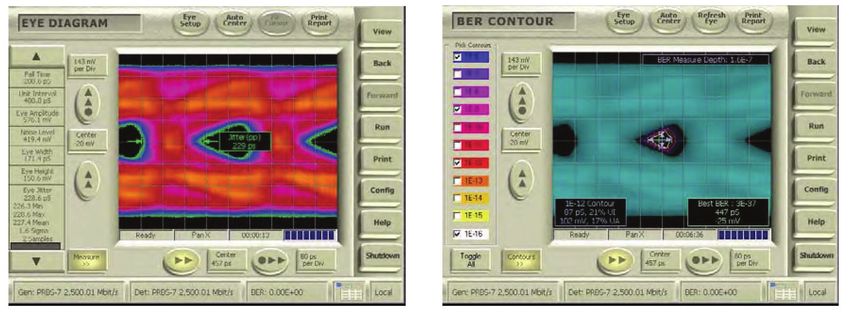
Figure 13. Eye diagram and BER Contour of a system dominated by unbounded interference (random jitter, RJ. The eye diagram seems to show a good quality system, the
BER Contour reveals that the system is less healthy than it first appears), indicated by widely spread BER Contours, and careful placement of the receiver decision point would
be required to attempt error-free operation if it is achievable.
Examples of BER Contours in their openness can have lurking problems deriving from
unbounded mechanisms. These cases are illustrated in
BER Contour is an excellent way of revealing the true
Figures 12 and 13, respectively.
performance of a system. For example, eye diagrams that
may appear to be severely degraded may have imperfections Construction of ‘stressed eye’ jitter tolerance measurements
caused by mechanisms that are entirely deterministic, with also provides some good examples of particular BER Contour
a high probability of occurrence – or more simply put, what impairments. In the following figures (Figures 14-17), a
you see is what you get, and there is nothing lurking at low BERTScope pattern generator has been impaired in different
probability levels that will cause system problems. The flipside ways.
is also true; some eye diagrams that seem almost textbook
10 www.tektronix.com/bertscopeBridging the Gap Between BER and Eye Diagrams
Figure 14. BER Contour of a signal with an ISI filter (long cable) to induce pattern-de- Figure 15. BER Contour of a good quality signal that has sinusoidal jitter added. SJ is
pendent effects. Note that the effects are bounded and repeatable, with tightly bunched entirely bounded and predict-able, and the BER Contours are tightly bounded.
Contours.
Figure 16. Eye diagram (left) and BER Contour (right) of a fully formed stressed eye containing ISI filter (long cable), sinusoidal jitter, random jitter, and sinusoidal noise (providing verti-
cal closure). This example would present a typical receiver with considerable difficulty.
Figure 17. Two BER Contours of a link formed between two line cards by different cables, and added sinusoidal jitter and noise. The left hand figure shows a passive cable, and
the eye is sufficiently closed for the Dual-Dirac Model to have broken down. The right-hand figure shows a contour of the passive cables replaced by an active ‘eye opening’ cable.
Considerablybetterperformancewouldbeachievablewiththesecondexample.
www.tektronix.com/bertscope 11Conclusion Contact Tektronix:
ASEAN / Australasia (65) 6356 3900
BER Contour provides a revealing view of system parametric Austria* 00800 2255 4835
performance that is intuitive and comprehensive. With recent Balkans, Israel, South Africa and other ISE Countries +41 52 675 3777
advances in instrument technology, it is also now fast and Belgium* 00800 2255 4835
Brazil +55 (11) 3759 7600
accurate, making it a practical proposition in development,
Canada 1 (800) 833-9200
troubleshooting, and verification environments. It can also be
Central East Europe, Ukraine and the Baltics +41 52 675 3777
valuable in benchmarking golden devices in manufacturing. Central Europe & Greece +41 52 675 3777
Denmark +45 80 88 1401
Acknowledgements Finland +41 52 675 3777
France* 00800 2255 4835
Thanks to developers at Cisco for help with the measurements
Germany* 00800 2255 4835
taken in Figure 10. Hong Kong 400-820-5835
i BERTScope BSA125C: 12.5 Gb/s Bit Error Rate Analyzer India 000-800-650-1835
Italy* 00800 2255 4835
provides BER, data-rich eye diagrams, BER Contour, mask
Japan 81 (3) 6714-3010
testing, Q factor and a wealth of other benefits for fast
Luxembourg +41 52 675 3777
analysis and speedy troubleshooting of gigabit devices, Mexico, Central/South America & Caribbean 52 (55) 56 04 50 90
cards and systems. For more information visit Middle East, Asia and North Africa +41 52 675 3777
www.tektronix.com. The Netherlands* 00800 2255 4835
Norway 800 16098
ii MJSQ, or Fiber Channel - Methodologies for Jitter and
People’s Republic of China 400-820-5835
Signal Quality Specification is a document written as part of Poland +41 52 675 3777
the INCITS project T11.2. http://www.t11.org/index.html Portugal 80 08 12370
Republic of Korea 001-800-8255-2835
iii N.S. Bergano, F.W. Kerfoot, and C.R. Davidson, "Margin
Russia & CIS +7 (495) 7484900
Measurements in Optical Amplifier Systems, " in IEEE
South Africa +27 11 206 8360
Photonics Technology Letters, vol.5, no. 3, pp. 304-306, Spain* 00800 2255 4835
Mar. 1993. Sweden* 00800 2255 4835
Switzerland* 00800 2255 4835
Taiwan 886 (2) 2722-9622
United Kingdom & Ireland* 00800 2255 4835
USA 1 (800) 833-9200
* If the European phone number above is not accessible,
please call +41 52 675 3777
Contact List Updated 25 May 2010
For Further Information
Tektronix maintains a comprehensive, constantly expanding collection of
application notes, technical briefs and other resources to help engineers
working on the cutting edge of technology. Please visit www.tektronix.com
Copyright © 2010, Tektronix. All rights reserved. Tektronix products are
covered by U.S. and foreign patents, issued and pending. Information in this
publication supersedes that in all previously published material. Specification
and price change privileges reserved. TEKTRONIX and TEK are registered
trademarks of Tektronix, Inc. All other trade names referenced are the service
marks, trademarks or registered trademarks of their respective companies.
09/10 EA/WWW 65W-26019-0You can also read