FIBER OPTIC DISTRIBUTED STRAIN SENSING USED TO INVESTIGATE THE STRAIN FIELDS IN A WIND TURBINE BLADE AND IN A TEST COUPON WITH OPEN HOLES
←
→
Page content transcription
If your browser does not render page correctly, please read the page content below
FIBER OPTIC DISTRIBUTED STRAIN SENSING USED TO
   INVESTIGATE THE STRAIN FIELDS IN A WIND TURBINE
     BLADE AND IN A TEST COUPON WITH OPEN HOLES
             J. Renee Pedrazzani, Matt Castellucci, Alex K. Sang, Mark E. Froggatt
                              Sandie M. Klute, Dawn K. Gifford

                                   Luna Innovations Incorporated
                                          3157 State St.
                                      Blacksburg VA 24060

                                          ABSTRACT
High resolution fiber optic strain sensing is used to make measurements of the distributed strain
present in both a 9-meter CX-100 wind turbine blade with intentionally introduced defects and in
a laminated composite coupon test sample possessing three open holes. Commercially available
telecommunications-grade, low-bend-loss optical fiber was surface mounted along the spar cap
of the blade and on both faces of the coupon. The amplitude and phase of the light reflected
from the fibers are measured using a commercial Optical Frequency Domain Reflectometer
(OFDR). Changes in the amplitude and phase of the backscattered light are used to determine
the strain along the entire length of the fibers. The measurements taken of the strain in the blade
have 2.5 millimeter spatial resolution, and the measurements of the strain in the coupon have
0.50 millimeter resolution. High-resolution distributed strain measurements reveal the
complexly structured strain fields existing in these laminated composite materials.

                                    1. INTRODUCTION
Composite structures have found wide use in many industries, such as the aerospace, marine, and
petrochemical industries.[1] Laminated composites began to be used in the aerospace industry in
the 1960s,[2] and continue to be popular because of characteristics that include high strength,
stiffness, and stiffness-to-density ratios. Despite these positive attributes, composites are fragile.
Even a minor impact event, such as being struck by a dropped tool, can cause significant damage
in a thin walled composite.[1] In addition, intentional defects in the form of holes are often
drilled in composite plates to allow, for example, bolts and rivets to join neighboring plates.[2]
These notches significantly decrease the strength of the laminate, the degree to which depends on
the lay-up, size of the hole, and the thicknesses of the ply and laminate.[3] Test samples
featuring cracks and notches present complex experimental conditions and are challenging to
study; complex damage processes result when the strain gradients interact with material
features.[2] In addition, when the material is brittle, as is the case for many composite materials,
damage may initiate without first being preceded by significant plastic deformation.[1]

Composite materials are complex, as they are both heterogeneous and anisotropic, and modeling
the behavior of composites is difficult. To date, the bulk of studies have explored the linear
elastic behavior of composite materials, rather than the damage process.[2] The nonlinear
behavior of these materials at their physical limits, which is governed by plasticity and damage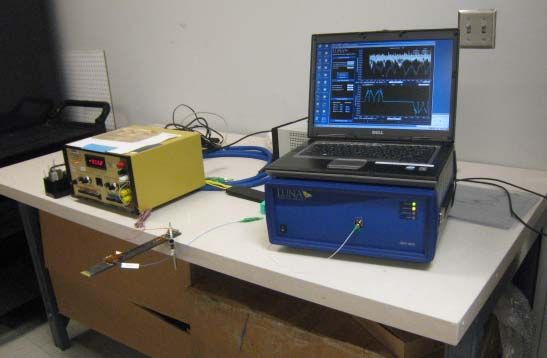
that accumulates on the ply level, is not adequately understood. Computational models capable
of predicting the mechanical response of these materials in this regime, and under conditions in
which their elastic limit has been exceeded and after the first ply failure has occurred, are
needed. At present, models based on the finite element method are being developed, however
their advancement requires validation obtained through comparison with high-resolution
measurements.[4]

Over the past several decades, optical fiber sensing techniques have been developed which make
possible the measurement of strain profiles within a composite material. Optical fiber is ideal for
this application – it is lightweight, small in diameter, immune to EMI, and composed of fused
silica, which is materially compatible with most composites used in the industry. Several
sensing methods have been used to provide distributed sensing over a length of fiber, including
multiplexed Fiber Bragg Gratings, Brillouin scattering, and Raman scattering [5,6]. Froggatt et.
al. showed that the Rayleigh scatter signal reflected from the fiber can be used to form a fully
distributed fiber sensor using a technique known as Optical Frequency Domain Reflectometry
(OFDR) [7]. The three scattering techniques make possible the use of simple, unaltered fiber as
the sensor, enabling a relatively inexpensive distributed sensor. Recent work using the OFDR
sensing technique has shown strain measurements with spatial resolution as fine as a few
millimeters [8-10]. This high spatial resolution enables a detailed and sensitive measure of the
strain profile within a composite material.

Previously, optical sensors have been embedded in composites to detect impact damage,
delaminations, and other failures during testing [11-13]. OFDR has been used to detect localized
regions of high surface strain prior to the formation of a visible crack on a 9-meter CX-100 blade
cycled to failure [14]. In recent work, optical fiber embedded in a CX-100 wind blade with
intentionally introduced defects has been shown effective in elucidating the defects during a
Vacuum Assisted Resin Transfer Molding (VARTM) manufacturing process using a
commercially available OFDR instrument [15]. When this blade was later cycled to failure,
OFDR measurements taken using the embedded optical fibers provided an unprecedented view
into the evolving strain field within the blade and enabled the early and accurate prediction of the
failure location. [16] Additionally, high-resolution distributed fiber optic sensors can be used to
characterize and monitor the background complex strain fields that exist within a composite and
may provide information about damage processes.

                                 2. SENSING TECHNIQUE
The Rayleigh scatter amplitude reflected from an individual fiber as a function of distance is a
random pattern that is formed in the fiber when the fiber is manufactured. While random, it is
static and forms a unique “fingerprint” of that fiber. If a fiber is stretched, or strained, the spatial
frequency of this pattern is also stretched. This elongation leads to a change in the frequency
spectrum reflected from this section of the fiber. These changes can be measured and calibrated
to determine the local strain in the fiber.

OFDR is an interferometric method used to measure the amplitude and phase of light reflected
from an optical fiber as a function of distance [17-18]. Figure 1 shows a diagram of a basic
OFDR measurement system. The light from a swept-tunable laser is split between a reference
and measurement path of an interferometer using a fiber optic coupler. The light in the
measurement path is sent to the fiber under test along the input port of an optical circulator. The
light reflected from the fiber under test returns in the output port of the circulator. This light is
then recombined with the light in the reference path. The combined signal passes through a
polarization beam splitter. The polarization controller in the reference path is used control the
polarization such that the reference light is split evenly between the two outputs of the
polarization beam splitter. The interference pattern between the measurement and reference
signals as the laser is swept across a wavelength range is recorded on two detectors, labeled S
and P. A Fourier transform of these detected signals yields the amplitude and phase of the
reflected light as a function of delay along the fiber. A second (trigger) interferometer with a
known delay is used to compensate for nonlinearities in the laser tuning.
To find the strain at a given location in the fiber, the complex data resulting from the first Fourier
transform is windowed around the desired location. The length of this window becomes the
gauge length of the strain measurement. This length can be as small as a few millimeters. An
inverse Fourier transform of the bandpass filtered data yields the reflected spectrum from that
section of fiber. This spectrum is cross-correlated with a spectrum from the same location
measured with the fiber in a nominal, baseline state. The spectral shift between these two data
sets is then converted to strain or temperature change using a calibration coefficient. This process
is repeated along the fiber length to form a distributed measurement of strain along the fiber [6-
9].
Figure 1. Basic OFDR network.
3. EXPERIMENTATION
3.1 Optical Fiber Sensor, Surface Mounted on a Wind Turbine Blade
The design and manufacture of the experimental CX-100 9-meter wind turbine blade, which has
carbon fiber spar caps, is discussed elsewhere at length. [15, 16] In brief, the blade was designed
by Sandia National Labs and manufactured at TPI composites in Warren, RI. The blade was
manufactured in two halves, with the High Pressure (HP) and Low Pressure (LP) sides of the
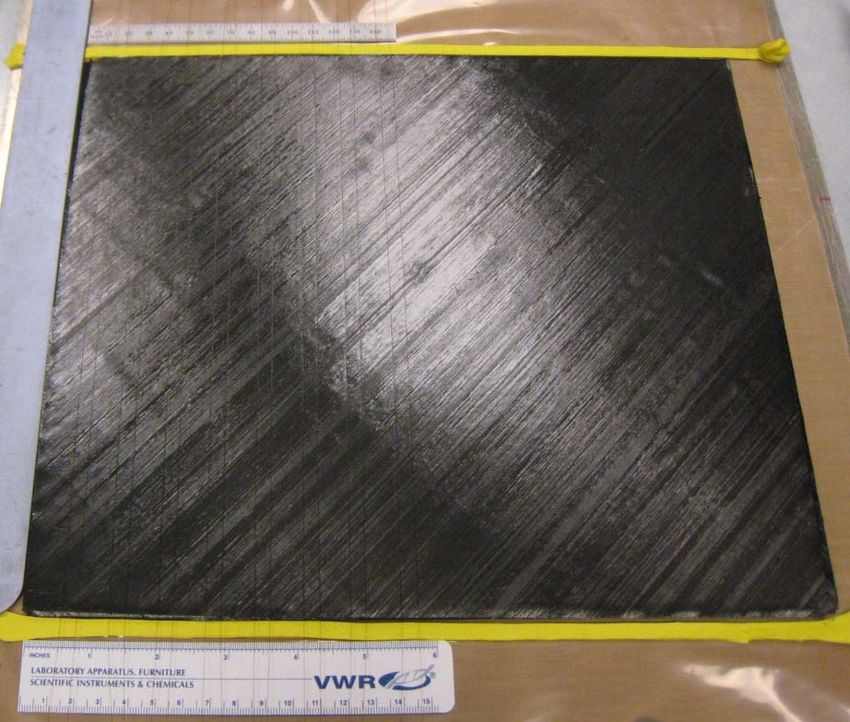
blade mated after cure. Telecom grade, polyimide-coated, low-bend-loss fiber is used as thesensor. The polyimide coating is a commercially available rugged fiber coating that survives temperatures up to 300°C and transfers strain well to the underlying fiber. Optical fiber was embedded within the blade during manufacture. As the outer diameter of the fiber with the coating is 155 micrometers, it has minimal impact on the composite structure. Defects were cast from resin prior to lay-up and introduced into the spar cap region of both the HP and LP sides of the blade at three different spanwise locations: at 3.5m, 5m, and 6m from the blade root. Immediately following manufacture in Rhode Island, the wind turbine blade was shipped to the National Wind Technology Center (NWTC) near Boulder, Colorado, for additional instrumentation and testing. Approximately six months from the time of manufacture, the blade was instrumented with surface bonded optical fiber of the same type embedded within the blade. The optical fibers are bonded to the surface with M-bond AE-10 strain gage epoxy. One fiber on each of the HP and LP surfaces is bonded along the length the spar cap region out to the 7 meter blade station location; it then turns and follows the leading edge back to the root. In the following, measurements taken using the fiber bonded along the surface of the LP spar cap are presented and discussed. 3.2 Laminated Composite Coupon Featuring Three Open Holes The laminated composite coupon sample was cut from a panel fabricated using a commercially available 120 ºC cure, epoxy based, unidirectional, carbon fiber prepreg system. The layup of the panel, seen in Figure 2, is [(+45/-45)4]S. It was cured in a heated platen press under 50 psi. Figure 2: Fabrication of the composite panel. The [(+45/-45)4]S layup of the carbon fiber-epoxy prepreg.
As illustrated in Figure 3, coupons cut from the panel have widths of 32.5 mm and are drilled to
produce samples with three open holes oriented along the center line of the coupon. The holes
are formed while the coupon is held compression by a drilling fixture that also provides backside
support over the region surrounding the area to be drilled.

Figure 3: Depiction of a sample coupon cut from the composite panel. It features three open
holes, an electrical fiber strain gage on the front-side, and four surface bonded optical fibers on
each the front-side and the backside. Measurements are in millimeters.

Each initial, intentionally undersized hole was drilled using a diamond-coated bit, and then the
hole was finish reamed using a carbide reamer to a diameter of 6.35 mm. Four commercially
available, low bend loss, polyimide coated optical fibers are surface bonded to both the front-side
and the backside of the coupon. The optical fibers are oriented straight and parallel to the long
edges of the coupon, and they run between the grip regions. Two optical fibers on each side are
coincident with the edges of the holes, and two are displaced 5 mm inboard from the long edges
of the coupon. An electrical foil strain gauge is mounted to the front-side of the coupon. It is
located close to one grip region and is placed in between the two optical fibers that run on paths
coincident with the edges of the holes.

3.3 Wind Blade Fatigue Testing
Static pull tests, fatigue testing, and property testing of the CX-100 blade were conducted at the
National Wind Technology Center (NWTC) near Boulder, CO and have been described
previously.[16] The blade was mounted in the test stand with the HP side up. A resonant test
apparatus was used to conduct the fatigue test: by exciting the resonant mass at the natural
frequency of the system, an alternating test bending moment was applied to the blade. At
predetermined intervals throughout the fatigue test, the blade was stopped and fiber optic data
were taken with the blade under no load, -170 kg, and +/-226.8 kg load.

3.4 Testing of the Composite Coupon Under Tension and Compression
The laminated composite coupon was tested in a cantilever beam setup, as shown in Figure 4.
The grip region of the coupon that is closest to the strain gage was secured to the edge of a table
using a metal C-clamp. Calibrated weights of 100 g, 200 g, 500 g and 1000 g were alternately
suspended from the distal end of the laminated composite coupon, which results in the top
surface experiencing tension and the bottom surface compression. The output of the foil strain
gage is read by a strain indicator instrument, and the optical fibers are interrogated by a
commercially available OFDR system.

Figure 4: The cantilever beam setup used to apply tension and compression to the composite
coupon. The coupon is affixed to the table so that the front-side, which includes the foil strain
gage, is facing upwards. Calibrated weights are hung from the distal end of the coupon.

3.5 Sensing Parameters
An Optical Backscatter Reflectometer, a commercially available OFDR system, was used to
measure the reflected signal from the fiber throughout the manufacturing process and fatigue
testing. The instrument is capable of measuring up to 70 m of optical fiber with a sampling
spatial resolution of up to 20 microns and strain spatial resolutions as fine as a few millimeters.
For the measurements on the wind blade, a 20 nm scan range was selected, which results in a 40
micron sampling spatial resolution. The strain calculated from this data has a 2.5 mm spatial
resolution along the entire length of the fiber. In the case of the composite coupon sample, a 42
nm scan range was chosen, which produces a 20 micron sampling spatial resolution. The strain
resolution along the length of the optical fiber is 500 microns.
4. RESULTS
4.1 Complexly Structured Strain Field in Wind Turbine Blade
The manufacture of the CX-100 wind turbine blade included engineered defects, and the blade
was subjected to a test that intentionally cycled it to failure. These circumstances encouraged the
close observation of the evolution of the strain field in the regions closely surrounding the
defects.[16] Before any cycles were put on the blade, both embedded and surface mounted
optical fibers reported large strains in the vicinity of the defects. Figure 5 is a plot of the strain
detected by the surface mounted LP fiber prior to the fatigue test. The blade tip is weighted by a
226.8 kg load. The large strains associated with the engineered defects at 3.5, 5 and 6 meters are
easily distinguished, however they are not the only items of interest in these data.
0 0k Cycles (bottom)
-500
Strain [ ]
-1000
-1500
1 2 3 4 5 6 7
Meters [m]
Figure 5: LP surface mounted fiber optic strain data taken prior to fatigue test. Fiber runs along
spar cap and blade is under 226.8 kg load.
Outside of these regions of high strain, the measured strain data is highly structured. Both
embedded and surface mounted fibers report these types of variations in the strain measurement.
Additional measurements show these variations to be repeatable. An example of this can be seen
in Figure 6, and in Figure 7, which is a detail of Figure 6. Plotted in these figures are strain data
taken when the fatigue cycling was halted at pre-determined intervals. Despite the lengthy
intervals separating the scheduled data collection dates and the tens of thousands of cycles the
blade endured between each measurement, the complex structure of the variations in the strain
field stay well intact.
It is hypothesized that these variations in the measured strain result from the high-resolution
distributed fiber sensors detecting fine structures within the composite material. Support for this
comes not only from the repeatability of their measurement during the test, but also from the fact
that the peak to peak amplitude of these variations changes according to the part of the blade theoptical fiber sensing fiber interrogates. Prior to the commencement of fatigue cycling, the strain
variations in regions where the optical fiber is not bonded to the blade span ± 5 . In contrast,
the range is ± 40 in the region where the fiber is surface-bonded to the spar cap, and it is ± 15
where the fiber is surface-bonded to the leading edge. Embedded fibers exhibited variations
of approximately ±40 . It is expected that applying the fiber optic sensors to different
positions on the blade will result in the fibers interrogating different aspects of the small-scale
structures of the composite.
The data taken during the wind blade test encourage additional investigation of the complexly
structured strain fields measured using OFDR techniques in laminated composites. Assuming
these arise from the detection of small-scale variations within the composite structure, they may
be useful in illuminating ply-level changes occurring within the composite. The strain
measurements taken of the wind turbine blade have a resolution of 2.5 mm. The next step is to
examine similar strain variations using finer resolution measurements.
1500
1184 k cycles
1000
736 k cycles
Strain []
500
25 k cycles
0
0 k cycles
-500
1 2 3 4 5 6 7
Meters [m]
Figure 6: LP surface mounted distributed strain data taken at intervals during fatigue testing.
The baselines of the different traces have been offset to facilitate comparison. The blade is under
a load of 226.8 kg in each case.
1184 k cycles
1000
736 k cycles
500
Strain [ ]
25 k cycles
0
0 k cycles
-500
3.6 3.7 3.8 3.9 4 4.1
Meters [m]
Figure 7: Detail of Figure 6 showing the complexly structured strain variations are repeatable
and persistent during fatigue testing.4.2 Complexly Structured Strain Field in Composite Coupon with Three Holes
High-resolution distributed strain data are taken using commercially available optical fibers that
are surface bonded to the front-side and backside of a [(+45/-45)4]S carbon fiber based composite
coupon. The coupon possesses three open holes arranged linearly along the midpoint and a
single strain gage bonded to the front-side. The grip region of the coupon closest to the strain
gage is secured to the edge of a table, and individual calibrated weights are suspended from the
opposite grip region. Strain measurements are taken when 100 g, 200 g, 500 g, and 1000g
weights are used. This loading does not result in damage to the coupon; these measurements are
taken while the sample behavior falls within the elastic linear regime.
Two optical fibers are interrogated for this test: a front-side fiber with a path that coincides with
the edge of the holes, and the corresponding backside fiber. When the front-side of the sample is
viewed from above and the strain gage is located at the top of the coupon, the interrogated fibers
run along the left edge of the holes. The strain resolution is 500 microns. During these tests the
front-side fiber is in tension and the backside fiber is in compression. As expected, the strain
field in proximity to the edge of the holes has the greatest magnitude,[4] and it increases
significantly with larger applied loads.
1600 1000g (top)
500g (2nd from top)
200g (3rd from top)
1400
100g (bottom)
Strain Gage
1200
1000
Strain []
800
600
400
200
0
0 10 20 30 40 50 60 70 80 90 100
Millimeters [mm]
Figure 8: Strains measured by the optical fiber bonded to the front-side surface of the composite
for various loading conditions. Strains reported by the strain gage are also shown.
The strain measured using the fiber bonded to the front-side of the sample, for various loading
conditions, is plotted in Figure 8. Structures in the strain that are visible when the coupon
experiences the lowest loading conditions can be seen to appear in measurements taken under
higher loading conditions. Superimposed on this plot are the strains reported by the foil strain
gage.Table 1: Comparative data between distributed fiber optic sensor and electrical foil gage.
Coupon Loading Foil Gage Strain Fiber Optic Strain Difference
[] Avg over 0.5 mm [%]
[]
100 g 107 95.4 10.8
200 g 230 254.6 6.8
500 g 596 623.7 4.7
1000 g 1203 1263.6 5.0
It is difficult to directly compare the foil strain gage data with the strain data obtained from the
optical fiber sensors. The foil gage and optical fiber are not perfectly co-located, and it is known
that the strain fields arising in notched composites feature sharp and narrow regions of elevated
strain.[4] The foil gage is also a much lower resolution sensor; it averages strain over 5 mm,
while the resolution of the optical fiber sensor is 0.5 mm. As seen in Table 1, despite these
differences the agreement between the strain values reported by the foil gage and by the fiber
sensor is good: less than 7% discrepancy, except in the 100 g low-load case when it is 10.8%.
0
-200
-400
-600
Strain []
-800
-1000
-1200
-1400 1000g (top)
500g (2nd from top)
200g (3rd from top)
-1600
100g (bottom)
0 10 20 30 40 50 60 70 80 90 100
Millimeters [mm]
Figure 9: Strains measured by the optical fiber bonded to the front-side surface of the composite
for various loading conditions.
The strain measured using the fiber bonded to the backside of the sample, for various loading
conditions, is plotted in Figure 9. In these data it is also possible to see structures in the data that
correlate for conditions of lower and higher applied loads.If these structured variations in strain do correlate over a range of loading conditions, it should
be possible to multiply by a constant the measured strains taken under lower loading conditions
to cause them to overlay strains taken under higher loading conditions. This is done for both
fibers, for 500 g and 1000 g loading conditions, and plotted in Figure 10. The upper graph plots
twice the strain measured for the front-side fiber under 500 g loading conditions along with the
strain measured under 1000 g loading conditions. The lower graph plots the corresponding case
for the backside fiber. In both cases there is very good agreement between the two traces. While
the trace derived from the 500 g load case data exhibits some excursions from the 1000 g load
case data, the average paths of the two data overlap well. This is true for both the fiber in tension
and the fiber in compression.
This indicates that these complex variations in strain are measurements directly related to the
underlying composite structure.
1500
Strain []
1000
500
1000g
0 500g, strain multiplied by 2
0 10 20 30 40 50 60 70 80 90 100
Millimeters [mm]
0 1000g
500g, strain multiplied by 2
Strain []
-500
-1000
-1500
0 10 20 30 40 50 60 70 80 90 100
Millimeters [mm]
Figure 10: Comparison of data taken under 500 g and 1000 g loading conditions for the fiber
bonded to the front-side (upper) and the backside (lower). Comparison is facilitated by
multiplying the data taken under the 500 g loading condition by a factor of two.
It is also interesting to compare the strains measured by the front-side and the backside optical
fiber sensors. The fact that multiple plies compose this sample suggests that there should be
little relation between the strain variations detected by the two fiber sensors. In Figure 11, the
traces measured for the front-side and the backside fibers are overlaid for the 1000 g and 500 g
loading cases. This was made possible by multiplying by -1 the strain measured by the backside
fiber. The gross features agree, but there is no obvious relation when the finer structures are
considered. The small-scale structural features read by the two fibers are unique.1600
1400
1200
1000
Strain []
800
600
400
1000g tension (top)
200
1000g compression, strain multiplied by -1 (top)
500g tension (bottom)
0 500g compression, strain multiplied by -1 (bottom)
0 10 20 30 40 50 60 70 80 90 100
Millimeters [mm]
5. CONCLUSIONS
High resolution distributed fiber optic strain sensing is used to investigate apparently repeatable
background variations detected during measurements of distributed strain. These complexly
structured elements of the strain field are examined in 1) data taken by optical fiber sensors
surface bonded to a 9-meter wind turbine blade as the blade is cycled to failure, and 2) data taken
by optical fiber sensors surface bonded to a test coupon cut from a panel fabricated from carbon
fiber epoxy prepreg. In the first case measurements were taken with the blade under a 226.8 kg
load, and in the second case measurements were taken with the coupon in a cantilever beam
configuration and with a range of weights suspended from the free end. In both cases the data
from the fibers were acquired using an Optical Backscatter Reflectometer. It is concluded that
these measured variations in the strain field arise from the detection of small-scale structures
present within the plies of the composite structure. This is significant, as it is known that the
nonlinear damage processes that result in catastrophic failure of composite samples involves ply-
level accumulation of damage. A sensing technique capable of detecting ply-level changes in the
composite could help further understanding of damage mechanisms in composite samples and
assist in the maturation of composite modeling software.
6. ACKNOWLEDGEMENTS
Luna Innovations Incorporated gratefully acknowledges the University of Massachusetts
Lowell’s Wind Energy Research Group (WERG) for allowing us to participate in the Effect of
Defects test, funded by the Department of Energy, as well as the National Renewable Energy
Laboratory’s National Wind Technology Center (NWTC) for their support and expertise in
testing the instrumented blade, and TPI Composites for their assistance in the blade manufacture.
7. REFERENCES
1. Lapczyk, I., and Hurtado, J. A., “Progressive damage modeling in fiber-reinforced
materials.,” Composites: Part A, 38 (2007) pp. 2333-2341.2. Pierron, F., Green, B., and Wisnom, M. R., “Full-field assessment of the damage process of
laminated composite open-2032.
3. Pierron, F., Green, B., Wisnom, M. R., and Hallett, S.R., “Full-field assessment of the
damage process of laminated composite open-hole tensile specimens. Part II: Experimental
Results,” Composites: Part A, 38 (2007) pp. 2321-2332.
4. Flatscher, Th., Wolfahrt, M., Pinter, G., and Pettermann, H.E., “Simulations and experiments
of open hole tension tests – Assessment of Intra-ply plasticity, damage, and localization,”
Composites Science and Technology 72 (2012) pp. 1090-1095.
5. A. J. Rogers, “Distributed optical-fibre sensing,” Meas. Sci. Technol. 10, 75-99 (1999).
6. M. A. Davis, A. D. Kersey, “Simultaneous measurement of temperature and strain using
fiber Bragg gratings and Brillouin scattering,” Proc. SPIE, 2838, 114-123 (1996).
7. M. Froggatt and J. Moore, “High resolution strain measurement in optical fiber with
Rayleigh scatter,” Appl. Opt., 37, 1735-1740 (1998).
8. M. Froggatt, B. Soller, D. Gifford, and M. Wolfe, “Correlation and keying of Rayleigh
scatter for loss and temperature sensing in parallel optical networks,” OFC Technical Digest,
paper PDP 17 (Los Angeles, March 2004).
9. B. J. Soller, D. K. Gifford, M. S. Wolfe, M. E. Froggatt, M. H. Yu, and P. F. Wysocki,
“Measurement of localized heating in fiber optic components with millimeter spatial
resolution,” OFC Technical Digest, paper OFN 3, 2006.
10. S. Kreger, D. K. Gifford, M. E. Froggatt, B. J. Soller, and M. S. Wolfe, "High resolution
distributed strain or temperature measurements in single- and multi-mode fiber using swept-
wavelength interferometry," OFS 18 Technical Digest, Paper ThE42, 2006
11. R.M. Measures, Structural Monitoring with Fiber Optic Technology, 2001, San Diego,
California: Academic Press
12. L. Jinsong and A. Asundi, “Structural Health Monitoring of Smart Composite Materials by
using EFPI and FBG sensors, Sensors and Actuators,” A: Physical 2003; 103(3): p. 330-340.
13. Guemes, A. Fernandez-Lopez, and B. Soller, Structural Health Monitoring, 9 (3), 2010, pp.
233-245
14. A. Kaplan, S. M. Klute, and A. Heaney, “Distributed Optical Fiber Sensing for Wind Blade
Strain Monitoring and Defect Detection.” The 8th International Workshop on Structural
Health Monitoring. Stanford, California, Sept. 13-15, 2011. CD-ROM expected.
15. S. M. Klute, D. K. Gifford, A. K Sang., and M. E. Froggatt, “Defect Detection During
Manufacture of Composite Wind Turbine Blade with Embedded Fiber Optic Distributed
Strain Sensor,” 2011 SAMPE Fall Technical Conference, Ft. Worth, Texas, Oct. 17-20, 2011.
16. J. R. Pedrazzani, S. M. Klute, D. K. Gifford, A. K Sang., and M. E. Froggatt, “Embedded
and surface mounted fiber optics sensors detect manufacturing defects and accumulated
damage as a wind turbine blade is cycled to failure,” SAMPE 2012, Baltimore, MD, May 21-
24, 2012.17. B. J. Soller, D. K. Gifford, M. S. Wolfe, and M. E. Froggatt, “High resolution optical
frequency domain reflectometry for characterization of components and assemblies,” Optics
Express, 13 (2005) p. 674.
18. B. J. Soller, M. Wolfe, and M. E. Froggatt, “Polarization resolved measurement of Rayleigh
backscatter in fiber-optic components,” OFC Technical Digest, paper NWD3 (Los, Angeles,
March, 2005).You can also read