Charged track reconstruction and b-tagging performance in ATLAS
←
→
Page content transcription
If your browser does not render page correctly, please read the page content below
Charged track reconstruction and b-tagging
performance in ATLAS

                                                                                                                                                  PoS(IHEP-LHC-2011)002
Andrea Favareto∗†
Università degli Studi di Milano and INFN Milano
E-mail: andrea.favareto@mi.infn.it

       The ATLAS Inner Detector is designed to provide precision tracking information at LHC lumi-
       nosities with a hermetic detector covering 5 units in pseudo-rapidity. It features a large silicon
       tracker subdivided into a pixel and a strip system for precise tracking and primary/secondary ver-
       tex reconstruction and to provide excellent b-tagging capabilities. A Transition Radiation Tracker
       improves the momentum reconstruction and provides electron identification information.
       The subject of these proceedings is the performance of the ATLAS Inner Detector achieved af-
       ter its first 2 years of operation. The excellent detector performance and more than a decade of
       simulation studies provided a good basis for the commissioning of the offline track and vertex
       reconstruction. Early studies with cosmic events and the ever increasing amount of high quality
       p-p collision data allowed for rapid progress in understanding of the detector. Today the ATLAS
       Inner Detector approaches its design values in most relevant performance criteria. High luminos-
       ity pileup and tracking in central heavy ion events pose additional challenges. An overview of the
       recent tracking performance results and the lessons learned during commissioning will be given,
       including a brief overview of the main b-tagging algorithms and its performances.

LHC on the March,
November 16-18, 2011
Protvino, Moscow region, Russian Federation

     ∗ Speaker.
     † On   behalf of the ATLAS Collaboration

c Copyright owned by the author(s) under the terms of the Creative Commons Attribution-NonCommercial-ShareAlike Licence.   http://pos.sissa.it/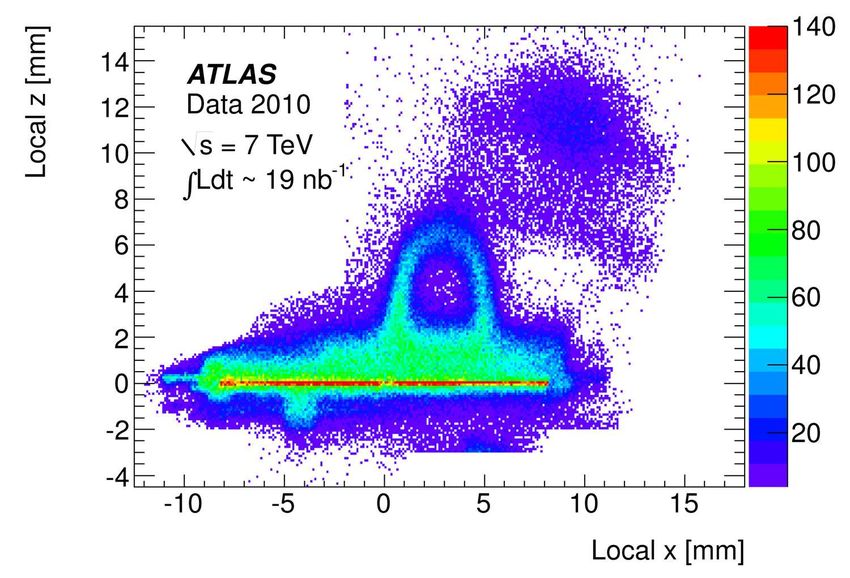
Charged track reconstruction                                                         Andrea Favareto

1. Introduction

     The Large Hadron Collider [1] is a particle physics accelerator built at CERN. It collides
head-on bunches of protons or heavy ions. The analysis of these collisions may help to discover
the Standard Model (SM) Higgs boson or new physics phenomena beyond the SM.
     The ATLAS experiment [2] is a general purpose experiment that records collision events pro-
duced by the LHC. In order to fulfill its scientific objectives, ATLAS is equipped with an Inner
Detector tracking system embedded in a 2 T axial magnetic field surrounding the interaction point.
The calorimetry system is located beyond the ID solenoid and combines two techniques: liquid

                                                                                                        PoS(IHEP-LHC-2011)002
Argon and sampling technique with plastic scintillators embedded in an iron absorber. Finally a
muon detector system which occupies the outermost region of the detector and uses an air-core
toroid with strong bending power in a large volume within a light and open structure.
     In the coordinate system used in ATLAS the nominal interaction point is defined as the origin
of the coordinate system, while the beam direction defines the z-axis and the (x, y) plane is trans-
verse to the beam direction. The positive x-axis is defined as pointing from the interaction point to
the center of the LHC ring and the positive y-axis is defined as pointing upwards. The side-A of the
detector is defined as that with positive z and side-C is that with negative z. The azimuthal angle φ
is measured as usual around the beam axis, and the polar angle θ is the angle from the beam axis.
     The LHC started its operations late 2009, by colliding proton beams at 900 GeV center of
mass energy. During 2010 and 2011 the LHC has produced proton-proton collisions at 7 TeV. The
integrated luminosity recorded by ATLAS amounts to approximately 40 pb−1 in 2010, whilst more
than 5 fb−1 of data were already collected during 2011 at the time of writing. LHC also did collide
in 2010 and in 2011 heavy ions (lead). Such collisions produce far more tracks than the 7 TeV
proton-proton collisions and they do represent a challenge for the ATLAS Inner Detector tracking
system.
This contribution summarizes the tracking, vertexing and b-tagging performance of the ATLAS
Inner detector.

2. The ATLAS Inner Detector

     Tracks and vertices are the basic input for most physics measurements, therefore ATLAS has a
sophisticated tracking system at the center, around the interaction point. The ATLAS Inner Detector
consists of three different sub-detectors which can be seen schematically in Fig.1.
     A superconducting solenoid surrounds the entire tracking system and produces a 2 T axial
magnetic field along the beam axis direction. This magnetic field bends the trajectory of the charged
particles which allows to measure their momentum.
     The innermost part of the ATLAS Inner Detector is the Pixel Detector. It consists of 400 µm ×
50 µm pixels and is arranged in three barrel layers with end-caps on each side of the detector. Typ-
ically three hits are expected for a track passing through all barrel layers. The Pixel Detector is
surrounded by the Semi-Conductor Tracker Detector (SCT) which uses silicon micro-strips to in-
crease the number of space points available for track measurements. The SCT Detector is arranged
in four barrel layers with end-caps. All the layers consist of double-sided modules with a 40 mrad
stereo angle to provide the space-point measurements. Eight hits are expected for a track crossing

                                                 2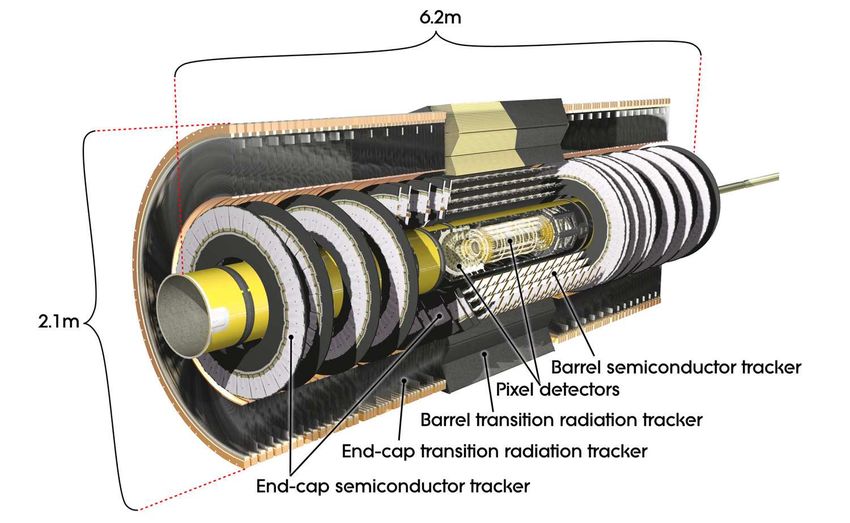
Charged track reconstruction                                                         Andrea Favareto

                                                                                                        PoS(IHEP-LHC-2011)002
                               Figure 1: Schematic view of the Inner Detector

all layers. The Transition Radiation Tracker (TRT) consists of 4 mm diameter straw tubes to extend
the track measurements with about 30 hits for an average track. It is also capable of identifying
electrons through their transition radiation.

3. Track Reconstruction

      Reconstruction of tracks and measurement of their parameters is mandatory for most physics
applications. In particular, the impact parameters and momentum of charged particles have to
be measured with high precision. Tracks are reconstructed within the full ID acceptance range
(|η| < 2.5) using a χ 2 fitter. The pattern recognition [3] works primarily inside-out, associating
first the silicon hits and then extrapolating to the TRT to include its measurements. Though there is
also an outside-in tracking, which uses the TRT track segments seeds plus and inward extension in
order to efficiently reconstruct tracks with secondary interactions. The pattern recognition selects
first very loose track candidates and then a stringent ambiguity processor selects good track candi-
dates (Fig. 2). Only those satisfying a minimum number of silicon hits and a cut in the transverse
and longitudinal impact parameter with respect to the beam spot are kept. The tracking has been
performed down to pT as low as 100 MeV [4] with efficiency shown in Fig. 3.
      Heavy ion conditions give also the opportunity to study tracking under high occupancy condi-
tions, comparable to the ones expected in future high luminosity LHC updates. In this conditions
tighter requirement need to be applied [5].

4. Vertex Reconstruction

    Measured tracks are used to reconstruct the interaction point and secondary vertices from

                                                     3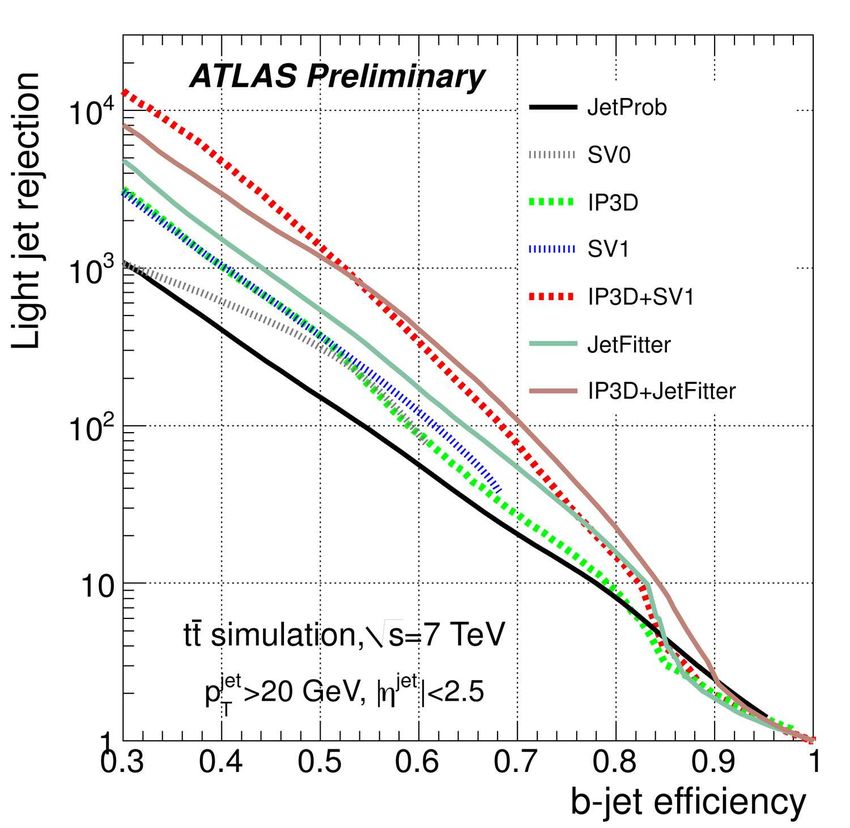
Charged track reconstruction                                                            Andrea Favareto

                                                                                                            PoS(IHEP-LHC-2011)002
Figure 2: Number of track candidates as a function of η and at different stages of the track finding. All
track seeds are plotted in black and the resolved tracks in green. Data are compared with simulation.

Figure 3: Track reconstruction efficiency as a function of η (left) and of pT (right) derived from non-
diffractive MC.

particle decays and interactions with detector material. Excellent performance of the vertex recon-
struction is mandatory for many applications like b-tagging (see section 7) or the identification and
rejection of pile-up, where many pp collisions occur in the same beam crossing. This is especially
relevant at the high peak luminosity of 3.65 × 1033 cm−2 s−1 reached in 2011 which corresponds in
average to 17 interactions per crossing.
     The ATLAS vertex reconstruction works using an iterative algorithm [6]: first a vertex finding
is executed where tracks are associated to a primary vertex and in the second stage the vertex is

                                                   4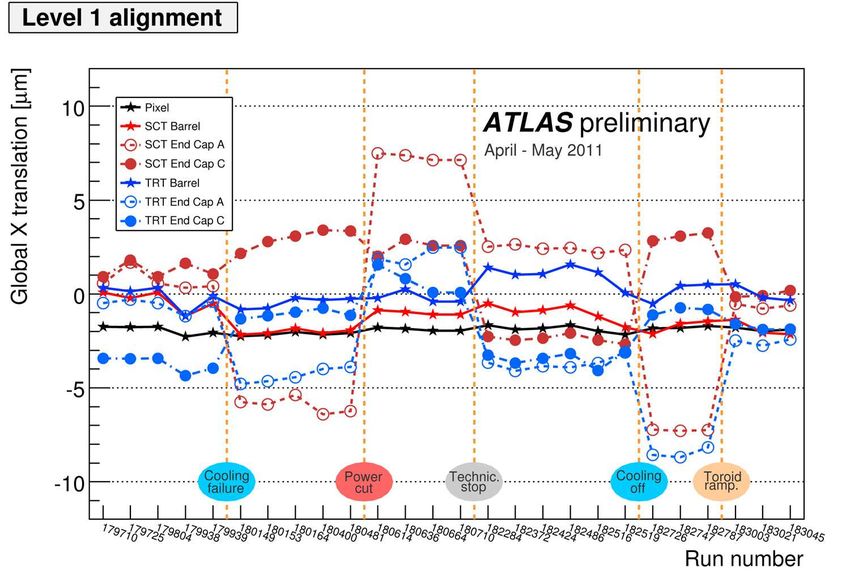
Charged track reconstruction Andrea Favareto
PoS(IHEP-LHC-2011)002
Figure 4: Two dimensional distribution of reconstructed primary vertices in the (x, z) plane (left), and the
estimated vertex resolution σX as a function of tracks per vertex (right).
fitted (with a χ 2 technique). The vertex fitter include a beam-spot constraint, which is routinely
online and offline computed. It is approximatively 15 µm in the transverse plane, and 5.7 mm in
the longitudinal plane as shown in Fig. 4. The primary vertex resolution is extracted using a data
driven method (mainly split vertex technique). It is about 23 µm on the transverse plain and about
40 µm on the longitudinal
q plane for vertices with 70 tracks. It depends on the number of tracks as
well as on the ∑trk p2T . The vertex reconstruction efficiency is sample dependent in fact nearby
vertices can shadow a clean reconstruction. The expected vertex reconstruction efficiency is ∼ 95%
for non-diffractive events.
An excellent vertex resolution has been achieved also for secondary vertices: from MC studies,
for an hadronic interaction, the vertex resolution has been estimated to be 200 − 300 µ m (in both R
and z) for reconstructed vertices with radii ≤ 100 mm and ∼ 1 mm at larger radii [7]. Simulations
have been used also to study higher pile-up scenarios.
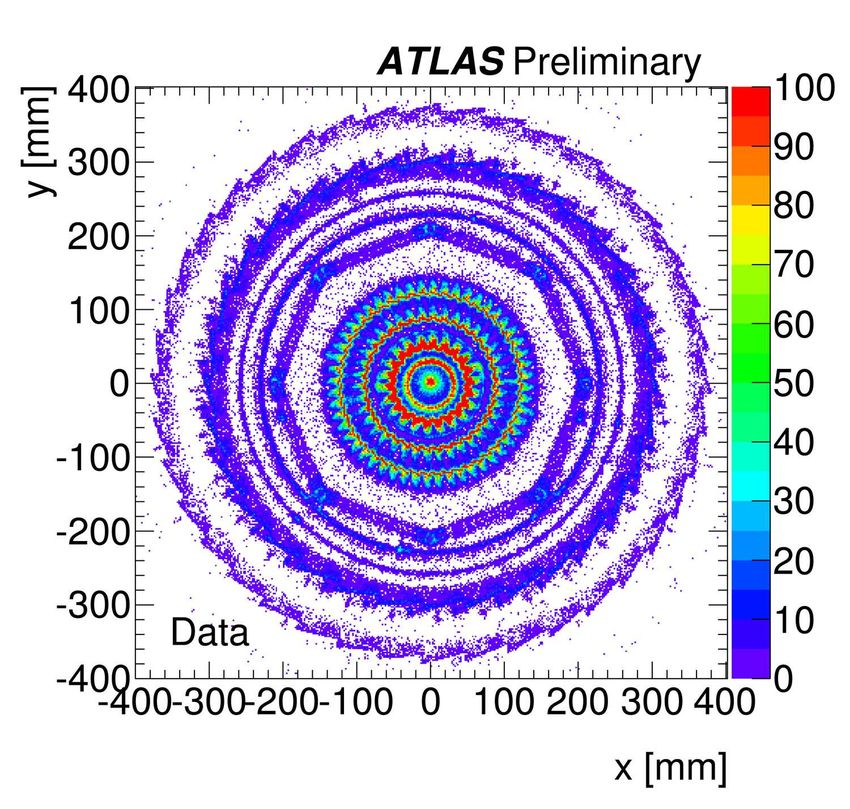
5. Material Studies
The precise knowledge of the material budget within the tracking volume is mandatory for
an accurate track reconstruction and a precise determination of the track parameters. Mapping of
the amount of passive material in the tracking volume is mainly performed using photon conver-
sions and hadronic interactions [7] (Fig. 5). The comparison between real data and simulation of
the spatial distribution of the reconstructed secondary vertices (either with photon conversions or
hadronic interactions) helps to improve the description of material in the detector geometry. In the
same sense, the rate of photon conversions inside the tracker volume compared with the beryllium
beam pipe (very well known object) helps to asses the amount of material inside the real detector.
The material uncertainty in simulation is constrained summing photon conversions and hadronic
interactions with other different techniques (e.g. study of K 0 and other mass signals, study of mul-
5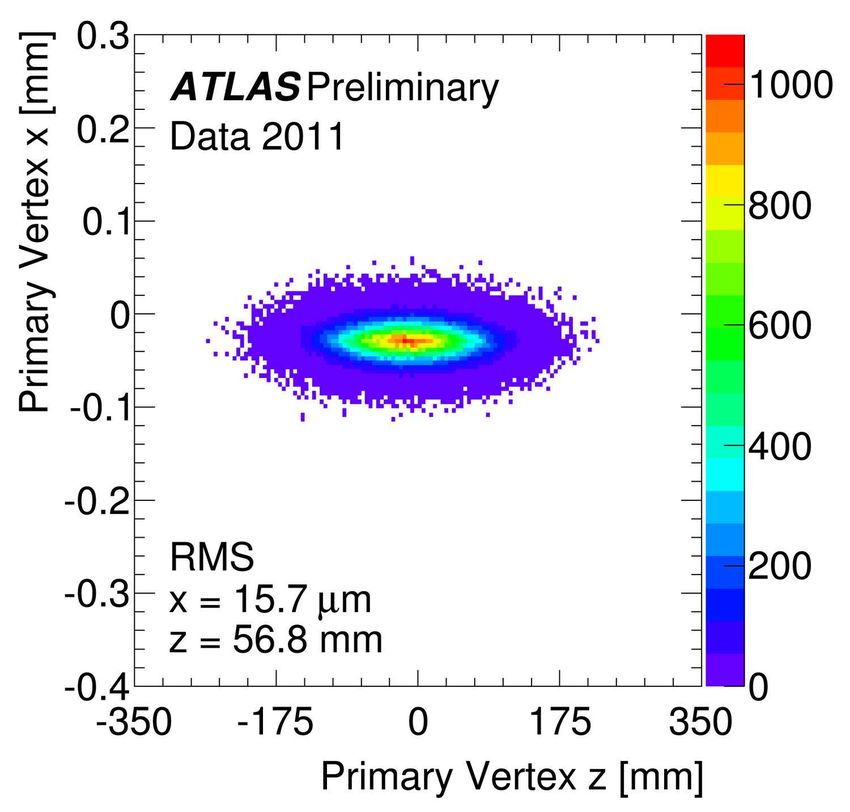
Charged track reconstruction                                                                 Andrea Favareto

                                                                                                                  PoS(IHEP-LHC-2011)002
Figure 5: Distribution of the reconstructed photon conversions for data events as a function of the transverse
positions (x, y) (left), and of the reconstructed hadronic interactions for data events in the local coordinate
system for the first pixel detector layer (right).

tiple scattering resolution term, etc.). The estimated uncertainty is better than ∼ 5% in the central
region and at the level of ∼ 10% in the end-caps.

6. Inner Detector Alignment

     The limited knowledge of the relative position of detector pieces should not lead to a significant
degradation of the track parameter beyond the intrinsic tracker resolution, nor introduce biases.
Thus the goal of the alignment is to provide an accurate description of the geometry of the detector:
the location and orientation of every tracking element. A very high accuracy is needed for precision
physics measurements, e.g. a 15 MeV precision in W mass requires a ∼ 1 µm alignment [2].
     The ID has been aligned using a track based method [8]. It consists in a χ 2 minimization of
the track-hit residuals. The alignment procedure has been executed at 3 different levels in accor-
dance with the assembly of the ID structures, i.e. with increasing number of aligned substructures
proceeding from large structures to module level with increasing granularity of structures and de-
grees of freedom. The level 1 corresponds to the large barrel and end-cap structures of the Pixel,
SCT and TRT (just 7 structures to align) . The level 2 deals with the barrel layers and end-cap
disks of the Pixel and SCT (31 structures) and the barrel modules and end-cap wheels of the TRT
(176 structures). Finally, the level 3 aligns each pixel and SCT modules (5,832) and TRT straw
tubes (350k). In total, one has to deal with more than 700k degrees of freedom. The alignment
is monitored on a run by run basis. There are two dedicated data streams selected by the high
level trigger: a collection of high pT and isolated collision tracks and cosmic-ray tracks triggered
during the empty LHC bunches [9]. With a run-by-run alignment one can test the detector stability
(Fig. 6 left). Large movements of the detector are due to changes in operational conditions (typ-
ical size < 10 µm) after hardware incidents. In between these periods little (< 1 µm) movement
is observed indicating that the detector is generally very stable. In order to derive the alignment

                                                      6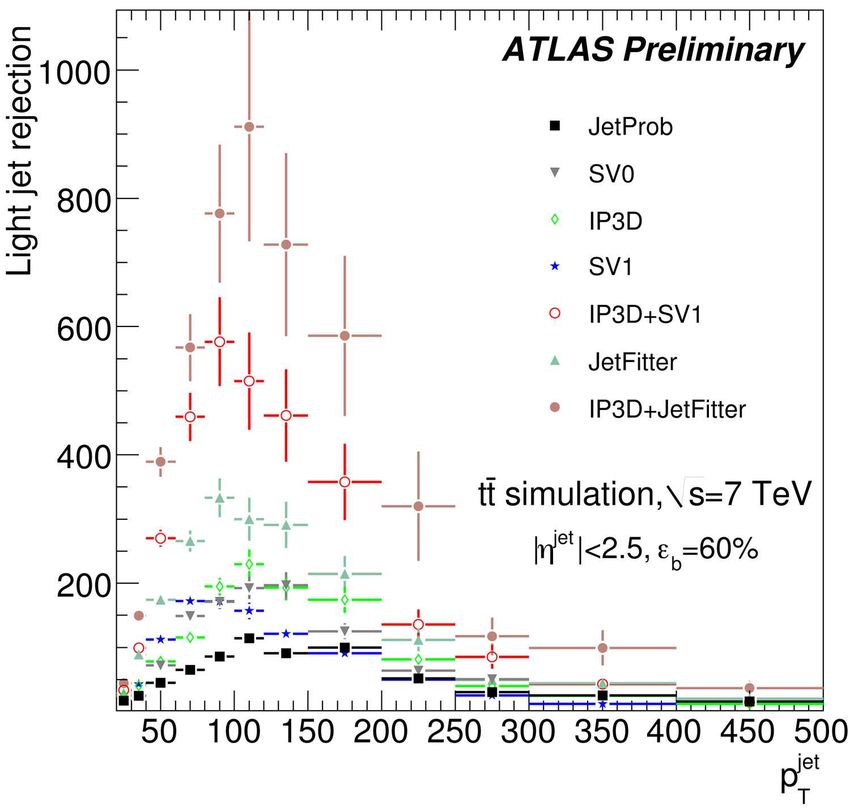
Charged track reconstruction                                                            Andrea Favareto

                                                                                                            PoS(IHEP-LHC-2011)002
Figure 6: Subsystem level, Level One, alignment corrections performed on a run by run basis starting from
a common set alignment constants (left), and mean Z invariant mass versus φ for negative muons (right).

constants over many data taking periods an offline alignment is run. The alignment software allows
to set constraints on the beam spot, assembly survey data [10], momentum of the muons from the
Muon Spectrometer and E/p from electrons.
     A very detailed alignment validation program is executed, which comprises a detailed check
of many alignment specific distributions (as the residuals of all components) and checks for track
parameters and their errors. The resonance invariant masses (light as Ks0 and heavy as Z) are
scrutinized against all the track parameters in order to detect and correct possible biases (Fig. 6
right).

7. b-tagging Performance

     The process of identifying jets originating from b-quark fragmentation (b-jets) is called b-
tagging. This has applications in many physics analyses, for example it greatly helps in the Stan-
dard Model measurements (e.g. σbb̄ , top physics, etc.), in the searches for the Higgs boson and for
physics beyond the Standard Model.
     The identification of b-jets exploits the high mass and relatively long lifetime of b-hadrons.
They can fly a few millimeters before decaying. Jets containing b-hadrons can therefore be tagged
either inclusively by measuring the impact parameters of the tracks (i.e. the distance of closest
approach of the track to the collision point) of the b-hadron decay products, or by explicitly recon-
structing a displaced vertices in jet. Furthermore the semi-leptonic decays of b-hadrons can also be
used by tagging the lepton in the jet.
     The first physics measurements published by the ATLAS Collaboration [11 – 13] used a set
of basic algorithm termed as “early data taggers", which were commissioned shortly after the be-
ginning of data taking [14]. More advanced taggers, with improved rejection capability have been
recently calibrated [19] and already heavily used in ATLAS physics measurements.

7.1 “early data taggers" and efficiency measurements
     For early 2010 data two simple b-tagging algorithms were commissioned: JetProb [15] and
SV0 [16]. JetProb is an impact parameter based tagger using both the transverse and longitudi-
nal impact parameters of tracks with respect to the primary vertex. It builds a variable giving a

                                                   7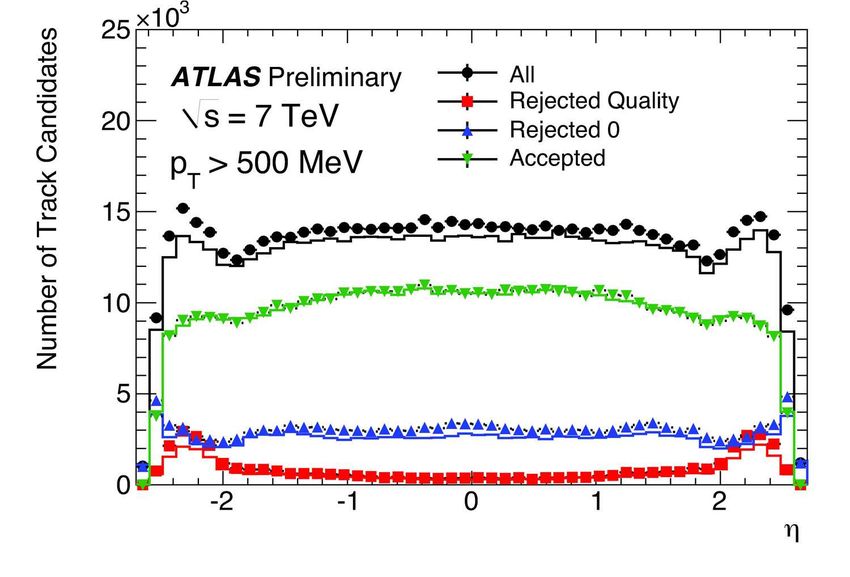
Charged track reconstruction                                                           Andrea Favareto

probability that all tracks in the jet originate from the primary vertex. The negative side of the
distribution of the displacement (signed impact parameter significance IP/σIP ) of tracks in a jet is
symmetrized to get a calibration function that is used to calibrate the mentioned probability. On
the other hand, in the SV0 tagger the secondary inclusive vertex formed by the decay products of
the b-hadron, including products of the eventual subsequent c-hadron decay, is reconstructed. The
signed decay length significance is used to discriminate b-jets against non-b-jets.
     In order for b-tagging to be used in physics analyses, the efficiency with which a jet originating
from a b-quark is tagged by a b-tagging algorithm needs to be measured, as well as the probability to
tag a jet originating from a light-flavour quark, referred to as the mistag rate. The two early taggers

                                                                                                          PoS(IHEP-LHC-2011)002
were calibrated using several methods in ATLAS: a 50% and a 70% b-tagging efficiency working
points for JetProb (JetProb50 and JetProb70) and a 50% b-tagging efficiency working point for
SV0 (SV050). The average mistag rate is approximatively 0.5% for the high purity working point
and 5% for the high efficiency working point [14].
     One way to measure the b-tagging efficiency is by using muon-jets. Though muons originate
also from other processes, a major source is the semi-leptonic decay of the b- or c-quarks resulting
from the b-quark decays. In the prel   T [14] measurement the momentum of a muon orthogonal to
the flight axis of the jet it is associated to is used to measure the b-jet content of a given sample.
Templates of prelT for b- , c- and light-flavor jets are fit to the data before and after b-tagging and
the efficiency is calculated as ε = Nb,tag /Nb .
     A similar measurement uses uncorrelated taggers to numerically calculate the b-tagging effi-
ciency from a set of 8 equations (System8) [17]. System8 is designed to minimize the dependence
on simulation and it is a very promising method that will be used in future b-tagging calibration
results [18].
     Another possibilty to calibrate the b-tagging efficiency is to select a physics process providing
a sample of b-jet with high purity. Two channels are used in ATLAS:

   • semi-leptonic decay chain b → D∗ µX → D0 (→ Kπ)π µX [14]. The mass reconstruction
     combined with the muon requirement yields a high b-jet purity and therefore gives direct
     access to the b-tagging efficiency.

   • events with a top quark and an anti-top quark [14]. The top quark almost exclusively decays
     into a W-boson and a b-quark. Different methods to measure the b-tagging efficiency in a t t¯-
     enriched sample have been developed and they all yield promising results that are becoming
     especially important as the integrated luminosity increases.

     All of the described techniques have been used to measure the b-tagging efficiency in data.
The results are all in good agreement with each other and the efficiency in data is very close to that
obtained in simulated events as shown in Fig. 7.

7.2 “advanced taggers"
     Advanced taggers use more pieces of information to tag b-jets than the early data taggers
[19]. The IP3D high-performance tagging algorithm uses a likelihood ratio technique in which
input variables are compared to pre-defined smoothed and normalized distributions for both the
b- and light-jet hypotheses, obtained from Monte Carlo simulation. The distributions in this case

                                                  8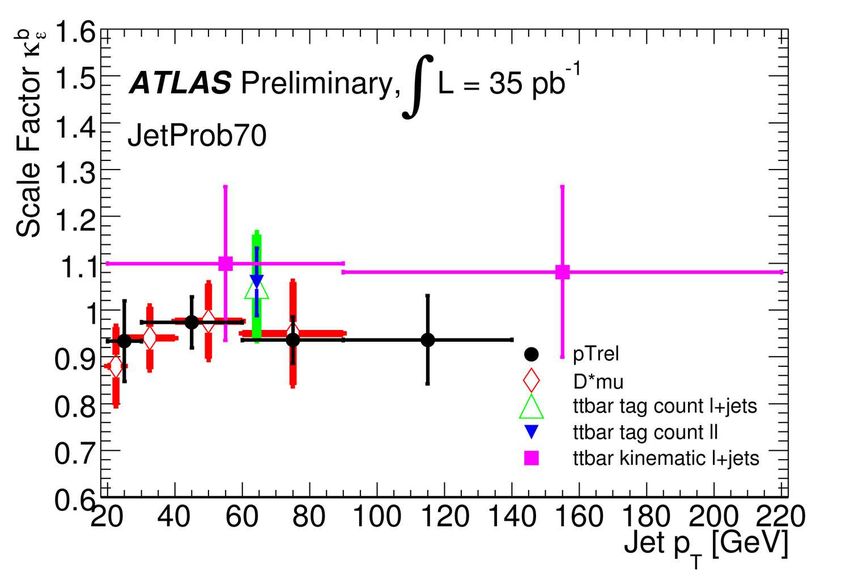
Charged track reconstruction                                                                 Andrea Favareto

                                                                                                                 PoS(IHEP-LHC-2011)002
                                                           data/sim                 ∗
Figure 7: The measured b-tagging efficiency scale factors kεb         for the prel           ¯
                                                                               T , D µ and t t methods for the
JetProb70 algorithm.

are two-dimensional density functions of the signed transverse impact parameter significance and
longitudinal impact parameter significance of tracks in jets, taking advantage of the correlations
between the two variables.
     To further increase the discrimination between b-jets and light jets, the inclusive vertex formed
by the decay products of the b-hadron, including the products of the eventual subsequent charm
hadron decay, can be sought (SV1 tagger). The decay length significance measured in three dimen-
sions and signed with respect to the jet direction is used as a discriminating variable between b-jets
and light jets, as well as three of the vertex properties: the invariant mass of all tracks associated to
the vertex, the ratio of the sum of the energies of the tracks in the vertex to the sum of the energies
of all tracks in the jet, and the number of two-track vertices. These variables are combined using a
likelihood ratio technique.
     Further discrimination can be achieved with another algorithm, called JetFitter, which exploits
the topological structure of weak b- and c-hadron decays inside the jet. A Kalman filter is used
to find a common line on which the primary vertex and the b- and c-vertices lie, as well as their
position on this line, giving an approximated flight path for the b-hadron. With this approach, the
b- and c-hadron vertices are not necessarily merged, even when only a single track is attached to
each of them. The discrimination between b-, c- and light jets is based on a neutral network using
similar variables as in the SV1 tagging algorithm above, and additional variables such as the flight
length significances of the vertices.
    Thanks to the likelihood ratio method used for IP3D and SV1, the algorithms can be easily
combined by adding their respective weights. The combination JetFitter+IP3D is based on artificial
neural network techniques with Monte Carlo simulated training samples and additional variables
describing the topology of the decay chain.

                                                   9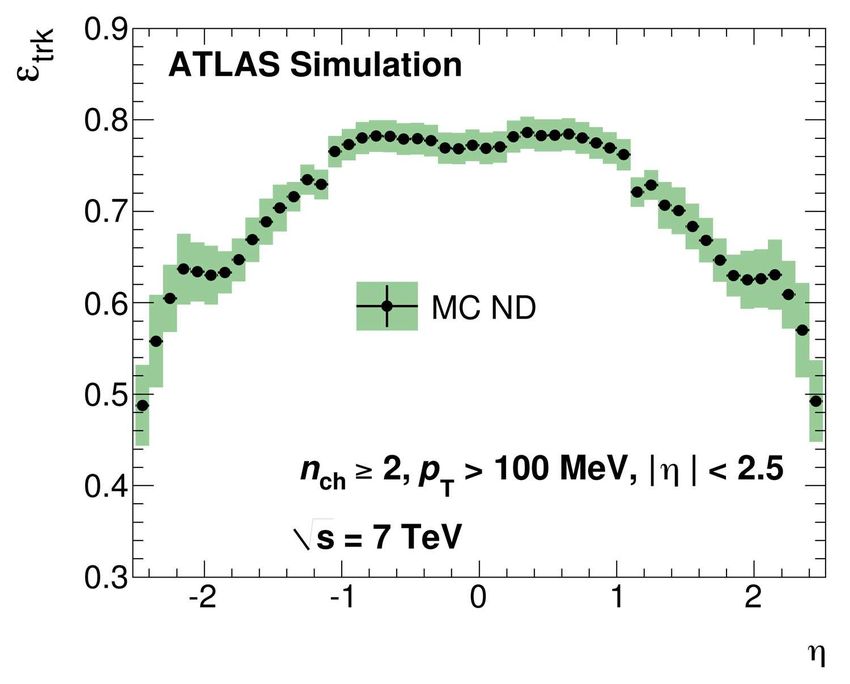
Charged track reconstruction                                                               Andrea Favareto

                                                                                                               PoS(IHEP-LHC-2011)002
Figure 8: Light-jet rejection as a function of the b-jet tagging efficiency for the early tagging algorithms
(JetProb and SV0) and for the high performance algorithms, based on simulated t t¯ events (left), and light-
jet rejection as a function of the jet transverse momentum pT , for operating points of the various tagging
algorithms leading to the same b-jet tagging efficiency of 60%, based on simulated t t¯ events (right).

     The advanced taggers greatly improve light-jet rejection at a fixed b-tagging efficiency as is
clearly visible in Fig.8. At same b-jet efficiency, the light jet rejection can be increased by a factor
of 2 to 5 with new taggers allowing better background rejection. On the other hand for same
light-jet rejection, the working point can be chosen at higher efficiency. This is very promising for
searches with low production cross section.

8. Conclusions

     The ATLAS Inner Detector tracking system performance has been discussed. The Pixels, SCT
and TRT are operating very efficiently and providing high quality data for the physics analysis
teams. The excellent performance of ATLAS track reconstruction and b-tagging satisfy the strin-
gent requirements on Inner Detector track reconstruction to cover ATLAS physics program. The
ID performance has reached its design level. Thanks to the very accurate vertex reconstruction the
material of the detector has been mapped with high accuracy, and the aligned stability has been
shown to be at the level of < 10 µm. 2010 heavy ion run as well gives good insights into tracking
at high occupancy.
     Several b-tagging algorithms have been developed and used in physics analyses. “Early tag-
gers" operate at 50% efficiency with a background mistag rate of 0.5%. High performance algo-
rithms, providing a factor 2 to 5 improvement in light-jet rejection, have been commissioned and
are already heavily used in ATLAS physics analyses.

References

 [1] L. Evans and P. Bryant, LHC Machine, J. Instrum. 3, S08001 (2009).

                                                    10
Charged track reconstruction Andrea Favareto
[2] ATLAS Collab., The ATLAS experiment at the CERN Large Hadron Collider,
J. Instrum. 3, S08003 (2009).
[3] ATLAS Collab., Performance of the ATLAS Silicon Pattern Recognition Algorithm in Data and
√
Simulation at s = 7 TeV, ATLAS-CONF-2010-072, CERN, Geneva, 2010.
[4] ATLAS Collab., Measurement of underlying event characteristics using charged particles in pp
√
collisions at s = 900 GeV and 7 TeV with the ATLAS detector, CERN-PH-EP-2010-063, CERN,
Geneva, 2010.
[5] ATLAS Collab., Measurement of the centrality dependence of J/ψ yields and observation of Z
production in lead-lead collisions with the ATLAS detector at the LHC, CERN-PH-EP-2011-146,
PoS(IHEP-LHC-2011)002
CERN, Geneva, 2011.
[6] ATLAS Collab., Performance of primary vertex reconstruction in proton-proton collisions at
√
s = 7 TeV in the ATLAS experiment, ATLAS-CONF-2010-069, CERN, Geneva, 2010.
[7] ATLAS Collab., Mapping the material in the ATLAS Inner Detector using secondary hadronic
interactions in 7 TeV collisions, ATLAS-CONF-2010-058, CERN, Geneva, 2010.
[8] ATLAS Collab., Alignment of the ATLAS Inner Detector Tracking System with 2010 LHC
√
proton-proton collisions at s = 7 TeV, ATLAS-CONF-2011-012, CERN, Geneva, 2011.
[9] ATLAS Collab., The ATLAS Inner Detector commissioning and calibration, CERN-PH-EP-2010-043,
CERN, Geneva, 2010.
[10] A. Andreazza, V. Kostyukhin and R. J. Madaras, Survey of the ATLAS Pixel Detector Components,
ATL-INDET-PUB-2008-012, CERN, Geneva, 2008.
[11] ATLAS Collab., Measurement of the cross section for the production of a W boson in association with
√
b-jets in pp collisions at s = 7 TeV with the ATLAS detector, CERN-PH-EP-2011-132, CERN,
Geneva, 2011.
[12] ATLAS Collab., Measurement of the top quark pair production cross section in pp collisions at
√
s = 7 TeV in dilepton final states with ATLAS, CERN-PH-EP-2011-103, CERN, Geneva, 2011.
[13] ATLAS Collab., Measurement of the inclusive and dijet cross-sections of b-jets in pp collisions at
√
s = 7 TeV with the ATLAS detector, CERN-PH-EP-2010-090, CERN, Geneva, 2010.
[14] ATLAS Collab., Calibrating the b-Tag Efficiency and Mistag Rate in 35 pb−1 of Data with the ATLAS
Detector, ATLAS-CONF-2011-089, CERN, Geneva, 2011.
√
[15] ATLAS Collab., Impact parameter-based b-tagging algorithms in the s = 7 TeV collision data with
the ATLAS detector: the TrackCounting and JetProb algorithms, ATLAS-CONF-2010-041, CERN,
Geneva, 2010.
√
[16] ATLAS Collab., Performance of the ATLAS Secondary Vertex b-tagging Algorithm in s = 7 TeV
Collision Data, ATLAS-CONF-2010-042, CERN, Geneva, 2010.
[17] ATLAS Collab., Expected Performance of the ATLAS Experiment Detector, Trigger and Physics,
CERN-OPEN-2008-020, CERN, Geneva, 2008.
[18] ATLAS Collab., b-Jet Tagging Efficiency Calibration using the System8 Method,
ATLAS-CONF-2011-143, CERN, Geneva, 2011.
[19] ATLAS Collab., Commissioning of the ATLAS high-performance b-tagging algorithms in the 7 TeV
collision data, ATLAS-CONF-2011-102, CERN, Geneva, 2011.
11You can also read