Citations and gender diversity in reciprocal acknowledgement networks
←
→
Page content transcription
If your browser does not render page correctly, please read the page content below
Citations and gender diversity in reciprocal
                                                             acknowledgement networks
                                                                           Keigo Kusumegi, Yukie Sano

                                                                                      Abstract
arXiv:2104.01729v1 [physics.soc-ph] 5 Apr 2021

                                                          Acknowledgements in scientific articles suggest not only gratitude, but
                                                      also the interactions among scientists. In this study, we examine the
                                                      acknowledgement interactions employing data from open-access journals
                                                      (PLOS series). We built an acknowledgement network where the nodes
                                                      represent authors and acknowledged people, while the links correspond
                                                      to being mentioned in acknowledgements. Employing motif analysis, we
                                                      showed how acknowledgement networks have developed, and how recip-
                                                      rocal relationships tend to emerge. To better understand these reciprocal
                                                      relationships, we analysed the reciprocal sub-graphs of acknowledgement
                                                      from two perspectives: citations and gender diversity. Firstly, we counted
                                                      the number of citations, from both reciprocal and non-reciprocal authors.
                                                      We found that reciprocal authors predominantly tend to cite other recip-
                                                      rocal authors rather than non-reciprocal ones. For gender diversity, we
                                                      found that reciprocal pairs that include females tend to emerge more than
                                                      male-male pairs of reciprocity in various fields, despite the fewer number
                                                      of females.

                                                 1    Introduction
                                                 Science has developed through networks. This networks are often represented
                                                 by the connections among scientists and papers, such as collaborations and ci-
                                                 tations. As a result, there are well-organized databases of this information, and
                                                 numerous studies have analysed them. For example, collaboration networks,
                                                 where nodes represent scientists, and two scientists are connected if they have
                                                 collaborated, showed similar properties even when scientists come from differ-
                                                 ent fields. The link distribution showed a fat-tailed distribution, where a few
                                                 scientists have many collaborators, while most scientists have only a few collab-
                                                 orators [1].
                                                     In citation networks, where nodes represent papers or authors, and two nodes
                                                 are connected if one has cited another; it is known that a community structure is
                                                 created [2], and highly cited authors tend not to collaborate but rather cite each
                                                 other [3]. Furthermore, journal citation networks were also examined, where
                                                 nodes represent journals. These networks have high reciprocity and positive
                                                 assortativity, which means that the nodes tend to connect to other nodes that
                                                 have a similar degree [4].
                                                     Because the network of science is widely revealed from citation and col-
                                                 laboration relationships, it is still not enough to describe the development of
                                                 science. For example, in the 1970s, one prominent paper on computer simula-
                                                 tion in physics was published by three authors: Fermi, Pasta, and Ulam [5]. As
                                                 it turned out later, one more scientist named Tsingou, who actually wrote the
                                                 computer simulation code, has not been recognized as importance contributor
                                                 of the work [6]. Because the report states the following: “Report written by

                                                                                          1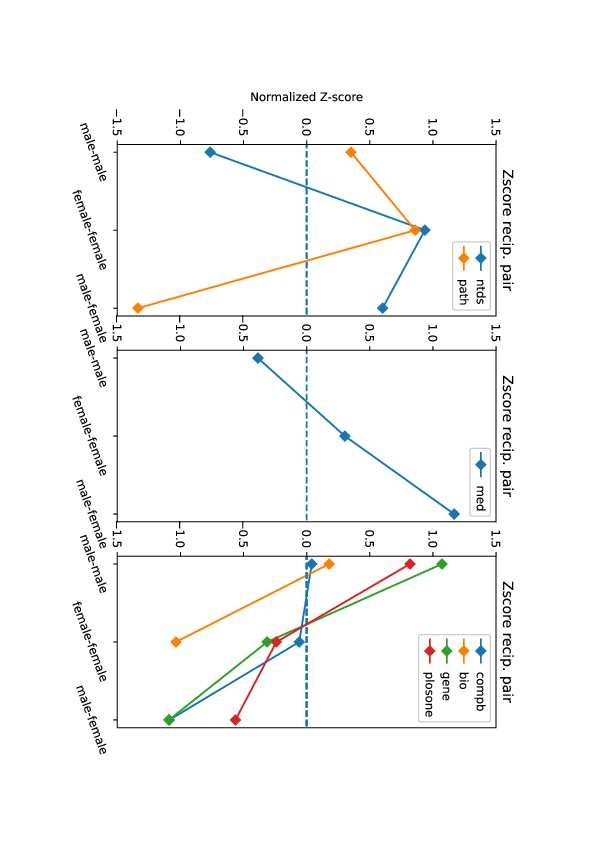
Fermi, Pasta, and Ulam. Work done by Fermi, Pasta, Ulam, and Tsingou.” Her
name appeared on the acknowledgement statement as: “We thank Miss Mary
Tsingou for efficient coding of the problems and for runing the computations on
the Los Alamos MANIAC machine.” [5]
    Additionally, it is common for a scientist to receive useful comments from
other colleges and/or share biological facilities to promote their experiments.
These academic activities are not listed as co-authors in published papers;
they often appear in acknowledgement statements. Therefore, acknowledge-
ment statements in published papers may suggest important contributors in the
academic world.
    Because acknowledgements in scientific papers are appreciation from authors
to some entity, such as thanks for helpful advice or financial help, they could
be interpreted in several meanings, for examples, “scientific debt” [7] or “sub-
authorship collaboration” [8]. In acknowledgements, the contribution types vary
across the scientific fields, that is, sharing biological materials for biology and
discussions for mathematics [9]. The distribution of acknowledged entities such
as persons and institutions follows a power-law across various fields [10]. It was
also said that acknowledgement has gradually become a constitutive element
of academic writing, and so has the increase of collaboration in research [11].
These studies were organised by extracting the necessary information from the
acknowledgements without a network perspective. Acknowledgement network
analysis has been performed mainly for funding interests [12, 13, 14]. For in-
stance, the Web of Science, one of the world’s largest online academic databases
provided by Clarivate Analytics, started collecting funding data described in the
acknowledgement section for its publications, making it easier to track funding
flow.
    However, little is known about acknowledgement networks at the level of
human entities, and this is partly because of the difficulty of collecting data.
Acknowledgements are not described in every published paper and do not have
a defined format. Some works succeed in collecting acknowledged persons with
high accuracy using machine learning techniques, such as SVM and regular
expression process [15]. In this work, we employed data-driven analysis on
acknowledgement networks to answer two main research questions: (1) how is
the topology of research acknowledgement networks, and (2) what role play
reciprocal relationships in acknowledgements from the point of view of citations
and gender.
    Understanding acknowledgement networks based on human interactions may
provide new perspective of relationships in academia that can be captured in
neither citation nor collaboration networks. To dig deeper into acknowledge-
ment networks, we need first to understand their topological structure. Re-
garding the relationship between acknowledgements and citations, we focused
on the significance of reciprocity in the context of acknowledgements, because
reciprocity in human interaction has great importance in human behaviour and
in social influence [16, 17]. Furthermore, reciprocity is said to play a key role in
innovation [18]; therefore, we examined the reciprocal relationships in acknowl-
edgements from the viewpoint of gender diversity.
    We first show basic information about acknowledgement networks. Next,
we show the result of reciprocal acknowledgement and citation count relation-
ships by simply comparing the statistical significance of citation counts between
reciprocal authors and non-reciprocal authors. Moreover, we explored recipro-

                                         2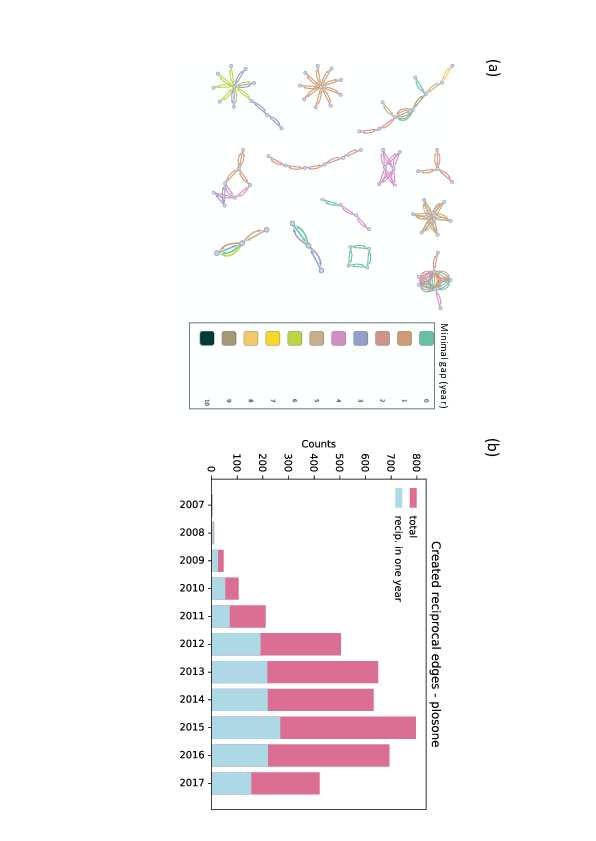
cal acknowledgement networks from the perspective of the citation and gender
diversity. Details regarding the methods and data are presented in the last
section.

2     Result
2.1    Overview of acknowledgement networks
In this work, we collected the description of acknowledgement statements from
one of the biggest open access journals, the PLOS series (https://plos.org/).
We collected 214,645 papers published between 2006 and 2017 from seven major
fields: biology, computational biology, genetics, medicine, NTDs (Neglected
Tropical Diseases), pathogens, and PLOS ONE (interdisciplinary, main cate-
gory). Each paper contains author names, published year and names mentioned
in acknowledgement statement if they exit. Using these data, we created ac-
knowledgement networks in each field where the nodes represent authors and
people mentioned in acknowledgements, and the direct links connect authors to
people mentioned in acknowledgements (see Methods for details). Both, the in-
and out-degree distributions, follow a lognormal function, where the logarithm
of link x is distributed normally as follows:

                                              (ln x − µ)2

                                  1
                       f (x) = √       exp −                                (1)
                                 2πσx             2σ 2

where µ and σ are the mean and the standard deviation of the normal distribu-
tion, which have different values depending on the field (Figure 1). The highest
µ is 6.68 in medicine, while the lowest is 1.83 in computational biology. This
lognormal distribution suggests that most of the authors mention a small num-
ber of people in their acknowledgements, while a few of them mention a huge
number.
    We also calculated the global clustering coefficient C, where triangle is a set
of three nodes, each of whom is connected to the other two nodes. C = 1 for a
fully connected graph, and C = 0 for a random graph without triangles. The C
for all datasets was small (C < 0.02) (Table 1).

2.2    Motif analysis
To clarify local connectivity in the acknowledgement network, we employed 3-
node motif analysis over the largest connected component of each network. Mo-
tif analysis enables us to understand the pattern of connected nodes in networks
from a microscale. In this analysis, all three connected nodes are assigned to one
of the thirteen types of subgraphs, and those counts were normalised z-scores
to be comparable with the others.
     Some networks show similar frequent patterns from the z-score (Figure 2(a)).
Motifs 3 and 7 tend to appear in all fields except for medicine. This coincides
with the low clustering coefficient, because triangle patterns do not appear fre-
quently. In addition, z-scores of most motifs, including reciprocity (e.g., motif
7 and 9) were positive over all datasets. This suggests that reciprocity tends
to be created in the acknowledgement network. Therefore, we supposed that

                                        3
reciprocity in the acknowledgement network might imply some strong and spe-
cial ties between the two authors. For instance, reciprocity might be a sign of
joining collaboration in the future.
2.3 Reciprocal relationships
Reciprocity has been investigated in social and economic sciences [19, 20] and it
is also important for collaboration. According to the citation relationship, the
number of reciprocities is increasing, and reciprocal citations negatively corre-
late with a long-term successful academic career [21]. Considering those works
related to reciprocity, we show the characteristics of reciprocity in acknowledge-
ment networks. Figure 3(a) illustrates parts of reciprocal subgraphs, where the
link colour implies the gap time. The gap time is the minimum difference of
the mentioned year of any two reciprocal acknowledgements. For example, the
green colour in Fig. 3(a) means that the gap time is 0, that is, the reciprocal
acknowledgements correspond to the same year. Figure 3(a) also shows that it
takes a few years to complete reciprocal links.
In Fig. 3(b), purple bars show the total number of reciprocities and the sky-
blue bars indicate the number of reciprocities in which both acknowledgements
had been written in the same year. There is an increasing number of reciprocities
after 2009, and a certain portion of these is completed within the same year. The
average gap time between reciprocities is 1.48 years; they seem to be completed
in a relatively short term.
2.4 Reciprocity and citation counts
Citation count is often used as an index of the scientist’s profile. To examine
the impact of reciprocal acknowledgement relationships on citation, we sepa-
rated nodes in an acknowledgement network into reciprocal and non-reciprocal
nodes. The reciprocal nodes contain only pairs of authors who have a reciprocal
relationship, such as illustrated by subgraphs in Fig. 3(a), and non-reciprocal
nodes contain the rest of the subgraphs.
Citation data was collected from Microsoft Academic Search API [22, 23],
which allows us to collect data from Microsoft Academic Graph (MAG). The
data includes the author’s name, the citation count, the paper ID and referenced
papers. Because the average number of citations varies by research field, we
averaged other scientists’ citations in the same research field as a baseline (red
dots in Fig. 4). The number of extracted citation data is depicted in the Methods
section.
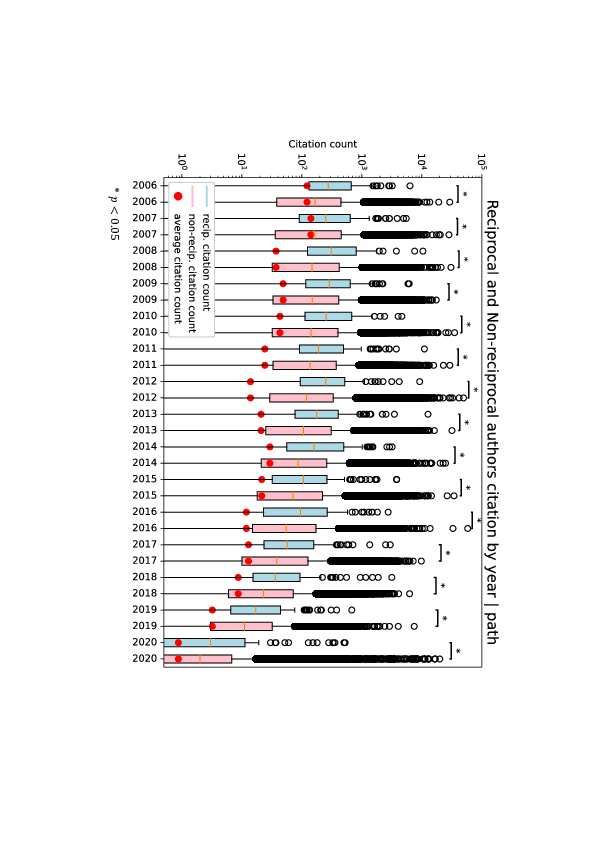
Figure 4 shows the authors’ annual citation counts in pathogens grouped
by reciprocity and non-reciprocity authors (the results of the other fields are
shown in the Appendix). Using the Mann-Whitney U test, we found that recip-
rocal authors are statistically cited more than non-reciprocal authors in most
of the given years. pathogens, computational biology, NTDs, and PLOS ONE
showed similar results. Regarding this analysis, we excluded medicine and
genetics because the amount of citation data was too small for an adequate
Mann-Whitney U test. Although the average citation of reciprocal and non-
reciprocal authors from our dataset was slightly higher than the baseline from
the MAG dataset, the difference between reciprocal and non-reciprocal authors
was still present.
42.5 Reciprocal authors citing from other reciprocal au-
thors
As we showed in the previous section, reciprocal authors tend to be cited more
frequently than non-reciprocal authors. To reveal the mechanism, we posited
that reciprocal authors might cite the paper of other reciprocal authors, that
is, there might be a direct overlap between the acknowledgement network and
the citation network. To answer this question, we compared the number of re-
ciprocal authors cited from other reciprocal authors and those of non-reciprocal
authors cited from reciprocal authors.
We tested whether there was a significant difference in the number of recip-
rocal authors’ papers in the list of referenced articles between those two groups
using the Mann-Whitney U test. As a result, we found that reciprocal authors
statistically cite the other reciprocal authors more than non-reciprocal authors
(Table 2). The average number of reciprocal authors’ papers cited by other re-
ciprocal authors is more than twice the number of those cited by non-reciprocal
authors.
Meanwhile, the percentage of citation counts between two authors who are
under the same reciprocal acknowledgement relationship is low, from 0.43%
to 13.27% of total citations within reciprocal groups. Thus, acknowledgement
reciprocity relationships do not directly correspond with citation relationships.
This suggests that reciprocal authors belong a large community where scientists
are citing and mentioning acknowledgement each other.
2.6 Reciprocity and gender diversity
Gender diversity is said to be one of the key elements for success [24]. In
addition to the citation relationship, we examined gender diversity in reciprocal
pairs. We assumed that gender-related topology would reflect the reciprocal
group’s citation, like author ships and citations [25, 26, 27]. To identify the
author’s gender, we applied the Gender API (https://gender-api.com/), which
is a gender-telling service using over three million validated names from 191
countries. This database detects accurately whether a name belongs to a male
or a female. In our data, 9 in 10 reciprocal authors’ gender are detected with
more than 80% accuracy over all datasets. In addition, 500 non-reciprocal
authors’ gender in each field dataset are used as a comparison with reciprocal
authors.
Because the majority of the nodes in the network correspond to male scien-
tists, 53% in medicine and 75% in computational biology, we computed nor-
malised z-scores of three different pairs of reciprocity: male–male, female–female,
and male–female. Figure 5 shows the normalised z-scores of reciprocal pairs.
First, male–male pairs are highly likely to appear in more than half of the re-
search fields such as PLOS ONE. However, male–female or female–female are more
likely to show in three research fields despite the smaller number of females. For
example, the male-male pair is less likely to happen in NTDs and medicine. This
suggests that a pair of gender in reciprocity is heterogeneous, and it depends
on the research fields.
53 Discussion
Acknowledgement statements in published papers have various roles, such as
representing gratitude or strategically avoiding potential referees. Here we ex-
plored networks in academia from the perspective of acknowledgements. Here,
we built a network by representing authors or people mentioned in acknowledge-
ment as nodes, and the links correspond to being mentioned in acknowledge-
ments. Basic network structures such as degree distributions, clustering coeffi-
cients and motifs reveal topological information of acknowledgement networks
from microscale to macroscale. This reveals that the topology of acknowledge-
ment networks differs in each research field. From motif analysis, reciprocal
relationships tend to emerge in acknowledgement networks.
To uncover the creating mechanism of reciprocal relationships in acknowl-
edgement, we explored the citation relationships and gender diversity. In the
citation relationship, we showed that reciprocal authors tend to cite other recip-
rocal authors more frequently than non-reciprocal authors. Although reciprocal
authors have more strained citation relationships among them, non-reciprocal
authors also cite the papers of reciprocal authors to some extent. This fact
could explain why reciprocal authors might be well-known authors in their re-
search field, and consequently, they made strong citation and acknowledgement
relationships with same level authors.
From the angle of gender diversity, since the male–male pair is dominant in
most research fields, including PLOS ONE, the female–female pair emerged more
in the fields of biology, pathogens, and NTDs, although the number of females is
less than the number of males in our dataset. It should be noted that we showed
just divergence of a pair of reciprocal pairs, and it could not directly explain
the effect of the citation number of reciprocal authors. We anticipate that the
gender diversity and acknowledgement networks perspectives will contribute to
the science of success in the future.
There remains the bias of datasets that are only based on PLOS series as
a limitation. Because of the data collection difficulty, it takes time to collect
an amount of acknowledgement data, we collected only fully named entities
to avoid the confusion. This makes acknowledgement network analysis hard
to capture the entire scientist’s world as much as citation and collaboration
network analysis do. When a database of acknowledgments might be developed
in the future, acknowledgment networks would be analysed more precisely. Also,
building a multilayer network [28] where each layer represents collaboration,
citation and acknowledgement network is an interesting direction for further
exploration.
4 Methods
4.1 Acknowledgement data
We collected text data from PLOS (https://plos.org/), which has published
214,645 papers from 2006 to 2017. PLOS was officially launched in 2006 and had
become, by 2010, the biggest open-access journal. Because PLOS publishes mul-
tidisciplinary subjects, it covers a variety of fields, from medicine to the human-
ities. We collected 214,645 papers from seven research fields: computational
6biology, biology, medicine, genetics, pathogens, NTDs and PLOS ONE (Ta-
ble 1).
From the collected data, we extracted basic information: author’s name and
year of the publication. We also extracted the acknowledgement statements
as raw texts. We then employed Stanford CoreNLP (https://corenlp.run/) to
phrase and identify the mentioned authors in the acknowledgement texts. In
the present study, only fully named entities were used as available mentioned
names in order to avoid confusion among people with the same initial expres-
sions. Note that we removed the names of “Albert Einstein” and “Mary Curie”,
which appeared as institution’s name. Among the 214,645 papers collected, 71%
contained acknowledgements and 338,027 names were mentioned in it. In PLOS
ONE, 130,774 papers had acknowledgement statements and 277,545 names were
mentioned in the acknowledgements. In medicine, 52% of papers include ac-
knowledgements, while in genetics and pathogens over 80% of papers contain
acknowledgements. The average number of names mentioned per paper is be-
tween two and three in biology, genetics, NTDs, pathogens, and PLOS ONE. In
computational biology, on average less than two scientists were mentioned,
while an average of 3.5 scientists were mentioned in medicine. The average num-
ber of co-authors per paper varies widely from 4.3 in computational biology
to 9.2 in genetics (Table 1).
4.2 Acknowledgement network
The acknowledgement network is defined as a weighted directed graph G[V, E, W ],
where V denotes a set of nodes, E ⊆ {(s, t)|s, t ∈ V and s 6= t}, denotes a set of
links and W denotes the weight of the links, which depends on the number of
co-authors. The nodes represent names who wrote acknowledgements or were
mentioned in acknowledgements. The directed links from s to t indicate pairs
of nodes (s, t), where node s acknowledges node t. In a paper written by n au-
thors, we assumed that the acknowledgement came for all authors and assigned
a weight of 1/n for each author.
4.3 Motif analysis
Statistical significance of a motif M is defined by the z-score ZM :
rand
NM − hNM i
ZM = rand
, (2)
σM
rand
where NM is the number of motif M in the given network, and hNM i and
rand
σM are the mean and standard deviation of M ’s occurrence in the set of ran-
dom networks, respectively. Random networks correspond to the configuration
model in which the pairs of links are stochastically exchanged, while the number
of nodes and links are maintained. Then, ZM is normalised as follows:
norm ZM
ZM = p 2 (3)
ΣZM
4.4 Reciprocal and non-reciprocal authors
The acknowledgement network was divided into two subgraphs: reciprocal and
non-reciprocal. The reciprocal subgraph was composed of the nodes that are
7connected by reciprocal acknowledgements, while the non-reciprocal subgraph
contains all the other nodes. Then, we extracted nodes (authors) whose citation
data were available from any of the subgraphs.
4.5 Reciprocity - Citation
Citation data were extracted from Microsoft Academic Graph (MAG) using Mi-
crosoft Academic Search API querying the author’s names. The data contained
authors’ IDs, papers’ IDs, the list of referenced paper IDs and citation counts
for each paper. We collected all available 504,796 authors’ citation informa-
tion. Figure 6 shows the number of available citation data by reciprocity and
research field. Regarding citation-related analysis, the datasets of medicine
and genetics were excluded because the data of reciprocity were not sufficient
to perform a Mann-Whitney U test. We computed two types of citations: cita-
tions where a reciprocal author cites the paper of another reciprocal author and
citations where a non-reciprocal author cites the paper of a reciprocal author.
Next, we compared the differences in citation counts between these two types of
citations using the Mann-Whitney U test. Moreover, we calculated the number
of citations between reciprocal authors.
4.6 Reciprocity - Gender
To verify which pair of gender on reciprocity appears frequently, we computed
the statistical significance z-score as we did in motif analysis. Here, M is a
rand rand
set of male–male, female–female, and male–female. hNM iand σM are the
mean and standard deviation of M ’s occurrence in the set of random networks,
respectively. In random networks, the node is assigned to male or female with
the probability of the fraction of the number of males or females in the network.
References
[1] Newman, M.E.: Coauthorship networks and patterns of scientific collab-
oration. Proceedings of the National Academy of Sciences 101(suppl 1),
5200–5205 (2004)
[2] Chen, P., Redner, S.: Community structure of the physical review citation
network. Journal of Informetrics 4(3), 278–290 (2010)
[3] Ding, Y.: Scientific collaboration and endorsement: Network analysis of
coauthorship and citation networks. Journal of informetrics 5(1), 187–203
(2011)
[4] Franceschet, M.: The large-scale structure of journal citation networks.
Journal of the American Society for Information Science and Technology
63(4), 837–842 (2012)
[5] Fermi, E., Pasta, P., Ulam, S.: Studies of the nonlinear problems. Technical
report, Los Alamos Scientific Laboratory (1955)
[6] Dauxois, T.: Fermi, pasta, ulam and a mysterious lady. Physics Today
61(1), 55–57 (2008)
8[7] Edge, D.: Quantitative measures of communication in science: A critical
review. History of Science 17(2), 102–134 (1979)
[8] Cronin, B., Shaw, D., La Barre, K.: A cast of thousands: Coauthorship
and subauthorship collaboration in the 20th century as manifested in the
scholarly journal literature of psychology and philosophy. Journal of the
American Society for information Science and Technology 54(9), 855–871
(2003)
[9] Paul-Hus, A., Dı́az-Faes, A.A., Sainte-Marie, M., Desrochers, N., Costas,
R., Larivière, V.: Beyond funding: Acknowledgement patterns in biomed-
ical, natural and social sciences. PLoS ONE 12(10), 0185578 (2017)
[10] Giles, C.L., Councill, I.G.: Who gets acknowledged: Measuring scientific
contributions through automatic acknowledgment indexing. Proceedings of
the National Academy of Sciences 101(51), 17599–17604 (2004)
[11] Cronin, B., Shaw, D., Barre, K.L.: Visible, less visible, and invisible work:
Patterns of collaboration in 20th century chemistry. Journal of the Ameri-
can Society for information Science and Technology 55(2), 160–168 (2004)
[12] Wang, J., Shapira, P.: Funding acknowledgement analysis: an enhanced
tool to investigate research sponsorship impacts: the case of nanotechnol-
ogy. Scientometrics 87(3), 563–586 (2011)
[13] Mejia, C., Kajikawa, Y.: Using acknowledgement data to characterize fund-
ing organizations by the types of research sponsored: The case of robotics
research. Scientometrics 114(3), 883–904 (2018)
[14] Paul-Hus, A., Desrochers, N., Costas, R.: Characterization, description,
and considerations for the use of funding acknowledgement data in web of
science. Scientometrics 108(1), 167–182 (2016)
[15] Councill, I.G., Giles, C.L., Han, H., Manavoglu, E.: Automatic acknowl-
edgement indexing: expanding the semantics of contribution in the cite-
seer digital library. In: Proceedings of the 3rd International Conference on
Knowledge Capture, pp. 19–26 (2005)
[16] Mahmoodi, A., Bahrami, B., Mehring, C.: Reciprocity of social influence.
Nature communications 9(1), 1–9 (2018)
[17] Molm, L.D., Schaefer, D.R., Collett, J.L.: The value of reciprocity. Social
Psychology Quarterly 70(2), 199–217 (2007)
[18] Linton, J.D.: The role of relationships and reciprocity in the implementa-
tion of process innovation. Engineering Management Journal 12(3), 34–38
(2000)
[19] Lewis, S.C.: Reciprocity as a key concept for social media and society.
Social Media+ Society 1(1), 2056305115580339 (2015)
[20] Thomson, A.M., Perry, J.L.: Collaboration processes: Inside the black box.
Public administration review 66, 20–32 (2006)
9[21] Li, W., Aste, T., Caccioli, F., Livan, G.: Reciprocity and impact in aca-
demic careers. EPJ Data Science 8(1), 20 (2019)
[22] Tang, J., Zhang, J., Yao, L., Li, J.: Extraction and mining of an academic
social network. In: Proceedings of the 17th International Conference on
World Wide Web, pp. 1193–1194 (2008)
[23] Sinha, A., Shen, Z., Song, Y., Ma, H., Eide, D., Hsu, B.-J., Wang, K.: An
overview of microsoft academic service (mas) and applications. In: Pro-
ceedings of the 24th International Conference on World Wide Web, pp.
243–246 (2015)
[24] Nielsen, M.W., Alegria, S., Börjeson, L., Etzkowitz, H., Falk-Krzesinski,
H.J., Joshi, A., Leahey, E., Smith-Doerr, L., Woolley, A.W., Schiebinger,
L.: Opinion: Gender diversity leads to better science. Proceedings of the
National Academy of Sciences 114(8), 1740–1742 (2017)
[25] West, J.D., Jacquet, J., King, M.M., Correll, S.J., Bergstrom, C.T.: The
role of gender in scholarly authorship. PLoS ONE 8(7), 66212 (2013)
[26] Maliniak, D., Powers, R., Walter, B.F.: The gender citation gap in inter-
national relations. International Organization 67(4), 889–922 (2013)
[27] Dworkin, J.D., Linn, K.A., Teich, E.G., Zurn, P., Shinohara, R.T., Bassett,
D.S.: The extent and drivers of gender imbalance in neuroscience reference
lists. Nature Neuroscience 23(8), 918–926 (2020)
[28] Kivelä, M., Arenas, A., Barthelemy, M., Gleeson, J.P., Moreno, Y., Porter,
M.A.: Multilayer networks. Journal of complex networks 2(3), 203–271
(2014)
10Figures
Figure 1: Cumulative in- and out- degree distribution of acknowledgements
networks. The distribution follows a lognormal distribution where µ = 4.1 ×
10−8 , σ = 1.1228 and xmin (x > 0) : 11.0 for PLOS ONE (in-degree).
11Figure 2: Motifs in acknowledgement networks. (a) Normalised Z-score over 13
motifs. (b) The most frequently appeared motifs in each field.
12Figure 3: Time difference to complete reciprocal links. (a) An example of
reciprocal subgraphs of acknowledgement network. Link colour represents the
minimal gap year of reciprocal acknowledgements within a reciprocal pair. (b)
The number of created links by year. The red bar shows the total number of
reciprocities in a year, while sky-blue shows the number of reciprocities in which
both of them are sent in the same year.
13Figure 4: Citation counts of reciprocal and non-reciprocal authors by year in
pathogen. Sky-blue shows the citation of reciprocal authors and pink shows
that of non-reciprocal authors. Red dot shows the average number of citations
counts in these fields.
14Figure 5: Normalised Z-score of 3 types of pairs, which is male-male, female-
female and male-female. By the pattern of the highest Z-scores, the seven fields
are divided into three groups.
15Figure 6: Extracted citation data from Microsoft Academic Search API. Sky-
blue bars show the number of papers authors by reciprocal authors and pink
bars show by non-reciprocal authors.
16Tables
medicine biology comp.bio. NTDs pathogens genetics PLOS ONE
Number of papers 3301 4372 5120 5256 6030 6638 183928
The average number of co-authors 6.5 5.5 4.3 8.1 7.8 9.2 6.8
Proportion of paper
contain acknowledgement 0.523 0.672 0.7 0.756 0.824 0.865 0.711
Table 1: Basic properties of acknowledgement network.
Average number of acknowledged
persons per paper 3.54 3.03 1.82 2.35 2.55 2.95 2.12
Average in-degree 6.69 2.37 1.84 1.98 1.93 3.06 2.26
Average gap time
for creating reciprocity [Years] 0.91 3.51 2 0.98 1.92 2.54 1.49
Average clustering coefficient C 0.005 0.003 0.012 0.012 0.008 0.008 0.013
17medicine biology comp.bio. NTDs pathogens genetics PLOS ONE
Number of citations
Table 2: Comparison of reciprocal and non-reciprocal authors’ citations.
by reciprocal authors 4 31 70 121 133 19 4127
Number of citations
by non-reciprocal authors 28201 15006 9229 12526 21265 8894 405170
Average number of reciprocal author’s
citation of other reciprocal authors 1 21.3 16.2 38.2 28.5 77.7 53.4
Average number of non-reciprocal author’s
citation of reciprocal authors 11.7 4.8 7.6 18.5 13.4 48.3 31.4
Ratio of citation between
a pair of reciprocity against
the number of citations
within reciprocal authors 0.0043 0.0748 0.0599 0.1275 0.1327 0.1218 0.0637
18You can also read