Analysis of Crossing Opportunities at the 2018 FIFA World Cup
←
→
Page content transcription
If your browser does not render page correctly, please read the page content below
ORIGINAL SCIENTIFIC PAPER

Analysis of Crossing Opportunities at the 2018
FIFA World Cup
Michalis Mitrotasios1, Alliance Kubayi2, Vasilis Armatas1, Paul Larkin3
Affiliations: 1National & Kapodistrian University of Athens, School of Physical Education & Sport Science, Athens, Greece, 2Tshwane University
of Technology, Department of Sport, Rehabilitation & Dental Sciences; Pretoria, South Africa, 3 Victoria University, Institute for Health and Sport,
Melbourne, Australia

Correspondence: V. Armatas, National & Kapodistrian University of Athens, School of Physical Education & Sport Science, Ethnikis Antistasis 41,
17237, Dafni – Athens, Greece. Email: v-armatas@phed.uoa.gr

  Abstract
  The purpose of this study was to investigate open-play crosses at the 2018 FIFA World Cup tournament, with spe-
  cific reference to the mechanism and match status of the crosses. Descriptive statistics (i.e., frequency counts and
  percentages) and chi-square tests of association were used to analyse the data. The study observed a total of 949
  crosses, resulting in 20 goals scored (2.1%). Descriptive statistics highlighted that offensive teams had more goal-scor-
  ing attempts when they used counter-attacks (18.6%) compared to organized (18.2%) and direct (10.9%) attacks. A
  greater number of goal-scoring attempts were observed when teams used out-swinging crosses (17.4%) as opposed
  to in-swinging (15%) and straight (13.5%) crosses. There was a significant (p < 0.05) association between the type of
  attack and match status. Winning teams preferred to adopt a counter-attacking style of play; losing teams used more
  direct attacking strategies, and drawing teams utilized more organized attacks. Losing teams took the highest number
  of crosses from Zones 1 (61.1%) and 2 (56.7%) compared to other zones. These findings provide practical implications
  for football coaches to tailor match tactics to replicate crossing scenarios at international competitions.

  Keywords: cross outcome, match status, attacking, goal-scoring

             @MJSSMontenegro
             CROSSING AT FIFA WORLD CUP 2018
             http://mjssm.me/?sekcija=article&artid=230

  Cite this article: Mitrotasios, M., Kubayi, A., Armatas, V., & Larkin, P. (2022). Analysis of Crossing Opportunities at
  the 2018 FIFA World Cup. Montenegrin Journal of Sports Science and Medicine, 11 (1), Ahead of Print. https://doi.
  org/10.26773/mjssm.220305

Introduction                                                                 (Sarkar, 2018). In football terms, a cross is defined as the delivery
    The majority of match analysis studies in association football           of the ball from wide areas of the pitch into the opponent’s 18-
have centred on the key game aspects of scoring and creating scor-           yard box (Hargreaves & Bate, 2010; Vecer, 2014). From open-play
ing opportunities (Pulling et al., 2018; Wright et al., 2011). Goal          situations, this attacking tactical strategy has been found to con-
scoring is a key indicator of successful performance in football, as         tribute to 13% of goals scored at the 2006 and 2010 FIFA (Fédéra-
winning a game is dependent on scoring more goals than the op-               tion Internationale de Football Association) World Cups and 28%
position (Araya & Larkin, 2013). From an attacking perspective,              at the 2002 FIFA World Cup (Mara et al., 2012; Smith & Lyons,
delivering crosses from the wide areas of the pitch in the attacking         2017; Vecer, 2014). While crossing may contribute to goal-scoring
third is a standard tactic for creating goal-scoring opportunities           opportunities, this area of performance analysis has received little

Received: 20 May 2021 | Accepted after revision: 7 July 2021 | Early access publication date: 1 September 2021 | Final publication date: 1 March 2022
© 2022 by the author(s). License MSA, Podgorica, Montenegro. This article is an open access article distributed under the terms and conditions of
the Creative Commons Attribution (CC BY).
Conflict of interest: None declared.

DOI 10.26773/mjssm.220305                                                                                                                             1
CROSSING AT FIFA WORLD CUP 2018 | M. MITROTASIOS ET AL.
attention among performance analysis researchers (Pulling et al., livering the cross. Finally, concerning the time of crosses, most
2018). were played during the last interval of the game (20.9%) (Pulling
To date, few published studies have formally investigated et al., 2018). While the findings indicate the type of crosses and
crossing at FIFA World Cups (Pulling et al., 2018). One seminal when they occurred during a match, a shortcoming of the study is
paper in the area investigated the mechanisms of crosses during the limited acknowledgement of performance indicators such as
the 1986 FIFA World Cup. Partridge and Franks (1989a; 1989b) the type of attack (i.e., direct attacks or counter-attacks) and the
analysed a total of 1,427 open-play crosses and concluded that number of attacking and defensive players within the penalty box
crosses should be played first time, past the near post, behind in relation to cross outcome.
defenders, without loft and hang time, and should not be deliv- While previous studies have provided descriptive under-
ered from around the corner flag. While this study provided key standings of crossing in men’s football (Partridge & Franks, 1989a;
recommendations, the research was conducted over 30 years ago, 1989b; Yamada & Hayashi, 2015), more research is required to
and the game of football has since evolved with regards to playing gain a holistic understanding of the mechanism of crossing for
style, team formations, rule changes and the use of technology generating goal-scoring opportunities (Pulling et al., 2018). Fur-
(Kubayi & Larkin, 2019; Wallace & Norton, 2014). Therefore, thermore, it is important to consider the potential relationship
there is a need to provide more contemporary analyses and sug- between crossing and match status (i.e., whether the crossing
gestions for the use of crossing to create goal-scoring opportuni- team is drawing, winning, or losing) to gain a complete perspec-
ties in football. tive of the use of crossing as an attacking tactical strategy). There-
To extend the original analysis by Partridge and Franks (1989a; fore, the purpose of the current study was to examine open-play
1989b), Yamada and Hayashi (2015) examined 64 goal-scoring crosses in the 2018 FIFA World Cup tournament, with specific
plays occurring from crosses in the 2010 FIFA World Cup and reference to the mechanism and match status of the crosses. Foot-
the 2012 European Football Championship tournaments. It was ball coaches can use the findings to inform coaching practice to
reported that early crosses were played between the penalty spot replicate crossing scenarios relative to the game situation within
and the goal area; when defenders were organized, attacking the practice environment (Pulling et al., 2018).
players cut backcrosses around the penalty spot; and half of the
crosses were delivered in front of the near post. Although the re- Methods
sults provided some description of the types of crosses used in Match Sample
matches, a limitation of the research was that key performance All 64 matches played during the 2018 FIFA World Cup were
variables, such as the time of crosses and defensive pressure, were analysed by the lead researcher using the Lince video analysis
not considered. This is an important consideration, as it will pro- software (Gabin et al., 2012), with all crosses identified and coded.
vide a more holistic description of crossing opportunities, which Crosses were included in the study if they were delivered into the
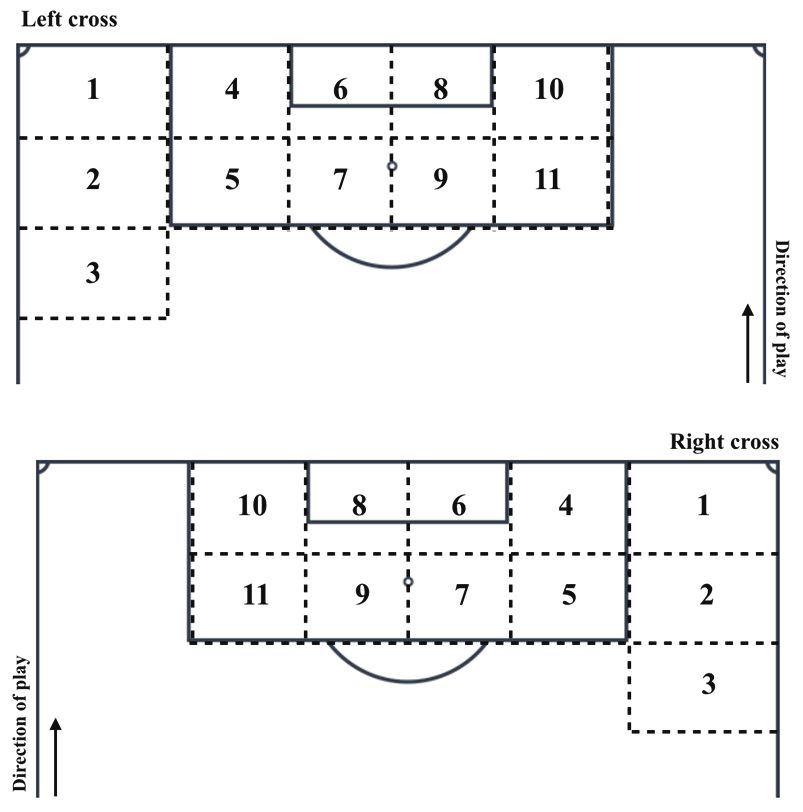
is lacking in the existing body of knowledge (Pulling et al., 2018). 18-yard box and were delivered from Zones 1, 2, 3, 4 or 5 (Figures
Pulling et al. (2018) observed open-play crosses from all 64 1A and 1B). In accordance with previous crossing literature, set-
games of the 2014 FIFA World Cup to address this gap. The results piece and blocked crosses were excluded from the analysis (Pull-
showed that a total of 1,332 crosses were played directly, result- ing et al., 2018). As a result, a total of 949 open-play crosses were
ing in 42 goals (3.2%), 56 attempts on target that did not result analysed for this study.
in a goal (4.2%), 80 attempts off-target (6.0%) and 1,154 of the
crosses not leading to a goal-scoring opportunity (86.6%). Con- Observational instrument
cerning the type of delivery, out-swinging crosses were the pre- An observational instrument adapted from previous studies
dominant type of cross (77.8%) compared to in-swinging (13.4%) (Casal et al., 2015; Kubayi & Larkin, 2019; Pulling et al., 2018;
and straight deliveries (8.9%). With regard to defensive pressure, Pulling, 2013; Pulling, Robins & Rixon, 2013; Tenga et al., 2010a)
the crosser was mostly under medium defensive pressure (i.e., a was used in the current study. The instrument consists of the fol-
defender being 1.5–5 m away from the crosser) (48.0%) when de- lowing 11 dimensions: 1) type of attack (i.e., organized attack, di-
Table 1. Operational Definitions of the Crossing Variables
Category and variables Definition
Type of attack
a) The possession starts by winning the ball in play or restarting the game. b) The progression towards the goal has
a high number of non-penetrative and short passes. c) The ball tends to be moved across the width of the pitch
Organized attack rather than progressing deep towards the opposing goal, and the intention is to create disorder among the op-
posing team’s players using a high number of passes and a relatively slow tempo (evaluated qualitatively). d) The
defending team is in a balanced formation and has the opportunity to minimize any surprise attack.
(a) The possession starts by winning the ball in play or restarting the game. b) The progression towards the goal
is based on one long pass from the defensive players to the forward players (evaluated qualitatively). c) The ball is
Direct attack moved deep up the pitch rather than across its width, and the intention is to move the ball directly towards the
opposing goal area to have opportunities of finishing by using a reduced number or passes and a high tempo. d)
The defending team is in a balanced formation and has the opportunity to minimize any surprise attack.
a) The possession starts by winning the ball in play. b) The progression towards the goal attempts to utilize a degree
of imbalance right from start to the end, with a high tempo. c) The ball is moved quickly up the pitch, and the inten-
Counter-attack
tion is to exploit the spaces left by the opposing players when they were attacking. d) The defending team is in an
unbalanced formation and does not have the opportunity to minimize a surprise attack.
Delivery type
Out-swinging The ball was kicked and moved in a curve away from the goal.
(continued on next page)
2 DOI 10.26773/mjssm.220305CROSSING AT FIFA WORLD CUP 2018 | M. MITROTASIOS ET AL.
(continued from previous page)
Table 1. Operational Definitions of the Crossing Variables
Category and variables Definition
In-swinging The ball was kicked and moved in a curve towards the goal.
Straight The ball was kicked with no curve.
Pitch side of delivery
Right The cross was delivered from the right side of the pitch.
Left The cross was delivered from the left side of the pitch.
Defensive proximity to the crosser
Low There is no defensive player within 2 metres of the crosser.
Medium A defender is between 1 and 2 metres away from the crosser.
High A defender is less than 1 metres from the crosser.
Time of cross
0–15 min The cross was taken during the 0–15-minute period of the match.
16–30 min The cross was taken during the 16–30-minute period of the match.
31 min–half-time The cross was taken between 31 minutes and half-time.
46–60 min The cross was taken during the 46–60-minute period of the match.
61–75 min The cross was taken during the 61–75-minute period of the match.
76 min–full time The cross was taken between 76 minutes and full time.
Extra-time The cross was taken within the first or second period of extra time.
Number of attacking players in the 18-yard box
Micro group One or two attacking players located inside the 18-yard box when crosser kicks the ball.
Meso group Three or four attacking players located inside the 18-yard box when crosser kicks the ball.
Macro group Five or more attacking players located inside the 18-yard box when crosser kicks the ball.
Number of defensive players in the 18-yard box
Micro group Up to three defending players (excluding goalkeeper) located inside the 18-yard box when crosser kicks the ball.
Between four and six defending players (excluding goalkeeper) located inside the 18-yard box when crosser
Meso group
kicks the ball.
Seven or more defending players (excluding goalkeeper) located inside the 18-yard box when the crosser kicks
Macro group
the ball.
Cross outcome
Goal The ball went over the goal-line and into the net after an attacking player touched it. The referee awarded a goal.
Attempt on target excluding Any goal attempt that was heading towards the goal but was saved by the goalkeeper or blocked by a defensive
goals player.
Any attempt by the attacking team that was not directed within the dimensions of the goal. An attempt that
Attempt off target
made contact with the crossbar or either of the posts was classified as an attempt off target.
Penalty A player on the defending team committed a foul and the referee awarded a penalty.
Ball recycled out of the 18-yard The attacking team made contact with the ball, which led to the ball exiting the 18-yard box and possession
box being retained by the attacking team.
An attacking player contacts the ball after the cross but fails to control it, allowing the defenders an opportunity
Unsuccessful attacking action
to recover it.
Defensive clearance – corner A defensive outfield player made contact with the ball, and the referee awarded a corner kick.
Defensive clearance – throw-in A defensive outfield player made contact with the ball, and the referee awarded a throw-in.
Defensive clearance A defensive outfield player made contact with the ball, and it exited the 18-yard box.
No contact in the 18-yard box The ball was not touched by any player and the ball exited the 18-yard box (includes goal kicks).
The goalkeeper comes and gathers/collects the ball (i.e., the cross bounces on the floor and then the goalkeeper
Goalkeeper gathers the ball
collects the ball).
Goalkeeper catch The goalkeeper gained possession of the ball by catching a cross.
Goalkeeper punch The goalkeeper made contact with the ball by using a punching action.
Goalkeeper clearance The goalkeeper made contact with the ball, and it exited the 18-yard box.
Match status
Drawing The score line for both teams was levelled (e.g., 0–0, 1–1).
Losing The crossing team was trailing (e.g., 0–1, 1–2).
Winning The crossing team was leading (e.g., 1–0, 2–1).
DOI 10.26773/mjssm.220305 3CROSSING AT FIFA WORLD CUP 2018 | M. MITROTASIOS ET AL.
rect attack and counter-attack); 2) delivery type (i.e., out-swing- and 1B); (0) the cross outcome (i.e., goal, attempt on target ex-
ing, in-swinging and straight); 3) side of the pitch (i.e., right and cluding goals, attempt off target, penalty, ball recycled out of the
left); 4) defensive proximity to the crosser (i.e., low, medium and 18-yard box, unsuccessful attacking action, defensive clearance
high); 5) time of cross (i.e., 0–15 min, 16–30 min, 31 min–half- – corner, defensive clearance – throw-in, defensive clearance, no
time, 46–60 min, 61–75 min, 76 min–full time and extra-time); 6) contact in the 18-yard box, goalkeeper gathers the ball, goalkeep-
number of attacking players in the 18-yard box (i.e., micro, meso er catch, goalkeeper punch and goalkeeper clearance); and 11)
and macro groups); 7) number of defensive players in the 18-yard match status (i.e., team crossing was winning, drawing or losing).
box (i.e., micro, meso and macro groups); 8) zone of the crosser The operational definitions of these performance indicators are
(see Figures 1A and 1B); 9) zone of the outcome (see Figures 1A provided in Table 1.
Figure 1. Zonal analysis for crosses delivered from the A) left and B) right side of the pitch
Reliability testing ues > 0.80 were reported, showing the performance variables
Intra- and inter-observer reliability tests were examined above the thresholds (Altman, 1991). Regarding inter-observ-
using Cohen’s kappa (κ) correlation coefficient. For intra-ob- er reliability, a second independent football analyst analysed
server reliability, 121 crosses (i.e., 13% of total crosses) were the same number of crosses under similar conditions. Kappa
selected and analysed on two occasions (separated by a two- values > 0.82 were observed for all performance indicators
week interval) by an independent football analyst. Kappa val- (Table 2).
Table 2. The Intra- and Inter-Rater Reliability Analysis (Κ) for Crossing Variables
Intra-observer Inter-observer
Variable
Kappa value Kappa value
Type of attack 0.91 0.84
Delivery type 0.90 0.88
Pitchside of delivery 1.00 1.00
Defensive proximity to the crosser 0.87 0.85
Time of cross 1.00 1.00
Number of attacking players in the 18-yard box 0.88 0.85
Number of defensive players in the 18-yard box 0.80 0.82
Zone of the crosser 0.84 0.87
Zone of the outcome 0.88 0.85
Cross outcome 0.86 0.84
4 DOI 10.26773/mjssm.220305CROSSING AT FIFA WORLD CUP 2018 | M. MITROTASIOS ET AL.
Statistical analysis Results
Frequency counts and percentages were used to analyse Table 3 shows frequency counts and percentages of all cross-
the crossing variables. Because some cells had expected counts ing performance indicators. A total of 949 crosses were observed,
of less than five, which undermined the assumption of a chi- resulting in 20 goals scored (2.1%). There were 51 attempts on tar-
square test (Thomas et al., 2015), the cross outcome variable get, excluding goals (5.4%) and 85 attempts off-target (9.0%). The
was collapsed into four distinct categories: 1) goal-scoring most common cross outcome was a defensive clearance (40.5%).
attempts (i.e., goals, attempts on target excluding goals and An organized attack was the main offensive strategy for crossing
attempts off-target); 2) attacking outcomes (i.e., ball recycled the ball (66.7%), followed by a direct attack (24.2%) and count-
out of the 18-yard box, defensive clearance – corner, defen- er-attack (9.1%). The preferred delivery type was an out-swing-
sive clearance – throw-in and penalty); 3) defensive outcomes ing (69.1%) cross. When a cross was performed, defenders were
(i.e., defensive clearance, no contact in the 18-yard box and positioned in a low (47.1%) or medium (40.6%) proximity to
unsuccessful attacking action); and 4) goalkeeper actions (i.e., the crosser of the ball. The period in the match with the highest
goalkeeper catch, goalkeeper gathers the ball and goalkeeper number of crosses was between the 76th minute and full time
punch) (Pulling et al., 2018). Effect sizes were computed using (17.4%). Most crosses were performed when a micro-number of
Cramer’s V (V) and interpreted as small (V = 0.10), medium attacking players (60.8%) or a meso-number of defensive players
(V = 0.30) or large (V ≥ 0.50) (Gravetter & Wallnau, 2007). A (60.5%) was in the 18-yard box. A greater number of crosses were
level of significance was set at 0.05. All statistical analyses were taken from Zones 2 (31.6%) and 3 (36.2%), with the majority of
computed using SPSS version 26 (SPSS Inc., Chicago, IL, USA). crosses delivered to Zones 6 (26.8%) and 7 (21.4%).
Table 3. Frequency Counts and Percentage for Crossing Variables
Category and variable Frequency (%)
Type of attack
Organized attack 633 (66.7)
Direct attack 230 (24.2)
Counterattack 86 (9.1)
Delivery type
Out-swinging 656 (69.1)
In-swinging 160 (16.9)
Straight 133 (14.0)
Pitchside of delivery
Right 536 (56.5)
Left 413 (43.5)
Defensive proximity to the crosser
Low 447 (47.1)
Medium 385 (40.6)
High 117 (12.3)
Time of cross
0–15 min 140 (14.8)
16–30 min 128 (13.5)
31 min–half-time 144 (15.2)
46–60 min 160 (16.9)
61–75 min 153 (16.1)
76 min–full time 165 (17.4)
Extra-time 59 (6.2)
Number of attacking players in the 18-yard box
Micro-group 577 (60.8)
Meso-group 342 (36.0)
Macro-group 30 (3.2)
Number of defensive players in the 18-yard box
Micro-group 276 (29.1)
Meso-group 574 (60.5)
Macro-group 99 (10.4)
Zone of the crosser
Zone 1 193 (20.3)
(continued on next page)
DOI 10.26773/mjssm.220305 5CROSSING AT FIFA WORLD CUP 2018 | M. MITROTASIOS ET AL.
(continued from previous page)
Table 3. Frequency Counts and Percentage for Crossing Variables
Category and variable Frequency (%)
Zone 2 300 (31.6)
Zone 3 344 (36.2)
Zone 4 72 (7.6)
Zone 5 40 (4.2)
Zone of the outcome
Zone 4 16 (1.7)
Zone 5 30 (3.2)
Zone 6 254 (26.8)
Zone 7 203 (21.4)
Zone 8 178 (18.8)
Zone 9 90 (9.5)
Zone 10 29 (3.1)
Zone 11 13 (1.4)
No zone 136 (14.3)
Cross outcome
Goal 20 (2.1)
Attempt on target excluding goals 51 (5.4)
Attempt off target 85 (9.0)
Penalty 2 (0.2)
Ball recycled out of the 18-yard box 20 (2.1)
Unsuccessful attacking action 27 (2.8)
Defensive clearance – corner 69 (7.3)
Defensive clearance – throw in 48 (5.1)
Defensive clearance 384 (40.5)
No contact in the 18-yard box 136 (14.3)
Goalkeeper gathers the ball 25 (2.6)
Goalkeeper catch 65 (6.8)
Goalkeeper punch 9 (0.9)
Goalkeeper clearance 8 (0.8)
Table 4 shows the crossing variables in relation to ed that there were a higher number of goal-scoring attempts
goal-scoring attempts, attacking and defensive outcomes, and when the teams used out-swinging crosses (17.4%) compared
goalkeeper actions. There was no significant association be- to in-swinging (15%) and straight (13.5%) crosses. In-swinging
tween the type of attack and cross outcomes (χ2 = 10.62, p = crosses resulted in more goalkeeper actions, while out-swing-
0.09, V = 0.07). However, the descriptive statistics indicated ing crosses led to fewer goalkeeper actions. Crosses taken from
that teams had more goal-scoring attempts when they used Zone 5 (27.5%) produced the highest number of goal-scoring
counter-attacks (18.6%) compared to organized (18.2%) and attempts, while those from Zone 3 (14%) yielded the lowest
direct (10.9%) attacks. In addition, there was no significant as- number of goal-scoring opportunities. Crosses delivered to
sociation between the type of delivery and cross outcome (χ2 Zone 5 (66.6%), Zone 7 (67%), Zone 9 (57.8%) and Zone 11
= 7.15, p = 0.31, V = 0.08), although the findings highlight- (61.5%) had higher defensive outcomes than other zones.
Table 4. Crossing Variables in Relation to Goal-Scoring Attempts, Attacking and Defensive Outcomes, and Goalkeeper Actions
Category and Goal scoring Attacking Defensive
Goalkeeper actions Χ2 Sig. Cramer’s v
variable attempts outcomes outcomes
Type of attack
Organized attack 115 (18.2) 84 (13.3) 366 (57.8) 68 (10.7) 10.62 0.09 0.07
Direct attack 25 (10.9) 38 (16.5) 139 (60.4) 28 (12.2)
Counterattack 16 (18.6) 17 (19.8) 42 (48.8) 11 (12.8)
Delivery type
Out-swinging 114 (17.4) 97 (14.8) 377 (57.5) 68 (10.3) 7.15 0.31 0.08
(continued on next page)
6 DOI 10.26773/mjssm.220305CROSSING AT FIFA WORLD CUP 2018 | M. MITROTASIOS ET AL.
(continued from previous page)
Table 4. Crossing Variables in Relation to Goal-Scoring Attempts, Attacking and Defensive Outcomes, and Goalkeeper Actions
Category and Goal scoring Attacking Defensive
Goalkeeper actions Χ2 Sig. Cramer’s v
variable attempts outcomes outcomes
In-swinging 24 (15.0) 17 (10.6) 95 (59.4) 24 (15.0)
Straight 18 (13.5) 25 (18.8) 75 (56.4) 15 (11.3)
Pitchside of delivery
Right 85 (15.9) 68 (12.7) 318 (59.3) 65 (12.1) 4.89 0.18 0.07
Left 71 (17.2) 71 (17.2) 229 (55.4) 42 (10.2)
Defensive proximity to the crosser
Low 73 (16.3) 67 (15.0) 260 (58.2) 47 (10.5) 5.52 0.48 0.06
Medium 69 (17.9) 49 (12.7) 220 (57.1) 47 (12.2)
High 14 (12) 23 (19.7) 67 (57.3) 13 (11.1)
Time of cross
0–15 min 24 (17.1) 21 (15.0) 79 (56.4) 16 (11.4) 18.43 0.42 0.08
16–30 min 16 (12.5) 26 (20.3) 67 (52.3) 19 (14.8)
31 min–half-time 20 (13.9) 14 (9.7) 94 (65.3) 16 (11.1)
46–60 min 28 (17.5) 23 (14.4) 93 (58.1) 16 (10.0)
61–75 min 25 (16.3) 28 (18.3) 80 (52.3) 20 (13.1)
76 min–full time 32 (19.4) 17 (10.3) 101 (61.2) 15 (9.1)
Extra-time 11 (18.6) 10 (16.9) 33 (55.9) 5 (8.5)
Number of attacking players in the 18-yard box
Micro-group 81 (14.0) 86 (14.9) 339 (58.8) 71 (12.3) - - -
Meso-group 66 (19.3) 48 (14.0) 196 (57.3) 32 (9.4)
Macro-group 9 (30.0) 5 (16.7) 12 (40.0) 4 (13.3)
Number of defensive players in the 18-yard box
Micro-group 41 (14.9) 39 (14.1) 156 (56.5) 40 (14.5) 5.88 0.45 0.06
Meso-group 96 (16.7) 84 (14.6) 339 (59.1) 55 (9.6)
Macro-group 19 (19.2) 16 (16.2) 52 (52.5) 12 (12.1)
Zone of the crosser
Zone 1 28 (14.5) 34 (17.6) 113 (58.5) 18 (9.3) - - -
Zone 2 51 (17.0) 40 (13.3) 176 (58.7) 33 (11.0)
Zone 3 48 (14.0) 50 (14.5) 197 (57.3) 49 (14.2)
Zone 4 18 (25.0) 11 (15.3) 37 (51.4) 6 (8.3)
Zone 5 11 (27.5) 4 (10.0) 24 (60.0) 1 (2.5)
Zone of the outcome
Zone 4 2 (12.5) 6 (37.5) 8 (50.0) 0 (0) - - -
Zone 5 2 (6.7) 6 (20.0) 20 (66.6) 2 (6.7)
Zone 6 42 (16.5) 41 (16.1) 115 (45.3) 56 (22.1)
Zone 7 33 (16.3) 32 (15.8) 136 (67.0) 2 (1.0)
Zone 8 41 (23.0) 31 (17.4) 63 (35.4) 43 (24.2)
Zone 9 25 (27.8) 12 (13.3) 52 (57.8) 1 (1.1)
Zone 10 6 (20.7) 11 (37.9) 9 (31.0) 3 (10.4)
Zone 11 5 (38.5) 0 (0) 8 (61.5) 0 (0)
No zone 0 (0) 0 (0) 136 (100) 0 (0)
There was a significant association between the type of attack the game. There was a significant association between the number
and match status (χ2 = 31.72, p = 0.001, V = 0.13). Winning teams of defensive players in the 18-yard box and match status (χ2 =
preferred to adopt a counter-attacking style of play; losing teams 15.90, p = 0.001, V = 0.09). Teams had the highest number of de-
used more direct attacking strategies; drawing teams adopted fensive players in the 18-yard box when losing (65.6%). A signif-
more organized attacks. A significant association was noted be- icant association was found between the zone of the crosser and
tween the time of a cross and match status (χ2 = 135.95, p = 0.001, match status (χ2 = 37.20, p = 0.001, V = 0.14), with losing teams
V = 0.27). Losing teams delivered a greater number of crosses delivering a greater number of crosses from Zones 1 (61.1%) and
during the 0–15 min (85.7%) and 16–30 min (73.4%) periods of 2 (56.7%) compared to Zones 4 (47.2%) and 5 (45%) (Table 5).
DOI 10.26773/mjssm.220305 7CROSSING AT FIFA WORLD CUP 2018 | M. MITROTASIOS ET AL.
Table 5. Crossing Variables in Relation to Match Status
Category and variable Winning Losing Drawing Χ2 Sig. Cramer’s v
Type of attack 31.72 0.00 0.13
Organized attack 63 (9.9) 331 (52.3) 239 (37.8)
Direct attack 34 (14.8) 137 (59.6) 59 (25.6)
Counterattack 24 (27.9) 36 (41.9) 26 (30.2)
Delivery type 4.80 0.30 0.05
Out-swinging 87 (13.3) 355 (54.1) 214 (32.6)
In-swinging 16 (10.0) 88 (55.0) 56 (35.0)
Straight 18 (13.5) 61 (45.9) 54 (40.6)
Pitch side of delivery 0.22 0.90 0.01
Right 70 (13.1) 286 (53.3) 180 (33.6)
Left 51 (12.3) 218 (52.8) 144 (34.9)
Defensive proximity to the crosser 0.50 0.97 0.02
Low 56 (12.5) 234 (52.4) 157 (35.1)
Medium 51 (13.2) 206 (53.5) 128 (33.3)
High 14 (12.0) 64 (54.7) 39 (33.3)
Time of cross 135.95 0.00 0.27
0–15 min 6 (4.3) 120 (85.7) 14 (10.0)
16–30 min 11 (8.6) 94 (73.4) 23 (18.0)
31 min–half-time 23 (16.0) 76 (52.8) 45 (31.2)
46–60 min 23 (14.4) 82 (51.2) 55 (34.4)
61–75 min 24 (15.7) 49 (32.0) 80 (52.3)
76 min–full time 25 (15.1) 61 (37.0) 79 (47.9)
Extra-time 9 (15.2) 22 (37.3) 28 (47.5)
Number of attacking players in the 18-yard box - - -
Micro-group 98 (17.0) 290 (50.3) 189 (32.7)
Meso-group 21 (6.1) 199 (58.2) 122 (35.7)
Macro-group 2 (6.7) 15 (50.0) 13 (43.3)
Number of defensive players in the 18-yard box 15.90 0.00 0.09
Micro-group 49 (17.8) 129 (46.7) 98 (35.5)
Meso-group 66 (11.5) 310 (54.0) 198 (34.5)
Macro-group 6 (6.1) 65 (65.6) 28 (28.3)
Zone of the crosser 37.20 0.00 0.14
Zone 1 22 (11.4) 118 (61.1) 53 (27.5)
Zone 2 37 (12.3) 170 (56.7) 93 (31.0)
Zone 3 34 (9.9) 164 (47.7) 146 (42.4)
Zone 4 21 (21.2) 34 (47.2) 17 (23.6)
Zone 5 7 (17.5) 18 (45.0) 15 (37.5)
Zone of the outcome - - -
Zone 4 9 (56.2) 1 (6.2) 6 (37.5)
Zone 5 7 (23.3) 9 (30.0) 14 (46.7)
Zone 6 93 (36.6) 46 (18.1) 115 (45.3)
Zone 7 65 (32.0) 51 (25.1) 87 (42.9)
Zone 8 70 (39.3) 39 (21.9) 69 (38.8)
Zone 9 28 (31.1) 24 (26.7) 38 (42.2)
Zone 10 8 (27.6) 7 (24.1) 14 (48.3)
Zone 11 7 (53.8) 2 (15.4) 4 (30.8)
No zone 40 (29.4) 37 (27.2) 59 (43.4)
Discussion served, resulting in 20 goals (2.1%) scored. This statistic is low-
The current study investigated crossing opportunities at er than those in previously reported studies, in which 1,427
the 2018 FIFA World Cup. A total of 949 crosses were ob- (2.7% goals) and 1,332 (3.2% goals) crosses were observed at
8 DOI 10.26773/mjssm.220305CROSSING AT FIFA WORLD CUP 2018 | M. MITROTASIOS ET AL.
the 1986 and 2018 FIFA World Cup tournaments, respectively to the ball angling towards the goalkeeper during its flight,
(Pulling et al., 2018; Partridge & Franks, 1989a; 1989b). In ad- which may influence the goalkeeper’s decision-making pro-
dition, 5.4% of attempts on target did not result in a goal, and cess in terms of coming out and claiming the ball. Conversely,
9% of crosses led to off-target attempts. Surprisingly, despite out-swinging crosses may reduce the ability of the goalkeeper
the higher percentage of attempts at goal compared to the 2014 to intercept a ball or leave the goal line to claim it (Kubayi &
World Cup (Pulling et al., 2018), there was a low scoring rate Larkin, 2020; Link et al., 2016; Pulling et al., 2018), thereby
at the 2018 World Cup. This result may suggest that football giving the attacking players more time and space to direct the
coaches are developing and implementing better defensive ball towards the goal (Casal et al., 2015).
strategies to deal with crosses, or teams are implementing more In relation to the area on the pitch from which a cross
of a possession-based and central attacking strategy. However, was delivered, crosses from Zone 3 had the lowest number of
as it was not an aim of this paper to determine the reasons for goal-scoring attempts. A possible explanation for this finding
the differences in crossing statistics between tournaments, this could be that as this zone is the furthest from the goal; once
may be something for future research to consider. the ball has been crossed, it is likely to travel a greater distance
The current study showed that more crosses were per- and for a greater duration of time, thus giving the defensive
formed using an organized attack rather than direct attacks team a greater opportunity to position themselves to intercept
and counter-attacks. This finding suggests that teams may pre- the ball (Pulling et al., 2018). Interestingly, Zones 5, 7, 9 and
fer to hold onto the ball rather than consistently play long balls 11 had a greater number of defensive outcomes than all other
into the box (Kubayi & Toriola, 2018). In relation to the type of zones, which could be because it is easier for defenders to clear
delivery, the highest proportion of crosses were out-swinging the ball out of the 18-yard box without conceding a throw-in
deliveries as opposed to in-swinging and straight crosses. This or corner kick if the cross is delivered from within the 18-yard
result is expected, considering that players on the left side of box, as the defenders may be positioned closer to the crosser
the pitch would mainly use their left foot to cross the ball and and the intended target (i.e., they are in Zones 5, 7, 9 and 11)
vice versa (Pulling et al., 2018). Most crosses were performed (Pulling et al., 2018).
while low or medium pressure was being applied to the player A key aim of the current study was to understand the influ-
delivering the cross. Therefore, a practical recommendation ence of match status in relation to crossing variables. Overall,
for football coaches would be to develop training sessions that the findings demonstrate that losing teams played more cross-
promote increased defensive pressure on the player crossing es than winning and drawing teams, which is clearly an at-
the ball. Doing so may channel the attacking player towards tempt to create more goal-scoring opportunities and get back
the corner flag or force them to play the ball backwards, thus into the game. In addition, losing teams delivered a greater
reducing the number of crosses into the 18-yard area. Finally, number of crosses during the 0–15 min and 16–30 min peri-
a greater number of crosses were delivered into the box during ods. This finding may indicate that when a team is losing early
the last interval of the game (i.e., 76th minute – full-time). in a match, there may be a sense of urgency during these first
This finding suggests that during the final period of the game, two intervals of the game in order to avoid chasing the game
teams aim to play the ball into the box in an attempt to create towards the end.
a goal-scoring opportunity in order to obtain a positive result Further, losing teams also delivered a greater number of
from the match (Kubayi, 2020). crosses from Zones 1 and 2 compared to Zones 4 and 5, which
While the findings indicated that more crosses were per- may indicate that when teams are losing, they tend to get
formed using an organized attack, in relation to creating the ball into wider positions on the field to create goal-scor-
goal-scoring opportunities, a higher percentage of goal-scor- ing opportunities. It should also be noted that when teams
ing attempts were achieved when teams adopted a counter-at- were losing, they adopted a more organized crossing attack-
tacking strategy. This finding is consistent with previous litera- ing strategy. This finding further supports those of Bradley et
ture, which reported that teams in the Norwegian professional al. (2014), who reported that when teams were behind, they
league that used a counter-attacking strategy scored more increased their possession, suggesting that they preferred to
goals than those that adopted more elaborate attacking strate- control the game by dictating the play. Conversely, the current
gies (Tenga et al., 2010b). An advantage of a counter-attacking findings indicated that when teams were winning, they used a
style of play is that it quickly moves the ball to offensive zones counter-attacking style of play in relation to the crosses they
and prevents defending teams from reorganizing (Kim et al., delivered. This result substantiates those of previous studies,
2019). As a result, it may lead to more goal-scoring oppor- showing that when teams are winning, they do not retain ball
tunities for the attacking team. Therefore, if coaches want to possession but seem to adopt more counter-attacking strate-
increase the goal-scoring opportunities for their team, they gies (Lago, 2009; Lago & Martin, 2007).
may want to consider adopting a more counter-attacking style The present study aimed to analyse open-play crosses at
of play. the 2018 FIFA World Cup competition, with reference to the
When considering the type of delivery, out-swinging cross mechanism and match status. Of the 949 crosses ob-
crosses produced more goal-scoring attempts than other types served, a total of 20 goals (2.1%) were scored. The findings
of crosses did. This result supports the findings of Casal et al. showed that teams had more goal-scoring attempts when they
(2015), who identified that teams using out-swinging cross- adopted a counter-attacking strategy in contrast to direct and
es had a higher number of shots on target than those using organized attacks. Out-swinging crosses produced a greater
in-swinging crosses. Furthermore, in-swinging crosses re- number of goal-scoring attempts as opposed to in-swinging
sulted in more goalkeeper actions compared to out-swinging and straight crosses. Winning teams were found to use a more
crosses. The current study also corroborates the findings of counter-attacking style of play, while losing teams attempted
Pulling et al. (2018), who reported that in-swinging cross- more crosses and adopted more organized attacking strategies.
es promote more goalkeeper interventions, presumably due Overall, the current study explains how teams implemented
DOI 10.26773/mjssm.220305 9CROSSING AT FIFA WORLD CUP 2018 | M. MITROTASIOS ET AL.
crossing strategies at the 2018 FIFA World Cup. The results Mara, J. K., Wheeler, K. W., & Lyons, K. (2012). Attacking
provide football coaches with recommendations to develop strategies that lead to goal scoring opportunities in
successful crossing strategies at international competitions. high level women’s football. International Journal of
Sports Science & Coaching, 7(3), 565-577. https://doi.
References org/10.1260/1747-9541.7.3.565
Altman, D. G. (1995). Practical Statistics for Medical Research: Partridge, D., & Franks, I. M. (1989a). A detailed analysis
Chapman & Hall. of crossing opportunities in the 1986 World Cup Part I.
Araya, J. A., & Larkin, P. (2013). Key performance variables Soccer Journal, May/June, 47-50.
between the top 10 and bottom 10 teams in the English Partridge, D., & Franks, I. M. (1989b). A detailed analysis
Premier League 2012/13 season. Human Movement, of crossing opportunities in the 1986 World Cup Part II.
Health & Coach Education (HMHCE), 2, 17-29. Soccer Journal, June/July, 45-48.
Bradley, P. S., Lago-Peñas, C., Rey, E., & Sampaio, J. (2014). The Pulling, C. (2015). Long corner kicks in the English Premier
influence of situational variables on ball possession in the League: Deliveries into the goal area and critical area.
English Premier League. Journal of Sports Sciences, 32(20), Kinesiology, 47(2), 193-201.
1867-1873. https://doi.org/10.1080/02640414.2014.88785 Pulling, C., Eldridge, D., Ringshall, E., & Robins, M. T.
0 (2018). Analysis of crossing at the 2014 FIFA World
Casal, C.A., Manerio, R., Arda, T., Losada, J.L., & Rial, A. Cup. International Journal of Performance Analysis in
(2015). Analysis of corner kick success in elite football. Sport, 18(4), 657-677. https://doi.org/10.1080/24748668.2
International Journal of Performance Analysis in Sport, 018.1509255
15(2), 430-451. https://doi.org/10.1080/24748668.2015.11 Pulling, C., Robins, M., & Rixon, T. (2013). Defending
868805 corner kicks: Analysis from the English Premier League.
Gabin, B., Camerino, O., Anguera, M. T., & Castañer, M. (2012). International Journal of Performance Analysis in Sport,
Lince: multiplatform sport analysis software. Procedia- 13(1), 135-148.
Social and Behavioral Sciences, 46, 4692-4694. https://doi. Sarkar, S. (2018). Paradox of crosses in association football
org/10.1016/j.sbspro.2012.06.320 (soccer)–a game-theoretic explanation. Journal of
Gravetter, F.J., & Wallnau, L.B. (2007). Statistics for the Quantitative Analysis in Sports, 14(1), 25-36. https://doi.or
behavioral sciences (7th Ed.): Wadsworth. g/10.1080/24748668.2013.11868637
Hargreaves, A. (1990). Skills and Strategies for Coaching Soccer: Smith, R. A., & Lyons, K. (2017). A strategic analysis of goals
Leisure Press. scored in open play in four FIFA World Cup football
Kim, J., James, N., Parmar, N., Ali, B., & Vučković, G. (2019). championships between 2002 and 2014. International
Determining unstable game states to aid the identification Journal of Sports Science & Coaching, 12(3), 398-403.
of perturbations in football. International Journal of https://doi.org/10.1177/1747954117710516
Performance Analysis in Sport, 19(3), 302-312. https://doi. Tenga, A., Holme, I., Ronglan, L. T., & Bahr, R. (2010a).
org/10.1080/24748668.2019.1602439 Effect of playing tactics on goal scoring in Norwegian
Kubayi, A. (2020). Analysis of goal scoring patterns in the professional soccer. Journal of Sports Sciences, 28(3), 237-
2018 FIFA World Cup. Journal of Human Kinetics, 71, 205. 244. https://doi.org/10.1080/02640410903502774
https://doi.org/10.2478/hukin-2019-0084 Tenga, A., Holme, I., Ronglan, L. T., & Bahr, R. (2010b).
Kubayi, A., & Larkin, P. (2019). Analysis of teams’ corner Effect of playing tactics on achieving score-box
kicks defensive strategies at the FIFA World Cup possessions in a random series of team possessions
2018. International Journal of Performance Analysis in from Norwegian professional soccer matches. Journal
Sport, 19(5), 809-819. of Sports Sciences, 28(3), 245-255. https://doi.
Kubayi, A., & Larkin, P. (2020). Technical performance of org/10.1080/02640410903502766
soccer teams according to match outcome at the 2019 FIFA Thomas, J. R., Nelson, J. K., & Silverman, S. J. (2015). Research
Women’s World Cup. International Journal of Performance methods in physical activity: Human Kinetics.
Analysis in Sport, 20(5), 908-916. https://doi.org/10.14198/ Vecer, J. (2014). Crossing in Soccer has a Strong Negative
jhse.2022.171.15 Impact on Scoring: Evidence from the English Premier
Kubayi, A., & Toriola, A. (2020). Differentiating African teams League the German Bundesliga and the World Cup 2014.
from European teams: Identifying the key performance Social Science Network Research (SRN). http://ssrn.com/
indicators in the FIFA World Cup 2018. Journal of Human abstract=2225728 (accessed 10 October 2020).
Kinetics, 73, 203. https://doi.org/10.2478/hukin-2019-0144 Wallace, J. L., & Norton, K. I. (2014). Evolution of World Cup
Lago, C. (2009). The influence of match location, quality soccer final games 1966–2010: Game structure, speed and
of opposition, and match status on possession play patterns. Journal of Science & Medicine in Sport, 17(2),
strategies in professional association football. Journal 223-228. https://doi.org/10.1016/j.jsams.2013.03.016
of Sports Sciences, 27(13), 1463-1469. https://doi. Wright, C., Atkins, S., Polman, R., Jones, B., & Sargeson, L.
org/10.1080/02640410903131681 (2011). Factors associated with goals and goal scoring
Lago, C., & Martín, R. (2007). Determinants of possession of opportunities in professional soccer. International Journal
the ball in soccer. Journal of Sports Sciences, 25(9), 969- of Performance Analysis in Sport, 11(3), 438-449. https://
974. https://doi.org/10.1080/02640410600944626 doi.org/10.1080/24748668.2011.11868563
Link, D., Kolbinger, O., Weber, H., & Stöckl, M. (2016). Yamada, H., & Hayashi, Y. (2015). Characteristics of goal-
A topography of free kicks in soccer. Journal of Sports scoring crosses in international soccer tournaments.
Sciences, 34(24), 2312-2320. https://doi.org/10.1080/0264 Football Science, 12, 24-32.
0414.2016.1232487
10 DOI 10.26773/mjssm.220305You can also read