REPORT OF THE GERMAN TRANSMISSION SYSTEM OPERATORS ON AVAILABLE CROSS-ZONAL CAPACITY FOR THE YEAR 2020 PURSUANT TO ARTICLE 15(4) INTERNAL MARKET ...
←
→
Page content transcription
If your browser does not render page correctly, please read the page content below
REPORT OF THE GERMAN TRANSMISSION SYSTEM OPERATORS
ON AVAILABLE CROSS-ZONAL CAPACITY FOR THE YEAR 2020
PURSUANT TO ARTICLE 15(4) INTERNAL MARKET FOR ELECTRICITY
REGULATION (EU) 2019/943

CREATED BY

THE GERMAN TRANSMISSION SYSTEM OPERATORS WITH CONTROL
AREA RESPONSIBILITIES

IN COLLABORATION WITH THE TRANSMISSION SYSTEM OPERATOR
WITHOUT CONTROL AREA RESPONSIBILITY
Berlin, Dortmund, Bayreuth, Stuttgart, Malmö | Page 2 of 31

Table of Contents
SUMMARY ...................................................................................................................................................... 3
1. LEGAL BACKGROUND ............................................................................................................................. 4
2. LINEAR TRAJECTORY OF THE GERMAN ACTION PLAN ..................................................................... 5
3. MONITORING METHODOLOGY............................................................................................................... 7
3.1 Core region ................................................................................................................................................ 8
3.1.1 NTC border Germany – Poland and the Czech Republic ...................................................................... 8
3.1.2 CWE region .......................................................................................................................................... 10
3.2 Hansa region ........................................................................................................................................... 12
3.2.1 NTC borders Germany – Denmark 1 and Germany – Norway 2 ......................................................... 12
3.2.2 NTC border Germany – Denmark 2 ..................................................................................................... 13
3.2.3 NTC border Germany – Sweden 4 ....................................................................................................... 14
4. RESULTS ................................................................................................................................................. 15
4.1 Core region .............................................................................................................................................. 15
4.1.1 NTC border Germany – Poland and the Czech Republic .................................................................... 15
4.1.2 CWE region .......................................................................................................................................... 16
4.2 Hansa borders ......................................................................................................................................... 23
4.2.1 NTC border Germany – Denmark 1 ..................................................................................................... 23
4.2.2 NTC border German – Denmark 2 ....................................................................................................... 24
4.2.3 NTC border Germany – Norway 2........................................................................................................ 25
4.2.4 NTC border Germany – Sweden 4 ....................................................................................................... 26
LIST OF ABBREVIATIONS ........................................................................................................................... 30
LIST OF FIGURES/ILLUSTRATIONS ........................................................................................................... 31

 2
Berlin, Dortmund, Bayreuth, Stuttgart, Malmö | Page 3 of 31

SUMMARY

The EU Electricity Market Regulation (EU) 2019/943, which entered into force on 4/7/2019, prescribes a
minimum value for the capacity to be available for cross-zonal electricity trading of 70% as of 1/1/2020.
 1
With its “Action Plan Bidding Zone” , Germany is applying an exemption cause provided in Art. 15 of the
EU Electricity Market Regulation and is increasing the capacity for cross-zonal electricity trading from the
level of 2020 by a linear trajectory to a minimum of 70% by 31/12/2025. The implementation of an action
plan is associated with an obligation to carry out annual evaluations of compliance with the minimum
values for cross-zonal electricity trading by the involved transmission system operators. The present report
has been produced to meet this obligation by the control area-managing transmission system operators
50Hertz Transmission GmbH (50Hertz), Amprion GmbH (Amprion), TransnetBW GmbH (TransnetBW) and
TenneT TSO GmbH (TenneT) as well as the transmission system operator without control area
responsibility Baltic Cable AB. In accordance with the requirements of the EU Electricity Market Regulation,
the methodology and data basis of the present report had been submitted to the national regulatory
authority Bundesnetzagentur (BNetzA) for approval.

The minimum values for cross-zonal electricity trading at the borders Germany – Denmark 1, Germany –
Denmark 2, Germany – Norway 2 and Germany – Poland/Czech Republic were fulfilled at all times during
2020 by the responsible transmission system operators 50Hertz and TenneT. At the border Germany –
Sweden 4, TenneT was not able to reach the minimum value in the south direction during 1 hour and in the
north direction during a total of 2,301 hours within a period from 1/1/2020 to 27/8/2020. A restriction on
cross-border trading existed during 39 hours. None of these deficiencies can be attributed to restrictions
from Baltic Cable AB. The deficiencies were justified for reasons of system stability in the absence of
alternative measures pursuant to Art. 16(3) of Regulation (EU) 2019/943, and it was managed to
subsequently prevent them as of 28/8/2020 by establishing the necessary processes.

On the network elements of the CWE region, the minimum value had been reached at all times by the
responsible transmission system operators Amprion, TenneT and TransnetBW.

In summary, 50Hertz, Amprion, TransnetBW, TenneT and Baltic Cable AB complied with the statutory
requirements for cross-zonal electricity trading pursuant to Art. 15 and 16 of the EU Electricity Market
Regulation at all times during the year 2020.

1
 https://www.bmwi.de/Redaktion/DE/Downloads/A/aktionsplan-gebotszone.pdf?__blob=publicationFile&v=10

 3
Berlin, Dortmund, Bayreuth, Stuttgart, Malmö | Page 4 of 31

 1. LEGAL BACKGROUND

The EU Electricity Market Regulation (EU) 2019/943, which entered into force on 4/7/2019, stipulates that
transmission system operators (TSOs) may not restrict the cross-zonal transmission capacity to eliminate
congestion within a bidding zone. This requirement is considered met if a minimum value of 70% is
achieved for the cross-zonal electricity trading. Specifically, this means that as of 1/1/2020, at least 70% of
 2
the border transmission capacity of borders with NTC capacity calculation and at least 70% of the
transmission capacity of the critical network elements of borders with flow-based capacity calculation (in
consideration of system stability) must be offered for cross-zonal electricity trading (Art. 16(8)).

For Member States that have identified structural grid congestion, the EU Electricity Market Regulation
opens up the possibility of submitting an action plan to reduce this congestion (Art. 15(1)). In this case, the
minimum value for cross-zonal trade capacity is to be raised annually in steps from 1/1/2020 to 31/12/2025
until reaching 70%, starting from the average level of the past three years or the maximum of these years
(Art. 15(2)).

Against this backdrop and after consultation with stakeholders and Member States, the Federal Republic of
Germany submitted the Action Plan Bidding Zone 28/12/2019 to the European Commission (EC) and the
Agency for the Cooperation of Energy Regulators (ACER). The Action Plan Bidding Zone contains concrete
measures by which Germany will counteract the structural congestion described above and raise the
minimum capacity for cross-zonal electricity trading in stages up to 70% by 31/12/2025.

Implementation of an action plan is associated with an obligation to carry out annual evaluations of
compliance with the minimum values for cross-zonal trade capacity by the involved transmission system
operators. The data basis for this evaluation must be approved by the corresponding national regulatory
authority (NRA), in this case the Federal Network Agency for Electricity, Gas, Telecommunications, Post
and Railways (Bundesnetzagentur für Elektrizität, Gas, Telekommunikation, Post und Eisenbahnen;
BNetzA - BNetzA). On this basis, the evaluation must be submitted to the relevant national regulatory
authorities and to ACER (Art. 15(4)). The present report has been produced to meet this obligation by the
control area-managing transmission system operators 50Hertz Transmission GmbH (50Hertz), Amprion
GmbH (Amprion), TransnetBW GmbH (TransnetBW) and TenneT TSO GmbH (TenneT) as well as the
transmission system operator without control area responsibility Baltic Cable AB (BCAB).

2
 NTC (net transfer capacity) refers both to a capacity calculation method for determining border-specific transmission
capacity and to its result.

 4
Berlin, Dortmund, Bayreuth, Stuttgart, Malmö | Page 5 of 31

 2. LINEAR TRAJECTORY OF THE GERMAN ACTION PLAN

In accordance with the Action Plan Bidding Zone, the Federal Ministry for Economic Affairs and Energy
(BMWi) has instructed the German TSOs to calculate the initial values for the linear trajectory pursuant to
Art. 15(2) of the EU Electricity Market Regulation.

 3
Based on the principles for calculating and reporting the initial values provided by the BNetzA , the German
 4 5
TSOs 50Hertz, Amprion, TransnetBW and TenneT have calculated and published the initial values for the
 6
German bidding zone borders and critical network elements. The principles for calculating the initial values
stipulate, amongst other rules, that a common average be calculated and defined as the initial value for all
bidding zone borders and critical network elements that will in future be part of the flow-based market
coupling in the capacity calculation region (CCR) Core (Core FB MC). Starting from this initial value, a
staged linear trajectory of minimum values is to be determined for the intervening years until reaching the
target level of 70% on 31/12/2025. Until implementation of the Core FB MC, the minimum values
determined in this way will be applied within the flow-based market coupling in the Central Western
European region (CWE) and at the NTC borders that will be part of the Core FB MC in the future. An initial
value must be determined and applied for each of the borders in the capacity calculation region Hansa
Germany – Denmark 1 (DE-DK1) and Germany – Denmark 2 (DE-DK2) and for the borders of Germany –
Sweden 4 (DE-SE4) and Germany – Norway 2 (DE-NO2), which were previously not assigned to any
region. The minimum capacities and the linear trajectory will be applied at the border DE-NO2 based on the
general principle of equal treatment and on European competition law. As part of the European Economic
Area (EEA), Norway is treated in this cases as an EU Member State although it is not directly subject to the
Regulation (EU) 2019/943 unless it chooses to adopt this regulation. These calculations result in the
following initial values and the corresponding linear trajectories.

3https://www.bundesnetzagentur.de/DE/Sachgebiete/ElektrizitaetundGas/Unternehmen_Institutionen/HandelundVertrie
b/EuropMarktkopplung/MarketCoupling_node.html
4
 The initial value for the border DE-SE4 was determined by TenneT.
5
 https://www.netztransparenz.de/EU-Network-Codes/CEP-Startwerte
6
 This refers to the Germany-Luxembourg bidding zone. To improve readability, the term “German bidding zone” is
used below.

 5
Berlin, Dortmund, Bayreuth, Stuttgart, Malmö | Page 6 of 31

CCR Core

 Border % of capacity per critical network element (CNE)

 As of
 2020 2021 2022 2023 2024 2025
 31/12/2025
 Core region
 11.5 21.3 31.0 40.8 50.5 60.3 70.0

The minimum remaining available margin introduced for the CWE region in April 2018 (CWE-minRAM) of
20% will continue to apply as before if this is possible without sacrificing system stability.

CCR Hansa

The calculated initial value for the border DE-DK1 yields a minimum capacity of 428 MW according to the
principles of the BNetzA for calculating and reporting the initial values. Obligations from “Commission
Decision of 7/12/2018 […] Case AT.40461 – DE/DK Interconnector” (TenneT’s commitment) regarding a
minimum capacity at the border DE-DK1 remain hereby unaffected.

For the border DE-NO2, the initial value for the linear trajectory applicable for the year 2020 is zero (0)
percent.

The initial value for the border DE-SE4 via the Baltic Cable is 248 MW or 41.4%. The minimum capacity at
the border DE-SE4 will be initially set directly equal to the maximum transmission capacity of the Baltic
Cable of 600 megawatts.

The initial value calculation for the bidding zone border DE-DK 2 has shown that even in the past, when the
border consisted only of the DC interconnector cable Kontek, over 70% of the capacity at this border was
made available for cross-zonal trading. It is therefore unnecessary to calculate an initial value or a linear
trajectory for this border. In this case, the 70% minimum requirement from the EU Electricity Market
Regulation must be complied with immediately as of 1/1/2020. For the new hybrid interconnector Kriegers
Flak Combined Grid Solution (KF CGS) put into operation on 15/12/2020, the European Commission
granted an exception on 11/11/2020 exempting the KF CGS from the 70% capacity requirement. This
allows reservation of a capacity in the amount of the day-ahead feed-in forecast for transporting wind
power to the respective national transmission system. At least 70% of the remaining transmission capacity
must be made available to the market. The BNetzA requirements for calculating the initial value for
interconnectors put into operation after 1/1/2020 also stipulate an initial value of 0% in the first year of
operation. This value is then to be increased in steps each year up to 70% by 31/12/2025. The minimum
value for the border DE-DK2 in 2020 therefore consists of the following components:
 - 0% (increasing in 2021 to 11.7%) of the available transmission capacity of the KF CGS (after
 deducting the forecast offshore wind power feed-in) plus
 - 70% of the available transmission capacity of the Kontek cable.
 6
Berlin, Dortmund, Bayreuth, Stuttgart, Malmö | Page 7 of 31 The following trajectories result from the respective initial values: Border % of capacity per border As of 2020 2021 2022 2023 2024 2025 31/12/2025 DE-SE4 41.4 46.2 50.9 55.7 60.5 65.2 70.0 DE-DK1 23.9 31.6 39.4 47.0 54.6 62.3 70.0 DE-NO2 0 11.7 23.3 35.0 46.7 58.3 70.0 Kontek 70.0 70.0 70.0 70.0 70.0 70.0 DE-DK2 7 70.0 KF CGS 0.0 11.7 23.3 35.0 46.7 58.3 3. MONITORING METHODOLOGY The methodology for monitoring compliance with the minimum values for cross-zonal electricity trading pursuant to the EU Electricity Market Regulation and the stipulations of the BNetzA is described below. The minimum value must be respected by the offered capacity within every market time unit (MTU), in other words every hour, and in both directions. The minimum value defines the minimum capacity to be offered. The offered capacity is also referred to below as the “trade margin”. The trade margin consists of two components. The first is the coordinated trade margin, which represents the offered capacity at the border or borders in question that participate in the capacity coordination. The second is the uncoordinated trade margin. This represents the consequences of the trade capacities offered to other borders not participating in the capacity coordination. The first step of evaluating compliance with the minimum values is based on the capacities offered in the day-ahead capacity calculation. Due to the availability of data and the low electrical influence of far-off borders on German critical network elements in connection with the respective critical contingency combination (CNECs), not all neighbouring borders in Europe are included in the calculation of the uncoordinated trade margin. However, third countries that are not EU members are treated just the same as EU Member States. This ensures a consistent method for calculating the initial values for the German TSOs. 7 The minimum value in percent is applied to the available transmission capacity after deducting the forecast feed-in from the offshore wind farms 7
Berlin, Dortmund, Bayreuth, Stuttgart, Malmö | Page 8 of 31

If the minimum values are not met according to the standard method described above, further special
analysis is required. Additional components of relevance to compliance are then taken into account, such
as offered capacity in the long-term and intraday time-frame as well as capacities reserved for cross-border
balancing power, just like the consideration of other European borders in calculating the uncoordinated
trade margin. Such conclusive compliance evaluations are described in the results section below.

In case the minimum values are not met, an analysis of whether this caused a restriction to cross-border
electricity trading is triggered. Such restrictions are considered situations in which the capacity was fully
utilised and a market price difference remained such that an additional exchange would have been cost-
efficient.

3.1 Core region

As described above in section 2, a common initial value and linear trajectory was calculated for all German
borders that will be part of the Core FB MC in the future. Since a common flow-based approach to capacity
calculation will apply in the future to the CCR Core, the minimum value arising from the initial value and the
linear trajectory must be complied with at every critical network element in connection with the respective
critical contingency combination (CNEC). An NTC method is currently used to calculate the capacity for the
borders of Germany – the Czech Republic and Germany – Poland, while a flow-based method is used for
all borders in the CWE region. Therefore, different technical implementations of the monitoring are applied
and separate descriptions are provided below.

3.1.1 NTC border Germany – Poland and the Czech Republic

The transmission capacity of the bidding zone borders Germany – the Czech Republic and Germany –
Poland is determined by the TSOs 50Hertz, TenneT and CEPS as a combined value DE – PL/CZ based on
the NTC capacity calculation method. The TSOs carry out independent NTC capacity calculations,
exclusively taking into account their CNECs. The lowest result per market time unit (harmonisation)
represents the NTC DE – PL/CZ. Half of this is allocated to the NTC DE-CZ, while the other half remains as
the technical profile DE – PL/CZ. The technical profile capacity is allocated among the two bidding zone
borders DE-CZ and DE-PL based on demand and in accordance with the goal of optimising welfare.
50Hertz treats PL and CZ as a single bidding zone in the capacity calculation for determining the technical
profile. The monitoring method applied by 50Hertz and TenneT is described below.

 8
Berlin, Dortmund, Bayreuth, Stuttgart, Malmö | Page 9 of 31

Calculating the offered trade margin
As described previously in this section, the offered trade margin consists of two components. When
 8
applying an NTC method, only the limiting CNEC is relevant for determining compliance because this
determines the coordinated trade margin in connection with the capacity calculation. The same applies for
the uncoordinated trade margin as well, which is also based solely on the limiting CNEC.

Determining the coordinated trade margin
The coordinated trade margin at the limiting CNEC corresponds to the share of the determined cross-zonal
 9
transmission capacity that induces a load on the limiting CNEC (share calculated via PTDF ). For the
borders DE – PL and CZ, the TSO on the German side provides the limiting CNEC, which contributed the
lower capacity to the harmonisation with CEPS. This capacity is used for calculating the coordinated trade
margin.

Calculating the uncoordinated trade margin
 10
The uncoordinated trade margin at the limiting CNEC corresponds to the load-inducing impact of the
capacities offered at adjacent borders that must be offered for these borders at the limiting CNEC in each
direction (the share is calculated via PTDF). This is accomplished by estimating the capacities offered at
adjacent borders based on the information available at the time of the day-ahead (DA) capacity calculation.
The result is a value for the uncoordinated trade margin per CNEC for each MTU and direction.

TenneT data sources

Parameter Input data Source
Relative trade margin Fmax D2CF CGM
 Internal alternating current (AC) load flow
Coordinated trade margin NTC 11
 calculation based on D2CF-CGM
Coordinated trade margin
 PTDF Internal calculation from D2CF CGM
Uncoordinated trade margin
 Forecasted day-ahead capacity (Art. 11.1 EU
Uncoordinated trade margin NTC Regulation 543/2013) from ENTSO-E
 Transparency Platform

8
 Multiple CNECs may also simultaneously act as limits for a given market time unit.
9
 PTDF (power transfer distribution factors) translate a cross-border exchange into the corresponding load flows at the
CNEC.
10
 Multiple CNECs may also simultaneously act as limits for a given market time unit.
11
 D-2 congestion forecast common grid model (CGM) as per SO GL Regulation Art. 67 and Art. 70.

 9
Berlin, Dortmund, Bayreuth, Stuttgart, Malmö | Page 10 of 31

50Hertz data sources

Parameter Input data Source
Coordinated trade margin Fref, Fmax, PTDF and Internal DC load flow calculation and
 11
 phase shift distribution optimisation based on D2CF-CGM
 factor (PSDF)
Uncoordinated trade margin PTDF DC load flow calculation
Uncoordinated trade margin NTC Forecasted long-term capacity (Art. 11.1 EU
 regulation 543/2013) from ENTSO-E
 Transparency Platform

3.1.2 CWE region

The monitoring method used by the TSOs Amprion, TenneT and TransnetBW in the CWE region is
described below.

Calculating the offered trade margin
The offered trade margin is determined according to the EU Electricity Market Regulation for each critical
network element together with the respective critical contingency combination (CNEC). As described
above, the offered trade margin is the sum of the coordinated and uncoordinated trade margins.
The resulting offered trade margin is given as a percentage. This is calculated as the trade capacity offered
at the CNEC (sum of the coordinated and uncoordinated shares) divided by its physical capacity (Fmax). For
all MTUs, the value for Fmax used in the calculations for compliance monitoring is equivalent to the physical
limit applied in the capacity calculation. In the special case of determining the trade margin at the bidding
zone or control area border, the lower offered capacity of the two participating TSOs applies. When
 12
applying default flow-based parameters (DFPs) due to technical problems in the flow-based capacity
calculation, it is not possible to determine the relative offered trade margin. MTUs where DFPs were
applied are therefore excepted from the compliance evaluation.

Determining the coordinated trade margin
The coordinated trade margin corresponds to at least the remaining available margin (RAM) offered for the
cross-zonal trading within the day-ahead CWE capacity calculation, which is daily published on JAO.eu as
the “virgin flow-based domain”. The actual RAM offered for cross-zonal trading as per the “final flow-based
domain” (also published on JAO.eu) in some cases exceeds the coordinated trade margin described below
since the inclusion of the long-term allocations (LTA inclusion) is not yet taken into account in the virgin
flow-based domain. However, the final flow-based domain cannot be used directly for monitoring. The
inclusion of the long-term allocations takes place in the CWE by substituting virtual CNECs for real CNECs.
The trade margins provided at the virtual CNECs cannot be unambiguously converted to apply to real items
of equipment.

12
 The application of DFPs is an available fall-back option if a technical problem arises with the day-ahead capacity
calculation. The capacity calculation is then suspended and cross-zonal capacities equal to the already allocated long-
term capacities are made available for trading.

 10
Berlin, Dortmund, Bayreuth, Stuttgart, Malmö | Page 11 of 31

As the virgin flow-based domain considers the CWE minRAM of 20%, which for the year 2020 is above the
minimum requirement of the action plan, the long-term allocations are not included by default.

Calculating the uncoordinated trade margin
The influence of the cross-zonal trade capacity offered outside of the CWE region on the respective CNEC
included in the CWE region is determined for calculating the uncoordinated trade margin. Specifically, the
corresponding load-producing PTDFs are multiplied by the respective NTCs to determine the influence of
the NTCs on the respective CNEC.

The individual uncoordinated trade margins of the various NTC border directions are added to determine
the total uncoordinated trade margin of the CNEC.

 = � →
 , ; ≠

This only takes into account borders where the PTDF values are available within the day-ahead CWE
capacity calculation.

Data sources
Parameter Input data Source
 At the time of the respective capacity
 13
 calculation of the day-ahead or,
 14
 alternatively, month-ahead forecasted
 transfer capacity accessed from the
Uncoordinated trade margin NTCs
 ENTSO-E Transparency Platform. If one of
 the two values was unavailable, default
 values based on annual capacities were
 used.
 CWE flow-based common system (partially
Uncoordinated trade margin PTDFs of the CWE CNECs 15
 publicly available at JAO.eu )
 CWE flow-based common system (publicly
Coordinated trade margin RAM 16
 available at JAO.eu )

13
 https://transparency.entsoe.eu/transmission-domain/ntcDay/show
14
 https://transparency.entsoe.eu/transmission-domain/r2/forecastedTransferCapacitiesMonthAhead/show
15
 https://www.jao.eu/marketdata/implicitallocation >> Utility Tool >> Virgin Flow-Based Domain
16
 https://www.jao.eu/marketdata/implicitallocation >> Utility Tool >> Virgin Flow-Based Domain

 11
Berlin, Dortmund, Bayreuth, Stuttgart, Malmö | Page 12 of 31

3.2 Hansa region

As described in section 2, individual initial values and linear trajectories were calculated per bidding zone
border in the CCR Hansa. Because an NTC capacity calculation takes place at all four borders, the values
apply per border.

3.2.1 NTC borders Germany – Denmark 1 and Germany – Norway 2

Until the NordLink interconnector entered into operation, the transmission capacity of the bidding zone
border DE-DK1 was determined based on an NTC methodology. The minimum capacity was directly
applied to the NTC. The uncoordinated trade margin was not taken into account. When NordLink
interconnector entered into operation on 9/12/2020, TenneT’s capacity calculation for the bidding zone
borders DE-DK1 and DE-NO2 was switched to a coordinated NTC method (cNTC). This allows the
individual minimum capacities of the borders to be applied to the respective critical network elements as
minimum trade margins (share of the maximum permissible power flow / of the physical capacity). This
calculation is based on a common grid model (CGM) as per the System Operation Guideline (SOGL) Art.
67 and Art. 70 for each import and export direction and for all MTUs. The individual minimum values were
applied to the trade margins for the first time as of 17/12/2020, however, using the minimum values
applicable for the year 2021. Since different minimum values apply for the borders DE-DK1 and DE-NO2
according to the Action Plan Bidding Zone, the transmission capacities are initially determined based on
the lower trade margin (DE-NO2) in order to determine the transmission capacity of the associated border.
The transmission capacity of the border with the higher minimum margin (DE-DK1) is then determined,
taking into account the previously determined transmission capacity (DE-NO2). The transmission
capacities of the two borders can therefore be determined by different CNECs. The monitoring method
applied by TenneT is described below.

Calculating the offered trade margin
As described above, the offered trade margin consists of two components, the coordinated and
uncoordinated trade margin. When applying an NTC methodology, only the offered trade margins of the
respective limiting CNECs are relevant for determining compliance since only these determine the
respective transmission capacity. Accordingly, the uncoordinated trade margin is also only considered for
the limiting CNECs. Because different minimum values apply for the borders DE-DK1 and DE-NO2 and
different CNECs act as limits, the calculation and monitoring for the borders DE-DK1 and DE-NO2 take
place separately.

Determining the coordinated trade margin
The coordinated trade margin at the limiting CNEC corresponds to the share of the determined
transmission capacities that induces a load on the respective limiting CNEC (calculated based on NTC and
PTDF values). For a cNTC methodology, no coordinated trade margin for a specific border is exclusively
available. This is shared among the participating borders instead. The coordinated trade margin of the

 12
Berlin, Dortmund, Bayreuth, Stuttgart, Malmö | Page 13 of 31

respective border is therefore the sum of the two multiplications of the respective NTC (DE-NO2 and DE-
DK1) and the associated PTDF of the limiting CNEC of the border in question. This calculation is carried
out once for the border DE-NO2 and once for the border DE-DK1 with the respective limiting CNEC and
associated PTDF values. The coordinated trade margin of the respective CNEC therefore results from the
contributions of both transmission capacities (DE-DK1 and DE-NO2).

Calculating the uncoordinated trade margin
The uncoordinated trade margin at the limiting CNEC corresponds to the load-inducing impact of the
capacities offered at adjacent borders that must be offered at the limiting CNEC in each direction (the share
is calculated via PTDF). This is accomplished by estimating the capacities offered at adjacent borders
based on the information available at the time of the day-ahead (DA) capacity calculation. The result is a
value for the uncoordinated trade margin per CNEC for each MTU and direction.

Data sources

Parameter Input data Source
Relative trade margin Fmax Calculation based on nominal
 voltage and Imax from the D2CF
 CGM
 Internal AC load flow calculation
Coordinated trade margin NTC 17
 based on D2CF-CGM
Coordinated trade margin PTDF Internal calculation from D2CF
 CGM
 Forecasted day-ahead capacity
 (Art. 11.1 EU Regulation
Uncoordinated trade margin NTC
 543/2013) from ENTSO-E
 Transparency Platform

3.2.2 NTC border Germany – Denmark 2

The methodology applied by 50Hertz at the border DE-DK2 is described below.
Calculating the offered trade margin
Because only interconnectors with direct current (DC) properties exist at the border DE-DK2 (Kontek cable
and, since 15/12/2020, KF CGS), meaning that no unscheduled load flows occur, only the coordinated
trade margin is to be determined.

Determining the coordinated trade margin
The coordinated trade margin corresponds to the transmission capacity offered at the border according to
the DA capacity calculation. The transmission capacity increased overall when the hybrid interconnector KF
CGS entered into operation on 15/12/2020. The KF CGS connects the grid connections of the German
offshore wind farms Baltic 1 and Baltic 2 to those of the Danish offshore wind farms Kriegers Flak DK,

17
 D-2 congestion forecast common grid model (CGM) as per SO GL Regulation Art. 67 and Art. 70.

 13
Berlin, Dortmund, Bayreuth, Stuttgart, Malmö | Page 14 of 31

thereby establishing an interconnector between Germany and eastern Denmark. This transmission
capacity arises from the total transmission capacity minus the forecasted offshore wind power infeed.

Data sources

Parameter Input data Source
 NTC for the Kontek cable and for KF System management and grid control
Coordinated trade margin
 CGS systems

3.2.3 NTC border Germany – Sweden 4

The transmission capacity of the bidding zone border DE-SE4 is determined by the transmission system
operators Baltic Cable AB, Svenska kraftnät and TenneT. The TSOs carry out independent capacity
calculations. TenneT determines the transmission capacity based on the wind power infeed in the grid of
Schleswig-Holstein Netz AG and the unavailability of network elements of TenneT and Schleswig-Holstein
Netz AG based on a common limit value concept. Baltic Cable AB determines the availability and
restrictions of the Baltic Cable.

The minimum capacity at the border DE-SE4 refers directly to the transmission capacity of the Baltic Cable.
An uncoordinated trade margin is not taken into account. For monitoring of the border DE-SE4, the offered
capacity (receiving side) is compared with the minimum capacity relative to the maximum capacity of the
Baltic Cable (600 MW on the receiving side). Only the operating hours of the cable are considered here
(otherwise, the maximum allowable flow Fmax is equal to zero).

Consideration of the receiving side arises from the fact that the interconnector Baltic Cable is managed with
implicit procurement of power to compensate for transmission losses. The transmission capacities on the
providing side are therefore not exclusively available for cross-border trading since they are also utilised by
the implicitly procured power to cover losses.

TenneT data sources

Parameter Input data Source
Relative trade margin Fmax Operational Handbook of Baltic
 Cable
 Calculation according to the limit
Coordinated trade margin NTC value concept plus load and
 infeed forecasts
 18
Coordinated trade margin Cable unavailability Baltic Cable AB/ Operational
 Handbook of Baltic Cable

18
 The unavailability of individual items of equipment of the Baltic Cable generally leads to a transmittable capacity of 0
MW, meaning that these times are not considered operating hours. If the static VAR compensator fails, however, the
Baltic Cable can still transmit 500 MW, meaning that these times are definitely considered operating hours.

 14
Berlin, Dortmund, Bayreuth, Stuttgart, Malmö | Page 15 of 31

 4. RESULTS

4.1 Core region

4.1.1 NTC border Germany – Poland and the Czech Republic

For the borders DE-PL&CZ, the minimum of 11.5% was complied with for every MTU in 2020. The figure
below shows the relative trade margin as the ratio of offered trade margin to physical transmission capacity
per CNEC and for all MTUs at the borders DE-PL&CZ in the year 2020 for both trade directions.

Figure 1: Relative trade margin DE-PL&CZ [50Hertz and TenneT] year 2020 (minimum value 11.5%)

Figure 1 shows that a trade margin of at least 11.5% with respect to the physical transmission capacity
(Fmax) per limiting CNEC was offered in all MTUs taken into consideration. Because the underlying NTC
values are determined independently of each other for each direction, the directions are differentiated in the
figure. All 8,784 hours of the year 2020 were taken into account for both directions. Because more than one
CNEC per MTU limited the trade margin in the export direction (DE-PL&CZ) in some cases, the depiction of
the export direction is based on 14,364 data points, while the import direction (PL&CZ-DE) is based on
 15
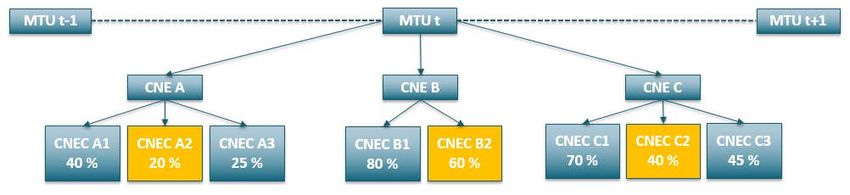
Berlin, Dortmund, Bayreuth, Stuttgart, Malmö | Page 16 of 31

8,784 data points (one CNEC per MTU). In addition to compliance with the minimum value of 11.5% per
limiting CNEC applicable in 2020, Figure 1 also shows that at least a relative trade margin of 70% (trade
margin relative to the physical transmission capacity) was made available at 79.2% of the limiting CNECs
in the export direction and 96.9% in the import direction. In other words, the minimum value that will apply
as of 31/12/2025 was already complied with in these cases.

4.1.2 CWE region

The results of the offered cross-zonal trade margin on the network elements of the CWE region are
depicted below. As described in Art. 16(8)(b) of the EU Electricity Market Regulation for borders with flow-
 19
based capacity allocation , the offered trade margin per critical network element (CNE) is determined in
consideration of the critical contingencies. This method is depicted in Figure 2 and described in more detail
below.

 Figure 2: Example of determining the offered trade capacity per critical network element

Figure 2 shows an example of determining the offered trade capacity per critical network element in
consideration of the critical contingency combinations as per Art. 16 (8) of the EU Electricity Market
Regulation. The percentile values correspond to the offered cross-zonal trade margin relative to the
available physical capacity (Fmax) per CNEC. The CNEC shown in orange defines the minimum offered
trade margin of the respective CNE.

A CNE represents a real physical network element. In the operative capacity calculation process, various
critical contingencies of other network elements are considered in each MTU per CNE. The combination of
CNE and contingency forms a CNEC. The minimum trade margin that can be offered at one CNE is
therefore determined by the CNEC that permits the lowest trade margin. Only the minimum offered trade

19
 See Art. 16(8) of the EU Electricity Market Regulation: “[…] for borders using a flow-based approach, the minimum
capacity shall be a margin set in the capacity calculation process as available for flows induced by cross-zonal
exchange. The margin shall be 70% [Note: For Germany, the target values of the action plan apply here until
31/12/2025] of the capacity respecting operational security limits of internal and cross-zonal critical network elements,
taking into account contingencies, as determined in accordance with the capacity allocation and congestion
management guideline adopted on the basis of Article 18(5) of Regulation (EC) No 714/2009. […]”

 16
Berlin, Dortmund, Bayreuth, Stuttgart, Malmö | Page 17 of 31

 20
margin per CNE is depicted below. One value per CNE therefore enters into the evaluation for each MTU .
This means that the subsequent figures depict only a (critical) subset of the data rather than all data
determined for all CNECs. In a consideration of all CNECs, the relative share would increase even further
with relatively high offered trade margins. The depiction focuses on the relative trade margin, which is
defined as the ratio of offered trade margin to the available physical capacity (Fmax).

Exclusively considering the CNE with the lowest trade margin over the respective region per MTU is
inappropriate because only one value per MTU (of the network element or CNE with the lowest trade
margin) would enter into the depiction. This can theoretically result in the entire evaluation being
determined by a single network element which exhibits continuously low offered trade margins over the
time period in question. CNEs where relatively high trade margins were offered would not be represented in
such an analysis. As described above, this form of representation would also be insufficient for depicting
the requirements of the EU Electricity Market Regulation since the minimum margins for cross-zonal trade
capacity must be complied with at all critical network elements. In addition, such an analysis would also fail
to achieve the monitoring goal of obtaining an overview of all physical network elements and the associated
offered trade margins to allow for any necessary measures to satisfy future minimum requirements at all
network elements.

 21
DFPs were applied on 4/6/2020 (for all 24 hours) due to technical problems in the flow-based capacity
calculation. Due to the lack of data, the MTUs in question were excepted from the compliance evaluation
with respect to the CWE region.

20
 There is no differentiation here of the flow direction through the respective CNE. In other words, the minimum value
is determined based on both flow directions per CNE.
21
 These technical problems were outside the TSO’s sphere of influence.

 17
Berlin, Dortmund, Bayreuth, Stuttgart, Malmö | Page 18 of 31

Amprion control area

 Figure 3: Relative trade margin CWE [Amprion] year 2020 (minimum value 11.5%)

Figure 3 shows the distribution of the offered trade margin on the CNEs of the Amprion control area in
2020. On average, 58 CNEs of the Amprion control area per MTU were included in the CWE capacity
calculation process in the year 2020. This means that about 0.5 million input data points were used to
create the bar chart of Figure 3. The analysis shows that the minimum value according to the linear
trajectory of the Action Plan Bidding Zone for 2020 (11.5%) was complied with at all times on all critical
network elements within the Amprion control area.

The lowest trade margin offered on an Amprion CNE during 2020 was 20.8%, meaning that the minimum
capacity of the action plan of 11.5% was significantly exceeded during every hour. This can be attributed in
particular to the fact that German TSOs continued in 2020 to guarantee the CWE-minRAM of 20% that had
been applied in the CWE region before the start of the Action Plan Bidding Zone.

Further analysis shows that cases in which a relatively low trade margin was offered are locally
concentrated among a relatively small number of network elements. These are primarily transmission lines
in the north-western region of the Amprion control area, which have to bear a high loading during times of
 18
Berlin, Dortmund, Bayreuth, Stuttgart, Malmö | Page 19 of 31

high wind power infeed which needs to be transmitted to the southern European load centres. Providing
additional capacity on these network elements for cross-zonal electricity trading then poses a great
challenge. The currently reduced trade requirements of the linear trajectory defined by the Action Plan
Bidding Zone are required for these particularly impacted network elements.

In November 2020, Amprion and the Belgian transmission system operator Elia put into operation the first
direct electricity interconnection between Germany and Belgium, called “ALEGrO”. As a DC connection,
ALEGrO is embedded in the CWE capacity calculation and allocation via the “evolved flow-based method”.
In contrast to AC transmission lines, ALEGrO is therefore not modelled as a critical network element
 22
(CNE) and is shown separately as a DC border in this context.

 Figure 4: Relative trade margin ALEGrO [Amprion] 18/11 – 31/12/2020 (minimum value 11.5%)

As of 18/11/2020, ALEGrO was made available for CWE day-ahead trading via a ramp-up approach as
part of the planned trial operation. As shown in Figure 4, Amprion offered 100% of the technically possible

22
 However, ALEGrO is taken into account as a critical contingency for other relevant critical network elements.

 19
Berlin, Dortmund, Bayreuth, Stuttgart, Malmö | Page 20 of 31

transmission capacity for cross-zonal trading during every hour (MTU) over the course of the ramp-up
 23
process . The graph was generated based on one value per hour (MTU). The minimum capacity of the
Action Plan Bidding Zone of 11.5% was therefore significantly exceeded at ALEGrO at all times.

In summary, Amprion complied with the statutory requirements for cross-zonal electricity trading pursuant
to Art. 15 and 16 of the EU Electricity Market Regulation at all times during 2020.

TenneT control area

 Relative trade margin CWE [TenneT]
 year 2020
 100%

 90%

 80%

 70%

 60%

 50%

 40%

 30%

 20%

 10%

 0%
 Percentile distribution
 >= 70 % 81.69%
 [50 - 70 %) 9.92%
 [11,5 - 50 %) 8.38%
 < 11,5 % 0.00%

 Figure 5: Relative trade margin CWE [TenneT] year 2020 (minimum value 11.5%)

Figure 5 shows the distribution of the offered relative trade margin at the CNEs of the TenneT control area
in 2020 based on 271,919 values (one value per CNE and MTU). This means that, on average, about 31
CNEs of the TenneT control area were taken into account per MTU in the CWE capacity calculation

23
 From 5/12/2020 to 13/12/2020 and from 24/12/2020 to 31/12/2020, it was already possible to offer the full 1000 MW
nominal output to the electricity market.

 20
Berlin, Dortmund, Bayreuth, Stuttgart, Malmö | Page 21 of 31

process in the year 2020. The minimum value for 2020 (11.5%) according to the linear trajectory of the
Action Plan Bidding Zone was complied with at all critical network elements within the TenneT control area.

The CWE minRAM was suspended in the time period 1/1/2020 to 8/1/2020 due to an application error. As
a result, the analysis of the data according to the standard method (3.1.2 CWE region) shows 187
violations of the minimum during 79 hours (MTU) at a total of 5 critical network elements. However, the
actually offered trade margin always complied with the minimum, as explained below.

For evaluating compliance during the period 1/1/2020 to 8/1/2020, it must be considered that the
uncoordinated margin of the CWE borders typically does not take into account the offered capacity of the
borders DE-DK1, DE-DK2, DE-SE4 and DE-PL, amongst other factors. Because the PTDFs of these
borders are not included in the CWE data set, these are not typically taken into account. The inclusion of
the long-term allocations is also left out of the coordinated trade margin. As a result of these two aspects,
the trade margin actually offered to the market was in some cases considerably above the standard trade
margin as determined for this report.

For this reason, TenneT carried out a supplemental analysis for the time period in question that expanded
both the coordinated and uncoordinated trade margin for this time period with the missing components in
deviation from the general methodology (as per section 3.1.2 CWE region).

The lowest trade margin offered during this time period at a TenneT CNE was 13.47%. Outside of this
period (as of 9/1/2020), the lowest trade margin offered at a TenneT CNE was 20.87%. This can be
attributed in particular to the fact that German TSOs continued in 2020 to guarantee the CWE-minRAM of
20% that applied before the start of the Action Plan Bidding Zone in the CWE region.

 21
Berlin, Dortmund, Bayreuth, Stuttgart, Malmö | Page 22 of 31

TransnetBW control area

 Figure 6: Relative trade margin CWE [TransnetBW] year 2020 (minimum value 11.5%)

Figure 6 shows the distribution of offered relative trade margin in 2020 at the CNEs of the TransnetBW
control area. In the year 2020, the CWE capacity calculation process included 33 CNEs of the TransnetBW
 24
control area. This means that approximately 290,000 values entered into the bar chart of Figure 6 . The
analysis shows that the minimum value according to the linear trajectory of the action plan for 2020 (11.5%)
was complied with at all times at all critical network elements within the TransnetBW control area.

The lowest trade margin offered at a TransnetBW CNE during 2020 was 38.8%, meaning that minimum
capacity of the Action Plan Bidding Zone of 11.5% was significantly exceeded during every hour. This can
be attributed in particular to the fact that German TSOs continued in 2020 to guarantee the CWE-minRAM
of 20% that applied before the start of the Action Plan Bidding Zone in the CWE region.

24
 This corresponds to the 33 included CNEs times the 8,784 hours of the year 2020.

 22
Berlin, Dortmund, Bayreuth, Stuttgart, Malmö | Page 23 of 31

Many CNECs exhibit a high trade margin. In a given hour, a single CNEC with a lower trade margin can be
sufficient to limit the market result. Providing additional capacity at these network elements for cross-zonal
electricity trading then poses a great challenge. The currently reduced trade requirements of the linear
trajectory defined by the Action Plan Bidding Zone are necessary for these particularly impacted network
elements.

4.2 Hansa borders

4.2.1 NTC border Germany – Denmark 1

The applicable minimum capacity for the border DE-DK1 in 2020 of 428 MW (net transfer capacity)
according to the linear trajectory was complied with in the scope of the day-ahead capacity allocation
during every MTU. Thanks to TenneT’s commitment to a minimum capacity of 1300 MW during the entire
year 2020, the minimum capacity was considerably exceeded.

 Figure 7: Trade margin (NTC) DE-DK1 [TenneT] year 2020 (minimum value 428 MW)

 23
Berlin, Dortmund, Bayreuth, Stuttgart, Malmö | Page 24 of 31

4.2.2 NTC border German – Denmark 2

For the border DE-DK2, the respectively applicable minimum value was complied with during every MTU of
2020. The minimum value per border and hour was 70% of the Fmax of the Kontek cable until the KF CGS
entered into operation. After this time, it was determined per hour based on 70% of the Fmax of the Kontek
 25
cable plus 0% of the Fmax of the KF CGS (after deducting the forecasted DA offshore wind power infeed) .
After the KF CGS entered into operation, this results in a minimum value of below 70% in total for the
border DE-DK2, which has to be determined on hourly basis. The following figure shows the actually
 26
offered trade margin relative to the transmission capacity at the border DE-DK2 in the year 2020 .

 Relative trade margin DE-DK2 [50Hertz]
 year 2020
 100%

 90%

 80%

 70%

 60%

 50%

 40%

 30%

 20%

 10%

 0%
 DE-DK2 DK2-DE
 >= 70 % 100.00% 100.00%
 [50 - 70 %) 0.00% 0.00%
 [20 % - 50%) 0.00% 0.00%
 [0 % - 20%) 0.00% 0.00%

 Figure 8: Relative trade margin DE-DK2 [50Hertz] year 2020 (minimum value 70%)

Figure 8 shows that the trade margin amounted to at least 70% of the transmission capacity during all
hours taken into account. Included are 6,244 hours in the export direction and 6,199 in the import direction.

25
 See also section 3.2.2 NTC border DE-DK2 in the monitoring methodology section.
26
 For the sake of simplicity, Figure 8 shows a comparison with 70% and not with the sometimes lower minimum value.

 24
Berlin, Dortmund, Bayreuth, Stuttgart, Malmö | Page 25 of 31

In the remaining hours, no cross-border transmission capacity was available. The hours in 2020 without
cross-border transmission capacity are justified as follows:
 - The planned maintenance of the Kontek cable during the period 31/08 – 18/09 (the interconnector
 must be taken entirely out of operation for maintenance)
 - A subsequent shutdown of the Kontek cable following damage to the cable insulation (the repair
 took until 21/12)
 - Limited availability of the KF CGS due to faults in the cable systems 154 and 151 (belonging to the
 OWF grid connections) as of 17/12 and 19/12, which continued into 2021

4.2.3 NTC border Germany – Norway 2

No minimum capacity applied to the border DE-NO2 during 2020. Figure 9 nevertheless shows the
percentile distribution of the relative trade margin (ratio of the offered trade margin to available physical
capacity (Fmax)) during the operating hours of the NordLink interconnector in 2020.

 Relative trade margin DE-NO2 [TenneT]
 year 2020
 100%

 90%

 80%

 70%

 60%

 50%

 40%

 30%

 20%

 10%

 0%
 NO2-DE DE-NO2
 >= 70 % 3.99% 46.01%
 [50 - 70 %) 42.21% 38.95%
 [20 % - 50%) 53.80% 15.04%
 [0 % - 20%) 0.00% 0.00%

 Figure 9: Relative trade margin DE-NO2 [TenneT] 09/12 – 31/12/2020 (minimum value 0%)

 25
Berlin, Dortmund, Bayreuth, Stuttgart, Malmö | Page 26 of 31

4.2.4 NTC border Germany – Sweden 4

The Baltic Cable, which forms the border DE-SE4, was in operation during 7,748 hours in the year 2020.
The available transmission capacity of the cable was always greater than 70% of the maximum
transmission capacity (Fmax). In the remaining hours, the Baltic Cable was out of operation, meaning that no
cross-border transmission capacity was available. The time periods during which the Baltic Cable was
unavailable are justified by technically necessary planned maintenance work and an instance of cable
damage resulting from an outside influence (29 days and 16 hours in May 2020) (see Figure 10).

 Figure 10: Operating hours of the Baltic Cable in 2020 (time axis in UTC format)

The minimum capacity of the border DE-SE4 of 41.4% was complied with in the south direction (SE4 to
DE) during 7,747 hours (99.99% of the operating hours). In the north direction (DE to SE4), it was complied
with during 5,447 hours (70.3% of the operating hours). With the exception of the last hour of 5/11/2020,
values below the limit occurred only prior to 28/8/2020.

The values below the minimum capacity can be attributed to the special technical connection situation of
the Baltic Cable. The capacity of the Baltic Cable can only be transported by making use of the subordinate
distribution grid of the grid operator Schleswig-Holstein Netz AG. Because the distribution grid is not
designed for providing cross-border transmission capacity, the grid connection of the Baltic Cable was put
into operation under the contractual condition that the transmission capacity of the interconnector can be
temporarily restricted by the connection system operator to prevent or correct overloads caused by the
transmission capacity of the Baltic Cable. Since then, this option has been utilised both preventively within
the framework of the capacity calculation as well as curatively by means of automated protection systems.

Moderated by the BNetzA, the participating parties Baltic Cable AB, Schleswig-Holstein Netz AG and
TenneT have begun investigating options for ensuring compliance with the minimum capacity at the border
DE-SE4. At the level of the transmission system operators, neither grid-related nor market-related
 26
Berlin, Dortmund, Bayreuth, Stuttgart, Malmö | Page 27 of 31

measures of congestion management are available nationally. Consequently, different variants of
countertrading and cross-border redispatch had been investigated with the Swedish transmission system
operator Svenska kraftnät. In the assessment of Svenska kraftnät from the end of 2019, however, SE4
lacks both sufficient liquidity and sufficient generation potential for counter-trading or cross-border
redispatch.

The only option was therefore feed-in management of wind turbines in the grid of Schleswig-Holstein Netz
AG pursuant to §14 of the German Renewable Energy Sources Act. The required process had to be
implemented first and has been available for use only as of 28/8/2020. Failure to heed the capacity
restrictions would have resulted in load flow reductions during operation due to the existing protection
systems, which would have caused power imbalances in Germany and Sweden. In particular, a power
deficit in Sweden would have posed a considerable system stability risk (risk of load shedding). For this
reason, the offered trade capacity of the Baltic Cable had to be temporarily reduced pursuant to Article
16(3) of Regulation (EU) 2019/943 until the process for feed-in management had been worked out and
implemented.

After TenneT and Schleswig-Holstein Netz AG put such a feed-in management process into operation on
28/8/2020, the minimum capacity was consistently met in the normal connection state (availability of all
relevant network elements) because wind turbines could be curtailed as a corrective measure to prevent
the overloading of critical network elements in the connection area of the Baltic Cable.

 27
Berlin, Dortmund, Bayreuth, Stuttgart, Malmö | Page 28 of 31

 Figure 11: Relative trade margin DE-SE4 [TenneT] 1/1 – 27/8/2020 (minimum value 41.4%)

In the time period from 1/1/2020 up to and including 27/8/2020, with a total of 4,957 operating hours,
TenneT failed to meet the minimum capacity exclusively in the north direction (DE to SE4) during 2,301
hours. This was due in particular to transmission congestion in the grid of Schleswig-Holstein Netz AG due
to high infeeding of wind power. Of the 2,301 hours below the minimum in the north direction, only 39 hours
had a limiting effect on the cross-border electricity trading. The cross-border electricity trading is considered
limited when the capacity has been fully utilised and a market price difference remains that is greater than
the implicit costs for procuring the loss amounts [in other words: high price * (1 - loss factor 2.4%) > low
price], such that an additional exchange would have been economical.

 28
You can also read