End of Fire Season Summary - June 2019 - Energy Safe Victoria
←
→
Page content transcription
If your browser does not render page correctly, please read the page content below
End of Fire Season Summary
June 2019
Energy Safe Victoria

This report has been endorsed by the Director of Energy Safety in Victoria.

Authorised and published by the Victorian Government, Melbourne May 2019
© Copyright State of Victoria 2019

You are free to re-use this work under a Creative Commons Attribution 4.0 licence, provided you credit the State of Victoria (Energy Safe Victoria) as author,
indicate if changes were made and comply with the other licence terms. The licence does not apply to any images, photographs or branding, including
Government logos.

Disclaimer: This report uses data available to Energy Safe Victoria (ESV) at the time the report was produced. Data contained in this report may require
updating in light of further investigation of individual incidents or other clarifications that ESV may receive from reporting entities in the future. ESV makes no
warranties whatsoever about the completeness, accuracy or reliability of the data in this report. ESV and its employees accept no responsibility for any loss,
damage, claim, expense, cost or liability whatsoever arising in respect of or in connection with the use of or reliance on this report or the data therein.

ISBN: 978-1-925838-11-4

This document is also available online at www.esv.vic.gov.au

Page 2                                                                                                                                   End of Fire Season Summary
Energy Safe Victoria

Contents                                                          Figures

1.    Introduction                                            5   Figure 1   Summary of CFA fire declarations from 2000-2001 to
                                                                             2018-2019                                                     6
      1.1      Background to the report                       5
                                                                  Figure 2   Progressive roll-out of CFA fire declarations for the
      1.2      Context to the fire danger period              5
                                                                             2018-2019 fire season                                         7
2.    CFA declarations                                        6   Figure 3   Cumulative ground fires across the fire season                9
                                                                  Figure 4   Network-related ground fires per month                        9
3.    Pre-season preparedness                                 8
                                                                  Figure 5   Fire incidents per day                                       10
4.    Analysis of ground fire events                          9   Figure 6   Total fires for each distribution business for the last
                                                                             four fire seasons                                            11
      4.1      Fire statistics                                9
                                                                  Figure 7   All ground fires by size (a) absolute numbers;
      4.1.1    Overall performance                            9              (b) percentage breakdown                                     12
      4.1.2    Ground fires by distribution business         11
                                                                  Figure 8   Locations of all ground fires during the 2018-2019
      4.1.3    Fires by size                                 12
                                                                             season                                                       14
      4.2      Spatial distribution                          13
                                                                  Figure 9   Locations of all ground fires by Bureau of Meteorology
5.    Operational assessment                                 15              district                                                     14
                                                                  Figure 10 HBRA inspection programme results                             15
      5.1      Vegetation clearance                          15
                                                                  Figure 11 Comparison of noncompliance rates between years               17
      5.1.1    Fire season preparedness                      15
      5.1.2    Powercor prosecution                          16   Figure 12 Top 10 worst performing councils in 2018-2019                 17
      5.1.3    Review of the HBRA and LBRA boundaries        16
      5.1.4    HBRA clearing by municipal councils           17
      5.2      Investigation of last season’s fires          18
      5.2.1    The Garvoc (The Sisters) fire investigation   18
      5.2.2    The Terang fire investigation                 18

End of Fire Season Summary                                                                                                             Page 3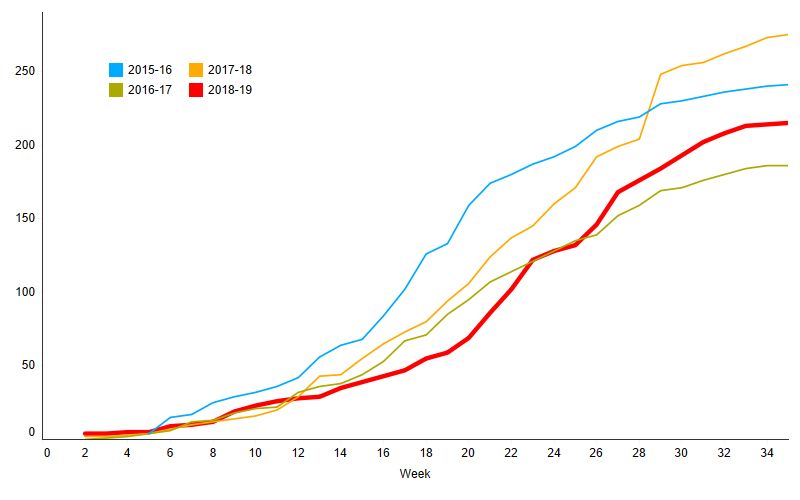
Energy Safe Victoria

Page 4   End of Fire Season Summary
Energy Safe Victoria
1. Introduction
1.1 Background to the report Management of these risks is particularly important in HBRA, which is
more prone to the threat of bushfire: even more so when the CFA has
ESV prepares weekly reports during the fire season that detail the declared a fire danger period for the area.
cumulative and rolling fire incidents on Victoria’s electricity networks, and
the progress of the network operators in undertaking fire mitigation The CFA declares the fire danger period for each shire or municipality in
activities across the networks. Victoria in the lead-up to the fire season. The timing of the declaration
locally depends on the amount of rain, grassland curing rate and other
This summary report provides a context for the 2018-2019 fire season local conditions.
(10 September 2018 to 30 April 2019) compared to previous years, and a
more detailed and holistic view of the fires that occurred throughout the The fire danger period may be declared as early as October in some
season. municipalities, and typically remains in place until the fire danger lessens,
which could be as late as May (see section 2).
1.2 Context to the fire danger period The MECs manage their electricity safety risks during a declared fire
Under Section 80 of the Electricity Safety Act 1998, the Country Fire danger period through their electric line clearance and bushfire mitigation
Authority (CFA) is responsible for assigning fire hazard ratings for those management plans.
areas where the CFA is the responsible fire control authority. Throughout the declared fire danger period, the MECs must meet and
Rural areas are defined as hazardous bushfire risk area (HBRA) by maintain specific targets as described in their electric line clearance and
default, unless otherwise defined as low bushfire risk area (LBRA) by bushfire mitigation management plans. ESV requires that the MECs
the CFA. The CFA periodically reviews and assigns areas a rating based provide data weekly on their progress against these targets; the weekly
on prevailing environmental conditions and land use. fire start report is informed by this data.
The fire hazard ratings are used to prescribe LBRA and HBRA for the Note The electric line clearance regulations are currently under
purpose of the: review and revised regulations will come into force in
June 2020.
• Electricity Safety (Electric Line Clearance) Regulations 2015
• Electricity Safety (Bushfire Mitigation) Regulations 2013.
These regulations place particular obligations on the MECs (and other
regulated entities) to ensure they appropriately mitigate safety risks,
including the risks of fire from trees within the clearance space around
electric lines and poor maintenance of electricity assets.
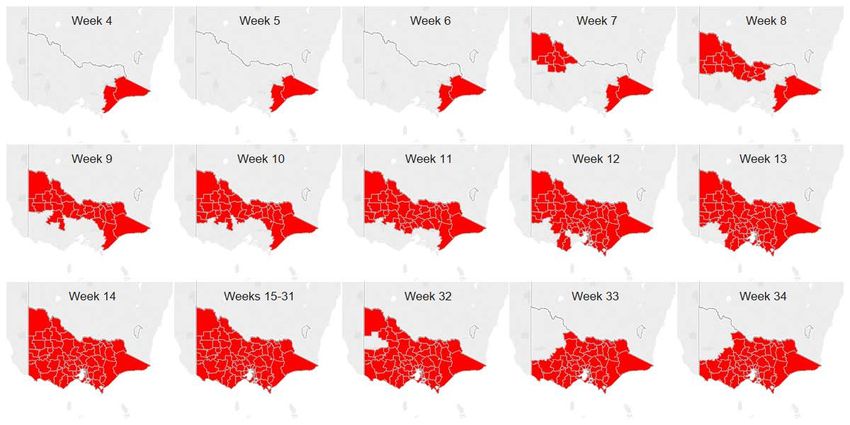
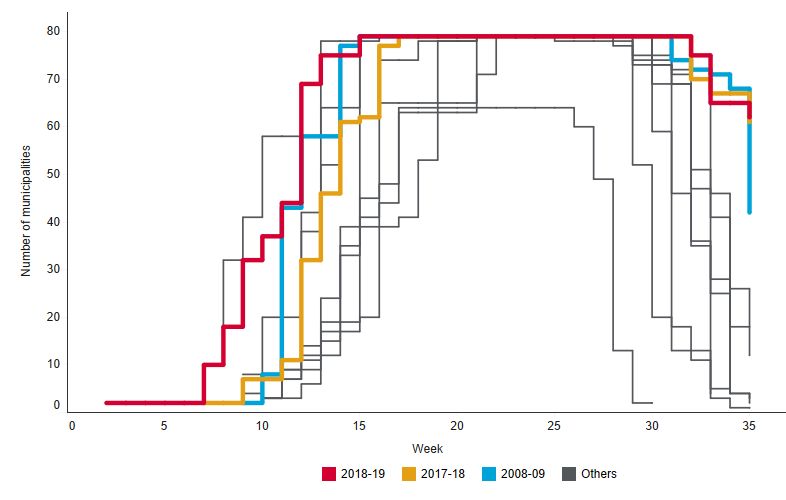
End of Fire Season Summary Page 5Energy Safe Victoria 2. CFA declarations Given that the CFA issues fire declarations for municipalities when ground conditions are curing to a level that they can support grassfires and bushfires, we can use the declarations as an indicator of fire risk. This allows us to compare interannual risks and place the 2018-2019 fire season within a historic context. Figure 1 shows the number of municipalities declared for the current year (bold red line) against last year’s declarations (bold orange line) and the Black Saturday fire season of 2008-2009 (bold blue line). Other fires seasons are shown as grey lines. This year’s season started on 10 September 2018. This was earlier than all previous seasons. Declarations continued ahead of the Black Saturday fire season, and full declaration was achieved at the same time as the Black Saturday season. At the end of the season, full declaration remained in force for longer than previous years. While declarations were initially lifted faster than in 2008-2009, this then plateaued and at 30 April there were still more Figure 1 Summary of CFA fire declarations from 2000-2001 to municipalities under declaration than in previous years. 2018-2019 The indications at the start of the fire season were that 2018-2019 would be a problematic season for fires, and this state of alert persisted across the whole fire season. Like last year, declarations started early in southeast Victoria, but then stalled for several weeks (Figure 2). Declarations then commenced in the northwest and proceeded down along the Murray River — the normal pattern. Once the north of the state was declared, the southern part of the state was progressively infilled, with the southwest to be the last area declared. At the end of the fire season, declarations began to be lifted from the northwest spread across the state from there. Page 6 End of Fire Season Summary
Energy Safe Victoria

                             Figure 2 Progressive roll-out of CFA fire declarations for the 2018-2019 fire season

End of Fire Season Summary                                                                                Page 7
Energy Safe Victoria
3. Pre-season preparedness
Nine major electricity companies (MECs) operate in Victoria to meet the As part of this, ESV undertakes pre-summer asset and line clearance
electricity needs of industry and the community. They are: audits for every business, with locations selected to ensure the audit
covers at least three different local areas. Within each location, a
• AusNet Services (Distribution)
statistically representative sample of assets/spans is selected for
• AusNet Services (Transmission)
inspection using the ABS sampling tool. The sample is chosen this way to
• Basslink
ensure that the results are representative of the wider network.
• CitiPower
• Jemena Where ESV encounters evidence of a potential issue, ESV then
• Powercor determines whether further investigation and/or enforcement action is
• Transmission Operations Australia (TOA) warranted. This will involve analysis of risk maps, incident report data,
• Transmission Operations Australia 2 (TOA 2) previous work practice audits and other field observations. Stakeholder
• United Energy concerns and feedback from the MEC will also be considered. As part of
the investigation, ESV may undertake more detailed sampling to focus on
Failure to operate their electricity networks to acceptably safe standards
a particular geographical area or expand more broadly across the
exposes the community to safety risks such as electrocution, bushfire
network. Alternatively, sampling may be designed to ascertain the
and loss of electricity supply.
influence of asset type, environment, weather or other factors on creating
The extreme conditions over the summer fire danger period elevate these a higher risk of another incident occurring.
risks — they increase the occurrence of electrical incidents and escalate
ESV continues to increase its use of data and analytics to support audit
the severity of impacts of such incidents.
and investigations planning to identify hot-spots or potential failure trends.
In the lead up to and throughout the summer, ESV undertakes a range of
activities to test the effectiveness of the systems and measures used by
the MECs to manage their networks. This allows ESV to ensure that the
MECs are best prepared to operate their networks safely over the fire
danger period and not expose the community to unnecessary risk.
The activities that ESV performs include, but are not limited to, system
and outcomes audits, asset and electric line clearance inspections,
monitoring of MEC asset maintenance and vegetation clearing activities,
and review and analysis of incident and performance data.
Page 8 End of Fire Season SummaryEnergy Safe Victoria
4. Analysis of ground fire events
4.1 Fire statistics
4.1.1 Overall performance
There were 215 ground fires between 10 September 2018 and 30 April
2019. This is 60 fewer fires than the same period in the 2017-2018 fire
season and 26 fewer than 2015-2016; however, there were 29 more fires
this season than in the 2016-2017 season.
Figure 3 shows the cumulative growth in fire numbers across the fire
season. While the 2018-2019 curve leads at the start of the season due
to some early fires, it soon falls behind the previous four years; it is only
in the last week of February (week 25) where the cumulative number of
fires exceeds the relatively quiet 2016-2017 season.
Figure 3 Cumulative ground fires across the fire season
Figure 4 shows the distribution of ground fires by month and Figure 5
shows the distribution by day. This season was generally similar to last
year, with fires primarily occurring in the mid-late season from January to
March (Figure 4). This contrasts with the 2015-2016 season where most
of the fires occurred in December and January.
When we look at fires at the daily level (Figure 5), it is apparent that there
are single or multiple days were there were large numbers of fires in the
2015-2016 and 2017-2018 seasons. An example is the major peak in
2017-2018 associated with the spate of fires in the southwest over the
St Patrick’s Day weekend. The peaks on days of multiple fires were
suppressed in 2018-2019 and more so in 2016-2017.
Understanding the causes behind these peak fire days is the focus of
ongoing work by ESV’s Data and Analytics team. Insights on this have
been reported previously in last year’s End of fire season summary and
the Safety performance report on Victorian electricity networks. Both are
available on the ESV website. Figure 4 Network-related ground fires per month
End of Fire Season Summary Page 9Energy Safe Victoria
St Patrick’s Day weekend
Figure 5 Fire incidents per day
Page 10 End of Fire Season SummaryEnergy Safe Victoria
4.1.2 Ground fires by distribution business Note The size of operating area and number of assets differ
Figure 6 provides a breakdown of the ground fires for each of the significantly between distribution businesses. As such, absolute
distribution businesses over the last four fire seasons. numbers of incidents are not directly comparable between
distribution businesses.
Powercor experienced fewer ground fires this year than in the previous
three seasons. This is a positive result. Statistics on the respective sizes of the various networks can be
found in the annual Safety performance report on Victorian
AusNet Services saw significantly fewer ground fires than last year, but electricity networks available on the ESV website.
more than the previous two seasons. It was the only business that had
more fires this year than in 2015-2016; however, it saw disproportionately
fewer fires in 2015-2016 than the other distribution businesses.
The number of ground fires experienced by the other distribution
businesses this year was similar to last year and lower than 2015-2016.
Figure 6 Total fires for each distribution business for the last four fire seasons
End of Fire Season Summary Page 11Energy Safe Victoria
4.1.3 Fires by size
When the distribution businesses report fires to ESV through OSIRIS,
they are required to classify the size of the ground fire into the following
categories:
• Large more than 10 ha
• Medium 1000 m2 - 10 ha
• Small 10 - 1000 m2
• Localised less than 10 m2
Figure 7 shows the total ground fires in each size category for the last
four fire seasons and the relative occurrence of fires in each category to
the total number of fires. The key findings are:
• the fourteen large fires last year were associated with an isolated
extreme weather event and the numbers of large fires has
significantly reduced this year (a) (b)
• the number of medium-sized fires is at the lowest level in the last
four fire seasons
• small fires continue to fluctuate in absolute numbers but represent
an almost constant 34-39 per cent of all fires
• localised fires also fluctuate in absolute numbers but represent a
consistent and uniformly constant 48-49 per cent of ground fires
across all four seasons
• fires smaller than 1000 m2 account for 82-87 per cent of all fires.
Figure 7 All ground fires by size
(a) absolute numbers; (b) percentage breakdown
Page 12 End of Fire Season SummaryEnergy Safe Victoria
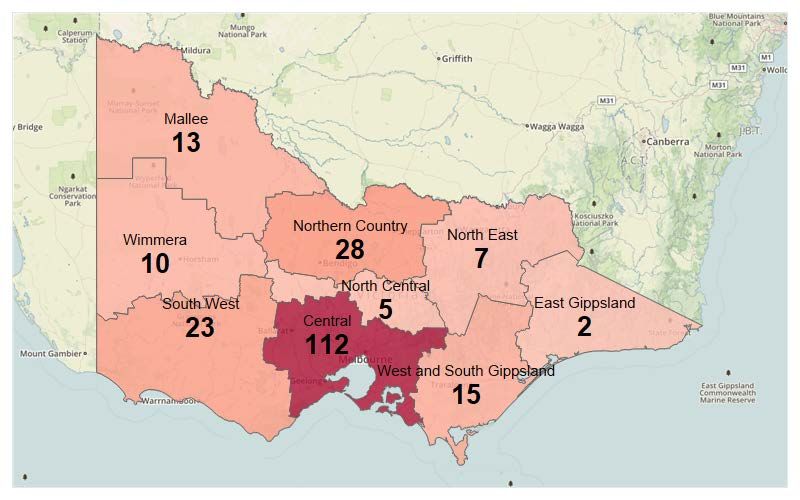
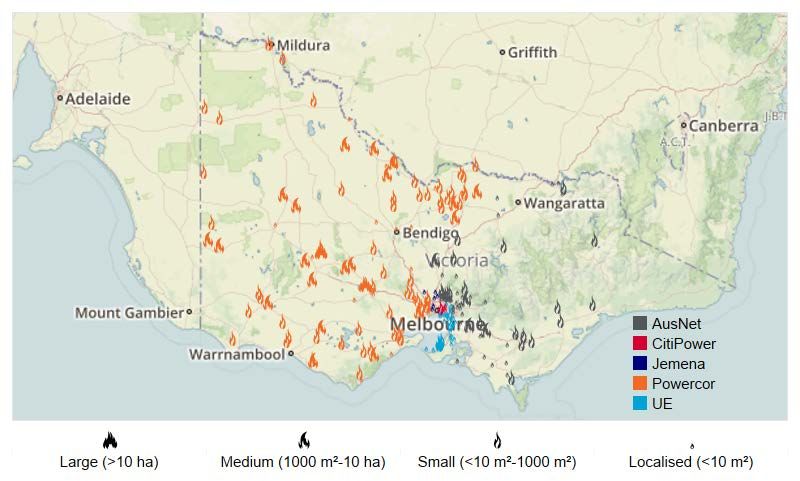
4.2 Spatial distribution Figure 9 presents the aggregated number of ground fires in each Bureau
of Meteorology district. This clearly shows that the bulk of ground fires in
Figure 8 shows the locations of all ground fires during the 2018-2019 fire the state occurred in and around Greater Melbourne, Greater Geelong
season. While there are no clusters of medium-large fires similar to those and Ballarat. This is possibly due to the high network density in those
observed last year, there is still a cluster of fires in LBRA along the areas. The next tier is associated with the Shepparton area, the corridor
Murray River and around Shepparton. This area will be reviewed by the from Melbourne through the Latrobe Valley to Sale, and the Otways
CFA in 2019 to determine whether it should be classified as HBRA. through to Warrnambool.
End of Fire Season Summary Page 13Energy Safe Victoria
Figure 8 Locations of all ground fires during the 2018-2019 season
Figure 9 Locations of all ground fires by Bureau of Meteorology district
Page 14 End of Fire Season SummaryEnergy Safe Victoria
5. Operational assessment
5.1 Vegetation clearance
5.1.1 Fire season preparedness
In the 2018-2019 fire danger period, ESV completed vegetation
inspections for each of the electricity distribution businesses that have
tree clearing responsibilities in HBRA. The purpose of the inspections 12.0%
was to test the outcome of each of the businesses pre-summer electric
line clearance programmes. 10.0%
10.0%
The businesses inspected were AusNet Services, Jemena, Powercor and
United Energy.
8.0%
The Australian Bureau of Statistics sampling methodology was used to
set sample sizes sufficient to provide a minimum 95% confidence that the
6.0%
inspection results would be representative of compliance standards
across the wider network area. A total of 9847 spans were inspected.
The results of the inspection programme are shown in Figure 10. ESV 4.0%
3.1% 3.2%
2.9%
required that all noncompliant vegetation identified be cleared.
1.9%
ESV was satisfied with the clearing standards that had been achieved by 2.0%
AusNet Services, Jemena and Powercor. ESV considered that they were,
as far as practicable, appropriately managing their electric line clearance 0.0%
risks in HBRA. average of AusNet Services Jemena Powercor United Energy
all MECs
The clearing standards achieved by United Energy were not satisfactory;
it was not appropriately managing its electric line clearance risks. This
Figure 10 HBRA inspection programme results
matter is the subject of an ongoing ESV investigation.
To address the concerns formally raised by ESV, United Energy engaged
an independent consultant to review its vegetation clearance practices
and has begun implementing the recommendations of the review. ESV
will monitor these works and ensure noncompliance rates are reduced as
a result.
End of Fire Season Summary Page 15Energy Safe Victoria
5.1.2 Powercor prosecution 5.1.3 Review of the HBRA and LBRA boundaries
In January 2018, three grassfires occurred near the townships of The Electricity Safety (Electric Line Clearance) Regulations seek to
Rochester (6 January 2018), Strathmerton (20 January 2018) and Port mitigate electricity safety risks by excluding vegetation from a
Campbell (28 January 2018). The ESV investigation of these three fires predetermined clearance space around electric lines. The required
concluded that ignition of each fire was most likely caused by tree clearance space is prescribed within the Code of Practice for Electric Line
branches coming into contact with high voltage power lines. Clearance (the code), a schedule to the regulations.
Concerns regarding observations made by ESV when investigating the The code makes a distinction between the clearance spaces required in
fires prompted a broader inspection of vegetation clearances throughout HBRA and LBRA, with the clearances required in HBRA being greater
northern Victoria, extending from Shepparton through to Mildura. due to the increased bushfire threat in these areas. That said, bushfire
Extensive and particularly unsafe noncompliant vegetation was identified risks also exists in certain areas of LBRA throughout Victoria.
by ESV during this inspection process.
The CFA is responsible for assigning LBRA and HBRA where it is the
In July 2018, Powercor was charged for each of the three fires and for designated fire control authority. Historically, it performed cyclic reviews
189 breaches of the Code of Practice for Electric Line Clearance. The of these boundaries; however, this program lapsed in 2013. The
charges for each fire include: boundaries have not been reviewed since then. As a result, areas exist
• Breaching key provisions of the Code of Practice for Electric Line where the assigned fire hazard rating no longer represents the prevailing
Clearance in contravention of section 90 of the Electricity Safety conditions.
Act 1998. Urban development can result in areas currently defined as HBRA being
• Failing to minimise the risks to property from a supply network subsequently classified as LBRA by the CFA.
(section 98(b) of the Electricity Safety Act 1998).
• Failing to comply with a bushfire mitigation plan (section 113B(2) of Conversely, in areas where land use has changed, such as irrigated
the Electricity Safety Act 1998). pasture reverting to dry land farming, the LBRA classification no longer
represents the fire risks that exist and these areas would be better
On 10 April 2019 at the Shepparton Magistrates Court, Powercor pleaded defined and managed as HBRA.
guilty to each of the charges associated with the three fire and a further
51 charges that incorporated the 189 Code breaches. The Magistrate The former may result in higher levels of management being performed
acknowledged the seriousness of the charges but noted that Powercor than are warranted. The latter can result in a greater exposure of the
had pleaded guilty at the earliest opportunity. public to the risk of bushfire as the management standards used do not
align with the risks that prevail.
The Magistrate imposed on Powercor fines of $374,000; consisting of
$200,000 for the line clearance breaches and $58,000 for each of the While the review of fire hazard boundaries is outside of the immediate
three fires. The Magistrate also awarded $165,000 in costs to ESV. remit of ESV, we have engaged with the CFA and MECs and reinstated
the cyclic reviews by the CFA with the work funded by the distribution
Note As indicated by Figure 10, Powercor has shown much improved
businesses. In the future, this will be incorporated into the ESV levy to
behaviour and outcomes this season, with the lowest
ensure ongoing funding for this program.
noncompliance rates of all the distribution businesses.
Page 16 End of Fire Season SummaryEnergy Safe Victoria
Commencing in July 2019, the first year of the review will target the 3.0%
2.7%
Powercor distribution network, including the area in northern Victoria
discussed in Section 5.1.2. 2.5%
2.0%
5.1.4 HBRA clearing by municipal councils
In limited instances across the state, municipal councils are required to 1.5% 1.3%
manage trees on public land in HBRA to ensure they are clear from
electric lines. ESV’s increased resources has allowed it to better 1.0%
understand of how these HBRA spans are being managed by councils.
An inspection program of these areas was completed in the 2017-2018 0.5%
fire danger period; this was repeated in the 2018-2019 season.
0.0%
Where ESV identifies noncompliant vegetation it requires the relevant Noncompliance rate Noncompliance rate
2017-2018 2018-2019
Council to clear it to make it compliant and safe. It must also notify ESV
when the clearing has been completed. Figure 11 Comparison of noncompliance rates between years
In the 2018-2019 fire danger period, ESV observed distinct improvements
in the performance of all councils with HBRA clearing responsibilities; the
average noncompliance find rate across councils inspected dropped by 7.0% 6.6%
more than half (Figure 11).
6.0% 5.5%
average council noncompliance rate
The drop in noncompliance rates can be attributed to the additional
5.0%
resources employed by ESV that have allowed us to increase our 4.3%
3.9%
engagement with councils across the state. Many of these councils were 4.0%
3.2% 3.2% 3.0%
not aware of their vegetation clearance obligations under the Electricity 3.0% 2.6% 2.5% 2.3%
Safety Act; most have responded positively to working with ESV once
aware of these obligations. 2.0%
During the year, there were a number of councils where noncompliance 1.0%
rates were significantly higher than their peers. Figure 12 shows the 0.0%
performance of the ten worst performing councils in the 2018-2019
period. ESV will continue to work with these councils to ensure they
understand and address their line clearance responsibilities.
Figure 12 Top 10 worst performing councils in 2018-2019
End of Fire Season Summary Page 17Energy Safe Victoria
5.2 Investigation of last season’s fires ESV is now undertaking an investigation to determine the nature and
extent of any breaches to the Act or Regulations and the extent of any
During the 17-22 March 2018 period, there were 44 network fires across enforcement action to be taken.
Victoria. Most of the fires occurred on the weekend of 17-18 March when
strong winds came through from the west and combined with Note Further details on this fire can be found in the ESV technical
temperatures close to 40°C. There were further incidents over the investigation report Garvoc Fire (The Sisters) 17 March 2018.
subsequent days as the winds reduced but the temperatures remained
high. 5.2.2 The Terang fire investigation
Of the 44 fires, there were nine large fires (greater than 10 ha), four On 17 March 2018, the high wind event caused a fault on the electrical
medium fires (1,000 m2 to 10 ha), sixteen small fires (10 m2 to 1,000 m2) network and a fire in the Terang area. The fire was found to have
and fifteen localised fires (less than 10 m2). originated at or close to the location of Pole 3 (P3) on the 22 kV Terang
004 feeder (TRG 004) near the intersection of Peterborough Road and
5.2.1 The Garvoc (The Sisters) fire investigation High Street, Terang.
On 17 March 2018, the aforementioned high wind event passed through The ESV technical investigation established the following:
Victoria’s southwest; this caused a fault on the electrical network and a • there was evidence of arcing damage to the P3 22kV overhead
fire in the Terang area. The fire was found to have originated at or close conductors, and four short circuit events occurred on the TRG 004
to the location of a failed pole (pole 4) on the Powercor distribution line between 20:45 and 20:49 AEST
network. The pole was located on the Sparrow Spur line at The Sisters, • the electrical clearances (distances) between the upper and lower
and the fire was known as the Garvoc fire. P3 22kV conductors were not constructed to relevant Australian or
The ESV technical investigation established the following: Powercor Standards
• the Powercor protection system circuit breaker operated as
• Pole 4 structurally failed at the top of the pole stakes causing the expected with the Total Fire Ban settings applied.
upper section of the pole to fall to the ground
• Powercor’s high voltage protection equipment de-energised the line as ESV concluded from its investigations that:
expected. • the most likely source of ignition was molten conductor material
ESV has investigated this incident and has concluded from the falling from clashing and arcing conductors at or around 20:49
engineering analysis of the remaining pole sections that the structural AEST, and the damage to the conductors is consistent with this
failure of Pole 4 was caused by long-term material degradation due to conclusion
decay and termite infestation. This resulted in the development of a • on 17 March 2018, the clearances between the upper and lower
sizeable internal cavity in proximity to the point of failure; this sufficiently P3 22kV conductors were not sufficient to prevent arcing from
reduced the structural strength of the pole such that it could not withstand clashing conductors during the high wind event.
the prevailing wind conditions.
Page 18 End of Fire Season SummaryEnergy Safe Victoria
ESV is now undertaking an investigation to determine the nature and
extent of any breaches to the Act and regulations and the nature of any
consequential enforcement action to be taken.
Note Further details on this fire can be found in the ESV technical
investigation report P3 High Street Terang Electrical Incident
17 March 2018.
End of Fire Season Summary Page 19You can also read