THE EFFECT OF TRAVEL RESTRICTIONS ON THE SPREAD OF THE 2019 NOVEL CORONAVIRUS (2019-NCOV) OUTBREAK - MEDRXIV
←
→
Page content transcription
If your browser does not render page correctly, please read the page content below
medRxiv preprint doi: https://doi.org/10.1101/2020.02.09.20021261. The copyright holder for this preprint (which was not peer-reviewed) is the
                              author/funder, who has granted medRxiv a license to display the preprint in perpetuity.
                                       It is made available under a CC-BY-NC-ND 4.0 International license .

     The effect of travel restrictions on the spread of the 2019
             novel coronavirus (2019-nCoV) outbreak
         Matteo Chinazzi 1 , Jessica T. Davis1 , Marco Ajelli2 , Corrado Gioannini3 ,
          Maria Litvinova3 , Stefano Merler2 , Ana Pastore y Piontti1 , Luca Rossi3 ,
         Kaiyuan Sun4 , Cécile Viboud4 , Xinyue Xiong1 , Hongjie Yu5 , M. Elizabeth
                 Halloran6,7 , Ira M. Longini Jr.8 , Alessandro Vespignani1,3

                                                        February 7, 2020

                                                                Abstract
                 Motivated by the rapid spread of a novel coronavirus (2019-nCoV) in Mainland
             China, we use a global metapopulation disease transmission model to project the im-
             pact of both domestic and international travel limitations on the national and interna-
             tional spread of the epidemic. The model is calibrated on the evidence of internation-
             ally imported cases before the implementation of the travel quarantine of Wuhan. By
             assuming a generation time of 7.5 days, the reproduction number is estimated to be
             2.4 [90% CI 2.2-2.6]. The median estimate for number of cases before the travel ban
             implementation on January 23, 2020 is 58,956 [90% CI 40,759 - 87,471] in Wuhan and
             3,491 [90% CI 1,924 - 7,360] in other locations in Mainland China. The model shows
             that as of January 23, most Chinese cities had already received a considerable number
             of infected cases, and the travel quarantine delays the overall epidemic progression by
             only 3 to 5 days. The travel quarantine has a more marked effect at the international
             scale, where we estimate the number of case importations to be reduced by 80% until
             the end of February. Modeling results also indicate that sustained 90% travel restric-
             tions to and from Mainland China only modestly affect the epidemic trajectory unless
             combined with a 50% or higher reduction of transmission in the community.

     1 Laboratory for the Modeling of Biological and Socio-technical Systems, Northeastern University, Boston, MA USA 2 Bruno
     Kessler Foundation, Trento Italy 3 ISI Foundation, Turin, Italy 4 Fogarty International Center, NIH, USA 5 School of Public
     Health, Fudan University, Key Laboratory of Public Health Safety, Ministry of Education, Shanghai, China6 Fred Hutchinson
     Cancer Research Center, Seattle, WA, USA              7 Department of Biostatistics, University of Washington, Seattle, WA.

     USA 8 Department of Biostatistics, College of Public Health and Health Professions, University of Florida, Gainesville, USA

                                                                      1
medRxiv preprint doi: https://doi.org/10.1101/2020.02.09.20021261. The copyright holder for this preprint (which was not peer-reviewed) is the
author/funder, who has granted medRxiv a license to display the preprint in perpetuity.
It is made available under a CC-BY-NC-ND 4.0 International license .
Starting in December 2019, Chinese health authorities have been closely monitoring a
cluster of pneumonia cases in the city of Wuhan, in Hubei province. It has been determined
that the pathogen causing the viral pneumonia among affected individuals is a new coro-
navirus (2019-nCoV)(1). As of February 7th, 2020, a total of 31,213(2) cases have been
detected and confirmed in Mainland China. Internationally, there are more than 200 ad-
ditional cases detected and confirmed in 23 countries(3). In this work we model both the
domestic and international spread of the 2019-nCoV epidemic. We estimate the effects of
the travel ban implemented in Wuhan and the international travel restrictions adopted by a
number of countries in early February, 2020.
To model the international spread of the 2019-nCoV outbreak we use the Global Epidemic
and Mobility Model (GLEAM), an individual-based, stochastic, and spatial epidemic model
(4; 5; 6; 7). GLEAM uses a metapopulation network approach integrated with real-world
data, where the world is divided into sub-populations centered around major transportation
hubs (usually airports). The subpopulations are connected by the flux of individuals traveling
daily among them. The model includes over 3,200 sub-populations in roughly 200 different
countries and territories. The airline transportation data consider daily origin-destination
traffic flows from the Official Aviation Guide (OAG) and IATA databases (updated 2019),
while ground mobility flows are derived by the analysis and modeling of data collected from
the Offices of Statistics for 30 countries on 5 continents (5). Within each sub-population,
the human-to-human transmission of 2019-nCoV is modeled using a compartmental repre-
sentation of the disease where individuals can occupy one of the following compartments:
Susceptible (S), Latent (L), Infectious (I) and Recovered (R). Susceptible individuals can ac-
quire the virus through contacts with individuals in the infectious compartment, and become
latent, meaning they are infected but can not transmit the disease yet. Latent individuals
progress to the infectious stage with a rate inversely proportional to the latent period (which
we assume to have the same duration as the incubation period), and infectious individuals
progress into the removed stage with a rate inversely proportional to the infectious period.
The sum of the mean latent and infectious periods defines the generation time. Removed
individuals represent those who can no longer infect others, meaning they are recovered,
isolated, hospitalized, or dead.
The model generates an ensemble of possible epidemic scenarios described by the number
of newly generated infections, times of disease arrival in each subpopulation, and the number
of traveling infection carriers. We assume a starting date of the epidemic that falls between
11/15/2019 and 12/1/2019, with 40 cases caused by zoonotic exposure(8; 9). The posterior
distribution of the basic reproductive number R0 is estimated by exploring the likelihood of
importation of 2019-nCoV cases to international locations. We have performed a sensitivity
analysis considering different combinations of average latency and infectious periods, explor-
ing a generation time (Tg ) interval ranging from 6 to 11 days based on plausible ranges from
the SARS epidemic and recent analysis of the 2019-nCoV data (10; 11; 12; 13; 14; 15; 16).
Details and sensitivity analysis are reported in the Supplementary Material. In the following
we report the results for a generation time Tg =7.5 days (12). The obtained posterior distri-
bution provides an average reproductive number R0 = 2.4 [90% CI 2.2-2.6], and a doubling
time measured at Td = 4.6 days [90% CI 4.2-5.1]. The obtained values are in the same
range as previous analyses based on early 2019-nCoV data (12; 17; 18; 19; 20). Although the
calibration obtained for different generation times provides different posterior distributions
2medRxiv preprint doi: https://doi.org/10.1101/2020.02.09.20021261. The copyright holder for this preprint (which was not peer-reviewed) is the
author/funder, who has granted medRxiv a license to display the preprint in perpetuity.
It is made available under a CC-BY-NC-ND 4.0 International license .
for R0 , the overall evolution of the epidemic is determined by the growth rate of infectious
individuals and generates results consistent with those presented here. Results under the
assumptions of a different generation time (Tg = 9), and the presence of mildly symptomatic
individuals not detected internationally are reported in the Supplementary Material.
On January 22, 2020, the projected median number of cases with no travel restrictions
for Mainland China excluding Wuhan is 3,491 [90% CI 1,924-7,360]. The overwhelming
majority of cases are in Wuhan with a median number of 58,956 [90% CI 40,760-87,471].
To analyze the effect of the travel ban within Wuhan, we implemented long-range travel
restrictions beginning on January 23rd and restricted the local commuting flows on January
25th. Initially, we assume no changes in the transmissibility and disease dynamics. The
model output shows no noticeable differences in the epidemic trajectory of Wuhan, while
it shows a delay of about 3 days occurring for other locations in China (see Fig. 1A). The
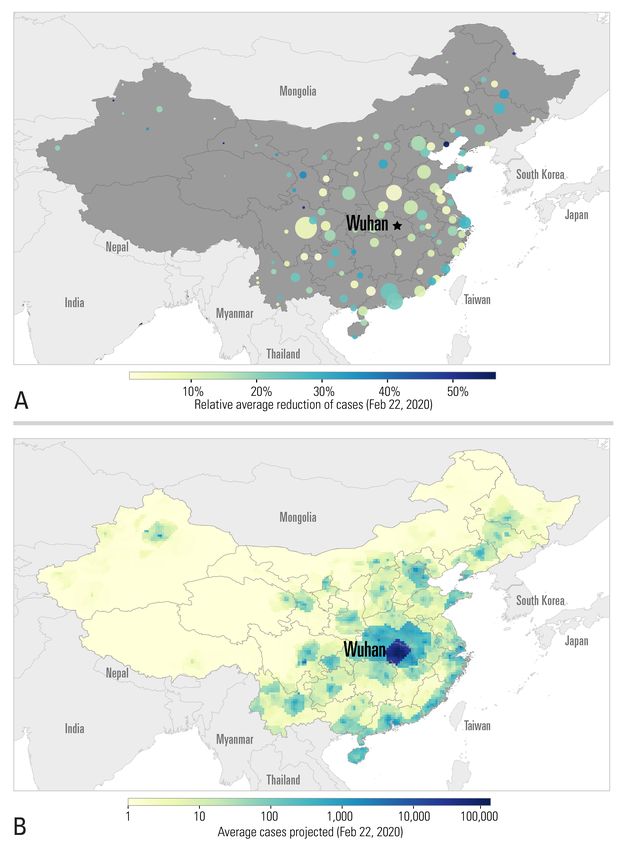
overall reduction of cases in Mainland China excluding Wuhan is close to 20% by Febru-
ary 22, with a relative reduction of cases across specific locations varying in a range from
1% to 57%,(Fig. 2). With a doubling time of approximately 5 days, this level of reduction
corresponds to only a modest delay of the epidemic trajectory of 1 to 6 days. These re-
sults are in agreement with estimates resulting from the combination of epidemiological and
human mobility data (21). The model indicates clearly that as of January 23, 2020, the
epidemic was seeded in several locations across Mainland China. As an independent valida-
tion test, we show in fig 1B) the cumulative number of cases in Mainland China provinces
through February 5, 2020, as reported from DXY.cn, a Chinese online community network
for physicians, health care professionals, pharmacies and healthcare facilities established in
2000 (22; 16), and compare these results with model projections. The model projections are
highly correlated with the observed data (Pearson’s r = 0.77, P < 0.000001), although as
expected we find that there are significantly fewer reported cases than projected (See Fig.
1 B). If we assume that the observed number of cases are the result of different binomial
processes that with a certain probability will determine the actual detection of a case, we
find that the median ascertainment rate of detecting an infected individual in the population
is equal to 19.59% [IQR: 14.36%, 35.58%] in Mainland China. In other words, our model
suggests that surveillance only detects one out of five cases.
The model allows us to estimate the number of case importations in international lo-
cations from Mainland China. We analyze how this number would increase according to
projections in a fully status quo scenario compared to the presence of a travel ban. In
Fig. 1C) we report the mean number of total international importation events in the two
scenarios. We find an 80% reduction in cases imported from Mainland China to other coun-
tries until the end of February. While the number of cases imported internationally initially
has a marked decrease, it picks up again in the following weeks with importation from other
locations in China. The model indicates that after the travel restrictions in Wuhan are
implemented on January 23, the top 5 ranked cities as the origin of international case im-
portations are Shanghai, Beijing, Shenzhen, Guangzhou, and Kunming. Similarly, the model
allows ranking countries across the world according to the relative risk of importing cases
from Mainland China. More precisely the relative risk is defined for each country Y , as the
relative probability P (Y ) that a single infected individual travels from the index areas to that
specific destination Y . In other words, given the occurrence of one exported case, P (Y ) is
the relative probability that the disease carrier will appear in location Y , with respect to any
3medRxiv preprint doi: https://doi.org/10.1101/2020.02.09.20021261. The copyright holder for this preprint (which was not peer-reviewed) is the
author/funder, who has granted medRxiv a license to display the preprint in perpetuity.
It is made available under a CC-BY-NC-ND 4.0 International license .
400,000
Median Cumulative Number of Cases
No travel ban in Wuhan
350,000 r=1.00, Travel Reduction: 0%
300,000 r=0.75, Travel Reduction: 90%
r=0.50, Travel Reduction: 90%
250,000
January 23: Wuhan flight travel ban
200,000
150,000
100,000
50,000
0
A Dec 31, 2019 Jan 7, 2020 Jan 14, 2020 Jan 21, 2020 Jan 28, 2020 Feb 4, 2020 Feb 11, 2020 Feb 18, 2020
Pearson: 0.77 Henan
Hunan
Model Projection (as of February 5)
10 4
Anhui
Guangxi Shanghai Guangdong
Fujian Sichuan
Inner Hainan Yunnan
Mongolia Shandong Jiangxi Zhejiang
10 3 Liaoning Hebei Beijing
Guizhou Chongqing
Shaanxi
Jilin Gansu Shanxi Jiangsu
Heilongjiang
Qinghai Ningxia Tianjin
10 2
10 1 Xinjiang
B 10 2
Actual
10 3
1,000
No travel ban in Wuhan
Travel ban in Wuhan
Number of Imported Cases from China
Observed
100
10
1
C Dec 31, 2019 Jan 7, 2020 Jan 14, 2020 Jan 21, 2020 Jan 28, 2020 Feb 4, 2020 Feb 11, 2020 Feb 18, 2020
Figure 1: A) Trajectory of the 2019-nCoV epidemic in Chinese locations (excluding Wuhan)
under the travel ban to and from Wuhan in effect as of January 23rd, 2020. The lines
represent the median cumulative number of cases while the shaded areas represent the 90%
reference range. B) Number of cases predicted by the model on February 5th as a function
of the number cases observed in individual provinces in China by that date. The size of
the circles are proportional to the population size in each province. C) Projections of the
average total number (daily) of international case importations with and without travel ban
from Wuhan. Observed data of international case importations with a travel history from
Wuhan by arrival date. Shaded areas represent the 99% reference range.
4medRxiv preprint doi: https://doi.org/10.1101/2020.02.09.20021261. The copyright holder for this preprint (which was not peer-reviewed) is the
author/funder, who has granted medRxiv a license to display the preprint in perpetuity.
It is made available under a CC-BY-NC-ND 4.0 International license .
Figure 2: A) Relative reduction of incidence across China as of February 22, 2020. The color
of circles represents the relative reduction in the number of cases, while the size represents
the population in the region. B) Projected cumulative number of cases by the same date,
after implementing travel restrictions in Wuhan.
5medRxiv preprint doi: https://doi.org/10.1101/2020.02.09.20021261. The copyright holder for this preprint (which was not peer-reviewed) is the
author/funder, who has granted medRxiv a license to display the preprint in perpetuity.
It is made available under a CC-BY-NC-ND 4.0 International license .
other possible location. This risk depends on the travel flow from cities in Mainland China
to other countries and the disease prevalence in those cities. It is also worth remarking that
our traffic flows are origin destination data that do not depend on traveling routes, and are
a proxy for the actual mobility demand across cities. In Fig. 3 we provide a visualization of
how each one of the top cities in China contribute to the relative risk of the top 20 countries
at risk of importation for the dates before and after the travel ban in Wuhan was in effect. In
particular, before the travel ban 84% of the internationally imported cases originated from
Wuhan; while after the travel ban, the top 10 contributors to the relative risk are needed
to account for at least ∼ 80% of the internationally imported cases where the top three
contributors are: Shanghai (27.85%), Beijing (14.28%), and Shenzhen (13.68%). In terms
of relative risk of importation, the countries at higher risk of importation after the imple-
mentation of the Wuhan travel ban are: Japan (11.01% pre-travel ban, 13.97% post-travel
ban), Thailand (22.89% pre-travel ban, 12.01% post-travel ban), Republic of Korea (7.48%
pre-travel ban, 11.58% post-travel ban), Taiwan (9.32% pre-travel ban, 9.88% post-travel
ban), and USA (4.66% pre-travel ban, 5.91% post-travel ban).
Starting early February 2020, 59 airline companies suspended or limited flights to Main-
land China and a number of countries including USA, Russia, Australia, and Italy have
also imposed government issued travel restrictions (23; 24; 25; 26; 27; 28). It is difficult to
calculate exactly the level of traffic reduction imposed by these measures. For this reason,
we analyze here two major scenarios in which travel restrictions produce a 40% and 90%
overall traffic reduction to and from China. The same traffic reductions are also applied
domestically in China. Along with travel reductions, we consider three scenarios concern-
ing disease transmissibility: i) a status quo situation with the same transmissibility found
from the model calibration through January 23, 2020; ii) a moderate relative reduction of
the original transmissibility (25%), corresponding to a transmissibility dampening factor of
r = 0.75; and iii) a high reduction (50%) of the original transmissibility (r = 0.50). This
relative reduction of transmissibility could be achieved through early detection and isolation
of cases, as well as behavioral changes and awareness of the disease in the population. In
Fig. 4 we show the combined effects of the travel and transmissibility reductions on the
epidemic incidence in Mainland China and the number of exported cases to other countries.
The simulated scenarios show that even in the case of drastic travel reductions (Fig. 4D), if
tranmissibility is not reduced (r = 1), the epidemic in China is delayed for no more than 2
weeks. The peak of the epidemic in Mainland China is reached at the end of April – early
May, 2020. It is worth remarking that the epidemic peak in Wuhan in the absence of trans-
missibility reductions falls in the first week of March 2020. The number of cases imported to
other countries, Fig. 4A-C, is initially affected by a tenfold reduction, but by March 1st 2020
when there is no transmissibility reduction (r = 1), this number has reached again the levels
of 133 and 22 cases per day for the 40% and 90% travel restrictions scenarios, respectively.
The concurrent presence of both travel and transmissibility reductions, however, produce
a much larger synergistic effect visible by both delaying the epidemic activity in Mainland
China and the number of imported cases. In the moderate transmissibility reduction sce-
narios (r = 0.75) the epidemic peak is delayed to late June 2020 and the total number of
international case importations by March 1st 2020 are 21 and 3 cases per day for the 40%
and 90% travel restrictions scenarios, respectively. Larger travel limitations (> 90%) will
extend the period of time during which the importation of cases is greatly reduced. The
6medRxiv preprint doi: https://doi.org/10.1101/2020.02.09.20021261. The copyright holder for this preprint (which was not peer-reviewed) is the
author/funder, who has granted medRxiv a license to display the preprint in perpetuity.
It is made available under a CC-BY-NC-ND 4.0 International license .
Case Importations
Before Wuhan Travel Ban After Wuhan Travel Ban
Japan
Qingdao
Thailand
Rest of
Mainland Thailand
China
Korea,
Japan Rep.
Taiwan Shanghai Taiwan
Wuhan
USA
Korea,
Rep.
Singapore
Malaysia Malaysia
Shenzhen
Australia Vietnam
Philippines
Zhuhai
USA
Hangzhou Indonesia
Singapore Chongqing Australia
Xiamen Cambodia
Vietnam
Russia
Indonesia UK
Cambodia Beijing Germany
Kunming Canada
UK India
Rest of Main- UAE
land China
Philippines Italy
Hangzhou UAE
Shenzhen Canada Kunming
Zhuhai France France
Xiamen India
Russia
Shanghai Germany Guangzhou
Italy
Guangzhou
Rest of
Beijing
Rest of World
Qingdao World
Figure 3: Contribution to the relative risk of importation of the top 10 Chinese cities (plus
the rest of Mainland China) before and after the Wuhan travel ban. The listed countries
correspond to the top 20 countries at risk of importation. Flows are proportional to the
relative probability that any one imported case will be traveling from a destination to a
target.
7medRxiv preprint doi: https://doi.org/10.1101/2020.02.09.20021261. The copyright holder for this preprint (which was not peer-reviewed) is the
author/funder, who has granted medRxiv a license to display the preprint in perpetuity.
It is made available under a CC-BY-NC-ND 4.0 International license .
r=1.00 r=0.75 r=0.50
Median Number of Imported
Cases from Mainland China
January 23 January 23 January 23
February 1 February 1 February 1
China travel China travel restrictions China travel restrictions
restrictions
A B C
r=1.00
r=0.75
r=0.50
Daily incidence per 1,000 people in China (excluding Wuhan)
D
Figure 4: Analysis of the combined effects of travel and transmissibility reductions on the
epidemic. Median number of imported cases from Mainland China for different dampening
factors of the original transmissibility (r) and travel reductions (TR) A) no transmissability
reduction, TR ∈ {40%, 90%}; B) r = 0.75, TR ∈ {40%, 90%}; C) r = 0.5, TR ∈ {40%,
90%}. Shaded areas represent the 90% confidence interval. D) Incidence in Mainland China
excluding Wuhan for the different scenarios considered in A-C
8medRxiv preprint doi: https://doi.org/10.1101/2020.02.09.20021261. The copyright holder for this preprint (which was not peer-reviewed) is the
author/funder, who has granted medRxiv a license to display the preprint in perpetuity.
It is made available under a CC-BY-NC-ND 4.0 International license .
relative reduction of 50% of the transmissibility (r = 0.5) along with travel restrictions does
delay the epidemic growth in China that never surpasses the daily incidence of 1 case per
1,000 in Mainland China, and the number of imported cases at international destinations
are always in the single digit range. The effect of the transmissibility reduction is visible
also on the short term epidemic curve in Mainland China as shown in Fig. 1, with a drastic
reduction of the growth of the number of cases by February 22, 2020 with respect to the
status quo epidemic curve.
The presented analysis, as all modeling exercises, has a number of limitations and as-
sumptions that are worth considering. The model parameters such as generation time and
incubation period are chosen based on early results on the 2019-nCoV outbreak and prior
knowledge of SARS and MERS coronavirus epidemiology. While we believe that the model
is rather stable to variations in these parameters, more information on the key characteris-
tic of the disease would considerably reduce uncertainties. The transmission and mobility
model does not account, at this stage, for heterogeneities due to age differences in suscep-
tibility and contact patterns. The calibration of the model does not consider correlations
among importations (family travel) and assumes that travel probabilities are homogeneous
across all individuals in the catchment area of each transportation hub. We were not able to
find reliable data sources on the effectiveness of containment measures in place in Mainland
China before Jan 23 (e.g. body temperature screening for departure in Wuhan International
airport) which are thus not included in the model. In the travel restriction scenario we
assume long term enforcement of individual mobility restrictions (travel was restricted until
the end of June 2020). This might not be a feasible nor sustainable policy for such a long
period of time.
Even in presence of the above limitations, the analysis of the Wuhan 2019-nCoV out-
break and the modeling assessment of the effects of travel limitations could be instrumental
to national and international agencies for public health response planning. We show that by
January 23 2020, the epidemic had already spread to other cities within China. The travel
quarantine around Wuhan has only modestly delayed the epidemic spread to other areas of
China. This is in agreement with separate studies on the diffusion of the 2019-nCoV virus
in China (29; 21; 30). The model indicates that while the Wuhan travel ban was initially
effective at reducing international case importations, the number of cases observed outside
China will resume its growth after 2-3 weeks from cases that originated elsewhere. Further-
more, the modeling study shows that additional travel limitations up to 90% of the traffic
have a modest effect unless paired with public health interventions and behavioral changes
that achieve a considerable reduction in the disease transmissibility (31). The above results
provides data with potential uses for the definition of optimized containment schemes and
mitigation policies that includes the local and international dimension of the 2019-nCoV
epidemic.
Acknowledgements. MEH acknowledge the support of the MIDAS-U54GM111274. SM
and MA acknowledge support from the EU H2020 MOOD project. CG and LR acknowl-
edge support from the EU H2020 Icarus project. The findings and conclusions in this study
are those of the authors and do not necessarily represent the official position of the fund-
ing agencies, the National Institutes of Health or U.S. Department of Health and Human
Services.
9medRxiv preprint doi: https://doi.org/10.1101/2020.02.09.20021261. The copyright holder for this preprint (which was not peer-reviewed) is the
author/funder, who has granted medRxiv a license to display the preprint in perpetuity.
It is made available under a CC-BY-NC-ND 4.0 International license .
References
[1] World Health Organization, Novel Coronavirus – China, https://www.who.int/csr/
don/12-january-2020-novel-coronavirus-china/en/ (2020). [Online; accessed 17-
January-2020].
[2] The Center for Systems Science and Engineering, Wuhan coronavirus Global
Cases, https://gisanddata.maps.arcgis.com/apps/opsdashboard/index.html#
/bda7594740fd40299423467b48e9ecf6 (2020). [Online; accessed 31-January-2020].
[3] World Health Organization, Novel Coronavirus – China, https://www.who.int/docs/
default-source/coronaviruse/situation-reports/20200204-sitrep-15-ncov.
pdf?sfvrsn=88fe8ad6_2 (2020). [Online; accessed 04-February-2020].
[4] D. Balcan, et al., Proceedings of the National Academy of Sciences 106, 21484 (2009).
[5] D. Balcan, et al., Journal of Computational Science 1, 132 (2010).
[6] M. F. Gomes, et al., PLoS Current Outbreaks 6 (2014).
[7] Q. Zhang, et al., Proceedings of the National Academy of Sciences 114, E4334 (2017).
[8] A. Rambaut, Phylogenetic analysis of nCoV-2019 genomes, http://virological.org/
t/phylogenetic-analysis-of-23-ncov-2019-genomes-2020-01-23/335(2020).
[Online; accessed 05-February-2020].
[9] Natsuko Imai, Anne Cori, Ilaria Dorigatti, Marc Baguelin, Christl A. Don-
nelly, Steven Riley, Neil M. Ferguson,Report 3: Transmissibility of 2019-nCoV
, https://www.imperial.ac.uk/mrc-global-infectious-disease-analysis/
news--wuhan-coronavirus/ (2020). [Online; accessed 05-February-2020].
[10] J. A. Backer, D. Klinkenberg, J. Wallinga, medRxiv
doi.org/10.1101/2020.01.27.20018986 (2020).
[11] C. Huang, et al., The Lancet. doi.org/10.1016/S0140-6736(20)30183-5 (2020).
[12] Q. Li, et al., New England Journal of Medicine. doi:10.1056/NEJMoa2001017 (2020).
[13] M. Lipsitch, et al., Science 300, 1966 (2003).
[14] S. Riley, et al., Science 300, 1961 (2003).
[15] M. Kraemer, D. Pigott, Epidemiological Data from the nCoV-2019 Out-
break: Early Descriptions from Publicly Available Data, http://virological.org/t/
epidemiological-data-from-the-ncov-2019-outbreak-early-descriptions-from-publicly-available-data/337
(2020). [Online; accessed 05-February-2020].
[16] K. Sun, J. Chen, C. Viboud, medRxiv. doi.org/10.1101/2020.01.31.20019935 (2020).
[17] J. Riou, C. L. Althaus, Eurosurveillance 25,4 (2020).
10medRxiv preprint doi: https://doi.org/10.1101/2020.02.09.20021261. The copyright holder for this preprint (which was not peer-reviewed) is the
author/funder, who has granted medRxiv a license to display the preprint in perpetuity.
It is made available under a CC-BY-NC-ND 4.0 International license .
[18] S. Zhao, et al., International Journal of Infectious Diseases.
doi.org/10.1016/j.ijid.2020.01.050 (2020).
[19] J. M. Read, J. R. Bridgen, D. A. Cummings, A. Ho, C. P. Jewell, medRxiv.
doi.org/10.1101/2020.01.23.20018549 (2020).
[20] N. Imai, et al., Report 3: Transmissibility of 2019-nCoV.https://www.
imperial.ac.uk/media/imperial-college/medicine/sph/ide/gida-fellowships/
Imperial-2019-nCoV-transmissibility.pdf (2020). [Online; accessed 5-February-
2020].
[21] H. Tian, et al., medRxiv. doi.org/10.1101/2020.01.30.20019844 (2020).
[22] Epidemiological Data from the nCoV-2019 Outbreak, https://ncov.dxy.cn/ncovh5/
view/pneumonia (2020). [Online; accessed 05-February-2020].
[23] New York Times, North Korea Bans Foreign Tourists Over Coronavirus,
Tour Operator Says, https://www.nytimes.com/2020/01/21/world/asia/
coronavirus-china-north-korea-tourism-ban.html (2020). [Online; accessed
04-February-2020].
[24] CNA, Scoot cancels flights to China’s Wuhan over virus out-
break, https://www.channelnewsasia.com/news/singapore/
wuhan-virus-scoot-cancels-flights-mtr-train-12309076 (2020). [Online;
accessed 04-February-2020].
[25] Toui tre News, Vietnam aviation authority ceases all flights to and
from coronavirus-stricken Wuhan, https://tuoitrenews.vn/news/business/20200124/
vietnam-aviation-authority-ceases-all-flights-to-and-from-coronavirusstricken-wuhan/52707.html (2020).
[Online; accessed 04-February-2020].
[26] Reuters, Russia ramps up controls, shuts China border crossings
over virus fears, https://www.reuters.com/article/us-china-health-russia-border/
russian-regions-in-far-east-close-border-with-china-amid-coronavirus-fears-tass-idUSKBN1ZR0TU (2020).
[Online; accessed 04-February-2020].
[27] Center for Disease Control, Novel Coronavirus in China, https://wwwnc.cdc.gov/
travel/notices/warning/novel-coronavirus-china (2020). [Online; accessed 04-
February-2020].
[28] The Australian, ”Travelers from China to be denied entry to Aus-
tralia, https://www.theaustralian.com.au/subscribe/news/1/?sourceCode=
TAWEB_WRE170_a&dest=https%3A%2F%2Fwww.theaustralian.com.au%2Fnation%
2Ftravellers-from-china-to-be-denied-entry-into-australia%2Fnews-story%
2F7b7619d44af78dd7395a934e22b52997&memtype=anonymous&mode=premium (2020).
[Online; accessed 04-February-2020].
[29] J. T. Wu, K. Leung, G. M. Leung, The Lancet doi.org/10.1016/S0140-6736(20)30260-9
(2020).
11medRxiv preprint doi: https://doi.org/10.1101/2020.02.09.20021261. The copyright holder for this preprint (which was not peer-reviewed) is the
author/funder, who has granted medRxiv a license to display the preprint in perpetuity.
It is made available under a CC-BY-NC-ND 4.0 International license .
[30] Z. Du, et al., medRxiv . doi.org/10.1101/2020.01.28.20019299 (2020).
[31] J. M. Drake, S. K. Chew, S. Ma, PloS one 1 e20 (2006).
12You can also read