Pathway Analysis of a Transcriptome and Metabolite Profile to Elucidate a Compensatory Mechanism for Taurine Deficiency in the Heart of Taurine ...
←
→
Page content transcription
If your browser does not render page correctly, please read the page content below
J     Multidisciplinary
                 Scientific Journal

Article
Pathway Analysis of a Transcriptome and Metabolite
Profile to Elucidate a Compensatory Mechanism for
Taurine Deficiency in the Heart of Taurine Transporter
Knockout Mice
Takashi Ito 1, * , Shigeru Murakami 1 and Stephen Schaffer 2
 1    Faculty of Biotechnology, Fukui Prefectural University, Fukui 910-1195, Japan; murakami@fpu.ac.jp
 2    College of Medicine, University of South Alabama, Mobile, AL 36688, USA; sschaffe@southalabama.edu
 *    Correspondence: tito@fpu.ac.jp; Tel.: +81-776-61-6000

 Received: 25 July 2018; Accepted: 25 August 2018; Published: 27 August 2018

 Abstract: Taurine, which is abundant in mammalian tissues, especially in the heart, is essential for
 cellular osmoregulation. We previously reported that taurine deficiency leads to changes in the levels
 of several metabolites, suggesting that alterations in those metabolites might compensate in part for
 tissue taurine loss, a process that would be important in maintaining cardiac homeostasis. In this
 study, we investigated the molecular basis for changes in the metabolite profile of a taurine-deficient
 heart using pathway analysis based on the transcriptome and metabolome profile in the hearts of
 taurine transporter knockout mice (TauTKO mice), which have been reported by us. First, the genes
 associated with transport activity, such as the solute carrier (SLC) family, are increased in TauTKO
 mice, while the established transporters for metabolites that are elevated in the TauTKO heart,
 such as betaine and carnitine, are not altered by taurine deficiency. Second, the integrated analysis
 using transcriptome and metabolome data revealed significant increases and/or decreases in the
 genes involved in Arginine metabolism, Ketone body degradation, Glycerophospholipid metabolism,
 and Fatty acid metabolism in the KEGG pathway database. In conclusion, these pathway analyses
 revealed genetic compensatory mechanisms involved in the control of the metabolome profile of the
 taurine-deficient heart.

 Keywords: taurine; osmoregulation; metabolomics; transcriptomics; pathway analysis

1. Introduction
      Taurine is abundant in mammalian tissue, especially in excitable tissues, such as the heart.
Taurine functions as a compatible organic osmolyte, thereby assisting in the regulation of intracellular
osmotic balance as well as betaine (also called glycine betaine), glycerophosphocholine (GPC), sorbitol,
free amino acids, etc. [1]. Taurine also possesses various cellular actions, such as modulation of ion
movement and calcium handling [2]. Maintenance of certain species, such as cats, on a taurine-deficient
diet leads to development of dilated cardiomyopathy [3]. We previously demonstrated that knocking
out the taurine transporter (TauT; Slc6a6) of mice (TauTKO mice) also caused a taurine-deficient
cardiomyopathy characterized by ventricular wall thinning and induction of heart failure marker
genes [4]. Despite the severe depletion of taurine (less than 1% of wild-type mice), cardiac output is
normal in the young animal although it declines with age. Moreover, the decrease in longevity is not
severe (median lifespan is about 18 months) [4–6]. The mild condition of the TauTKO phenotype may
relate to homeostatic mechanisms that compensate for detrimental effects caused by taurine depletion.
      Warskulat et al. reported that some amino acids, including alanine, glutamine, and glutamate,
accumulate in the heart of TauTKO mice [7], which may be caused by a compensatory event associated

J 2018, 1, 57–70; doi:10.3390/j1010007                                         www.mdpi.com/journal/jjournal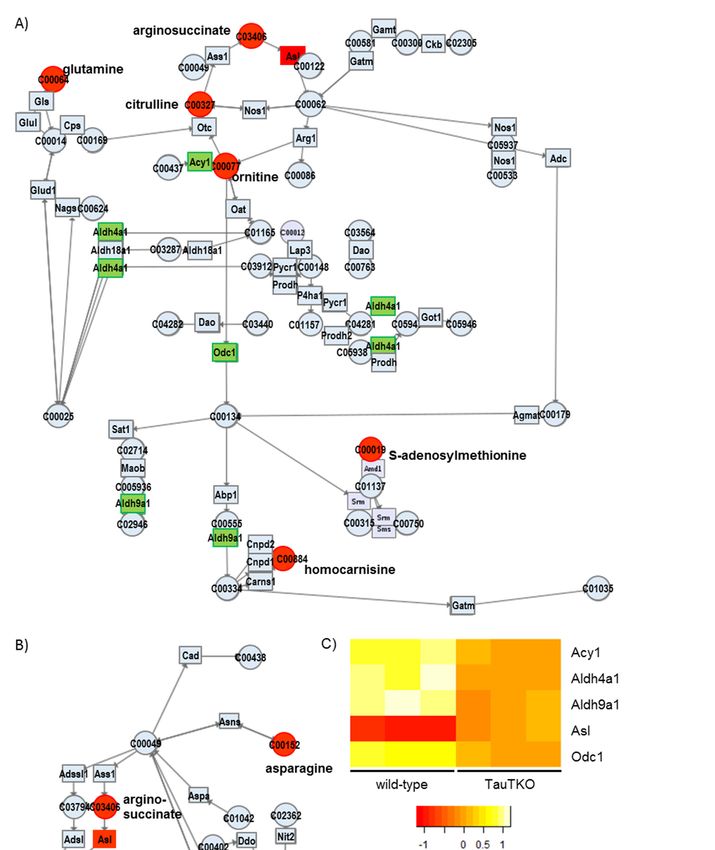
J 2018, 1                                                                                                     58

with taurine loss. We previously performed LC-MS-based metabolome analysis in TauTKO mice to
comprehensively analyze the changes in metabolites [8] and observed increases in organic osmolytes,
such as betaine, GPC, and amino acids. These observations imply the importance of metabolic control
of organic osmolytes in providing protection to the stressed heart.
      In the present study, we investigated the genetic mechanisms involved in taurine-depletion-induced
metabolome changes of the TauTKO mouse that could contribute to compensation for disturbances of
cellular osmoregulation.

2. Materials and Methods

Pathway Analysis
     The online databases DAVID 6.8 (http://david.ncifcrf.gov/home.jsp) [9] and MetaboAnalyst
4.0 (http://www.metaboanalyst.ca/MetaboAnalyst/faces/home.xhtml) [10] were employed for the
enrichment and pathway analysis. The transcriptome profile and metabolite profile data used in
this analysis have been reported previously [8,11]. For transcriptome analysis, hearts isolated from
3-month-old male TauTKO mice and wild-type mice (n = 3) were subjected to cDNA microarray
(SurePrint G3 Mouse Gene Expression 8 × 60 K arrays (Agilent Technologies, Santa Clara, CA,
USA)) [11]. For metabolome analysis, hearts isolated from 3-month-old male TauTKO mice and
wild-type mice (n = 4) were subjected to LC-MS-based metabolome analysis [8]. The transcriptome
data set used in the pathway analyses consists of the genes that change more than 1.5-fold and have a
False Discovery Rate (FDR) that is less than 0.1. The metabolome data set used in the analysis consists
of the metabolites that have a variable importance in projection (VIP) score calculated by partial least
squares discriminant analysis (PLS-DA) greater than 1 (reported in reference 8) and/or a p value
calculated by Mann–Whitney U test less than 0.05. A list of the metabolites used in the pathway
analysis is shown in Table 1. Since increases in acyl-carnitine and acetyl-carnitine content of the heart
may be related to the accumulation of acyl-coenzyme A (CoA) and acetyl-CoA, these were listed as
they also reflect changes in acyl-carnitine. For the metabolites that were undetectable in either TauTKO
heart or wild-type heart in the previous metabolome analysis, fold-change (FC) values were filled with
10 (increased in TauTKO) or −10 (decreased in TauTKO) for data analysis since the highest value of
fold change is 9.2 (Betaine).

      Table 1. Metabolites significantly changed in the heart of taurine transporter knockout (TauTKO) mice
      compared to wild-type mice.

                             Metabolite                        HMDB            KEGG           FC
                      S-Adenosylmethionine                 HMDB0001185         C00019       >10 *1
                        Argininosuccinate                   HMDB00052          C03406       >10 *1
                          L -Pyroglutamate                  HMDB00267          C01879       >10 *1
                                 Betaine                    HMDB00043          C00719        9.2
                              Stachydrine                   HMDB04827          C10172        5.9
                                 Ornitine                  HMDB0000214         C00077        5.4
                              L -Histidine                  HMDB00177          C00135        3.9
                         L -Homocarnosine                   HMDB00745          C00884        3.7
                                 L -Serine                  HMDB00187          C00065        3.3
                            Acetylcholine                   HMDB00895          C01996        3.2
                             L -Asparagine                  HMDB00168          C00152        3.1
                              L -Citrulline                 HMDB00904          C00327        2.9
                           Acetylcarnitine                  HMDB00201          C02571        2.8
                             L -Glutamine                   HMDB00641          C00064        2.7
                        Acyl (8:0)-carnitine               HMDB0000791         C02838        2.4
                           Acetylcarnitine                  HMDB00201          C02571        2.3
                      Glycerophosphocholine                 HMDB00086          C00670        2.3
                         Porphobilinogen                    HMDB00245          C00931        2.2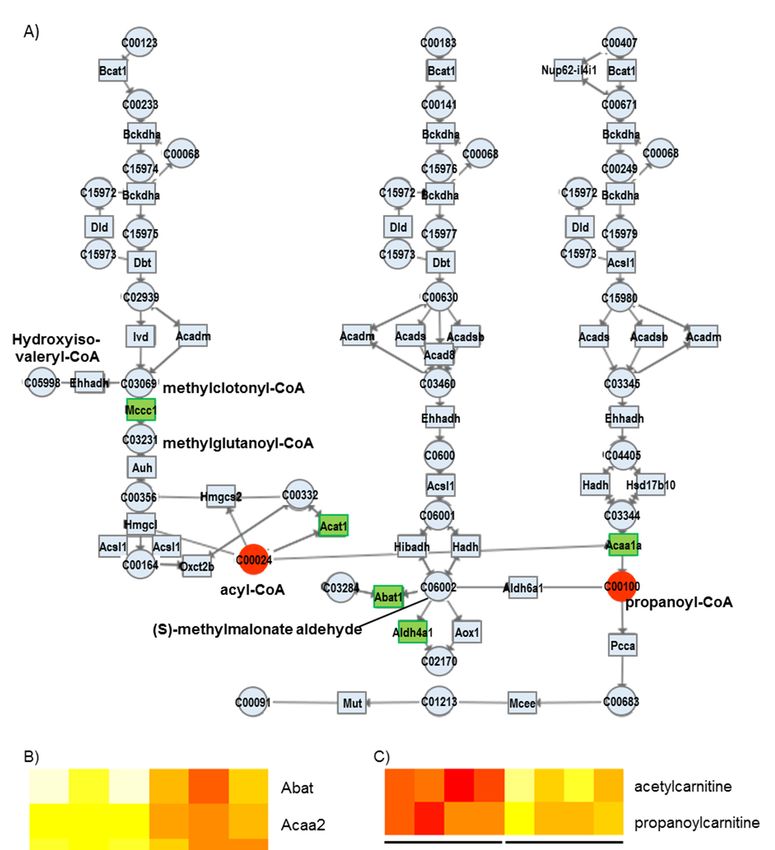
J 2018, 1                                                                                                                       59

                                                         Table 1. Cont.

                                 Metabolite                              HMDB               KEGG             FC
                               Isocitrate                             HMDB00193             C00311          2.2
                            Butylcarnitine                            HMDB00201             C02571          2.1
                           Hexanylcarnitine                          HMDB0000756                            2.1
                              L -Carnitine                            HMDB00062             C00318           2
                          Propioylcarnitine                          HMDB0000824            C03017          1.9
                                Tyrosine                             HMDB0000158            C00082          1.7
                              Adenosine                              HMDB0000050            C00212         −1.4
                             CDP-choline                             HMDB0001413            C00307         −1.7
                        Glycerol 1-phosphate                          HMDB00126             C00093         −2.4
                              Glutaurine                             HMDB0004195            C05844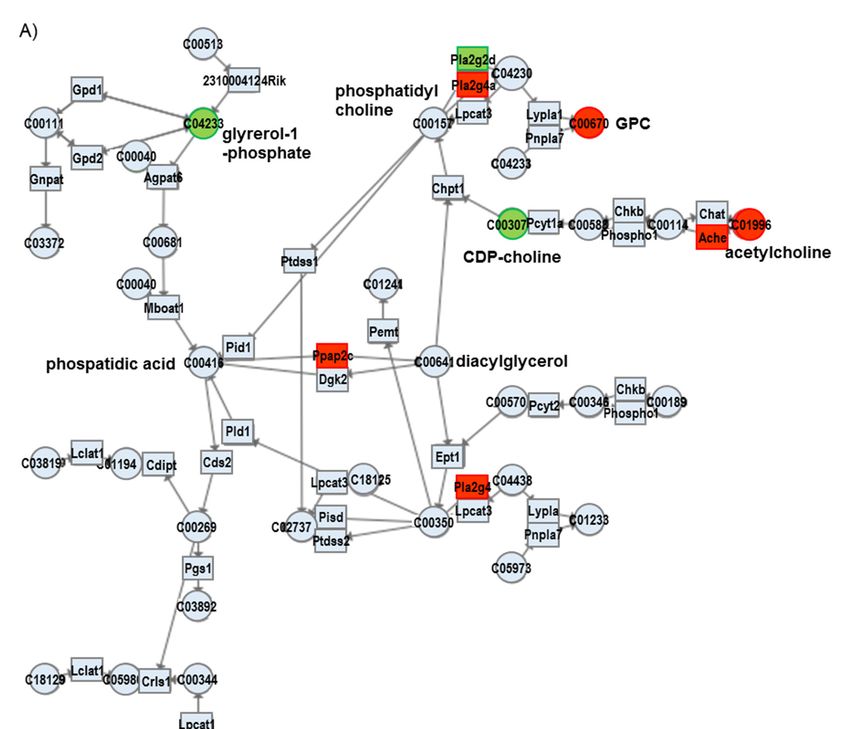
J 2018, 1                                                                                                                60

                            Table 3. Increased genes in GO:0015293~symporter activity.

    Gene Symbol                                                 Gene Name
        Slc1a2         solute carrier family 1 (glial high affinity glutamate transporter), member 2
       Slc10a7         solute carrier family 10 (sodium/bile acid cotransporter family), member 7
       Slc16a12        solute carrier family 16 (monocarboxylic acid transporters), member 12
       Slc17a7         solute carrier family 17 (sodium-dependent inorganic phosphate cotransporter), member 7
       Slc24a5         solute carrier family 24, member 5
       Slc38a2         solute carrier family 38, member 2
       Slc38a4         solute carrier family 38, member 4
       Slc6a17         solute carrier family 6 (neurotransmitter transporter), member 17
        Slc6a1         solute carrier family 6 (neurotransmitter transporter, gamma-aminobutyric acid (GABA), member 1
        Slc6a9         solute carrier family 6 (neurotransmitter transporter, glycine), member 9
        Slc6a6         solute carrier family 6 (neurotransmitter transporter, taurine), member 6

            Table 4. Increased genes in GO:0015171~amino acid transmembrane transporter activity.

            Gene Symbol                                         Gene Name
                   Pdpn                                         podoplanin
                  Slc38a2                           solute carrier family 38, member 2
                  Slc38a4                           solute carrier family 38, member 4
                  Slc6a17          solute carrier family 6 (neurotransmitter transporter), member 17
                  Slc7a4        solute carrier family 6 (neurotransmitter transporter, GABA), member 1

                       Table 5. GO terms enriched in the decreased gene set in TauTKO mice.

                              Term                               Count        %       p Value        Benjamini
         GO:0004364~glutathione transferase activity                6         1.9     0.000049          0.018
        GO:0005244~voltage-gated ion channel activity               8         2.5      0.0014            0.23
               GO:0003824~catalytic activity                        15        4.7      0.0025           0.28

                            Table 6. Decreased genes in GO:0003824~catalytic activity.

                    Gene Symbol                                   Gene Name
                        Bdh1                    3-hydroxybutyrate dehydrogenase, type 1
                        Abat                        4-aminobutyrate aminotransferase
                       Pfkfb1             6-phosphofructo-2-kinase/fructose-2,6-biphosphatase 1
                      Cdk5rap1                CDK5 regulatory subunit associated protein 1
                        Acat1                     acetyl-Coenzyme A acetyltransferase 1
                       Acaa2                       acetyl-Coenzyme A acyltransferase 2
                       Aldob                         aldolase B, fructose-bisphosphate
                        Eci1                       enoyl-Coenzyme A delta isomerase 1
                         Fah                          fumarylacetoacetate hydrolase
                         Gpt                          glutamic pyruvic transaminase
                       Isoc2a                     isochorismatase domain containing 2a
                        Klhl3                                   kelch-like 3
                        Ldhd                             lactate dehydrogenase D
                        Odc1                       ornithine decarboxylase, structural 1
                       Ppm1h                protein phosphatase 1H (PP2C domain containing)

Transporters
    Our previous metabolome analysis revealed that some organic osmolytes are increased in TauTKO
mice [11]. M-A plots of transcriptome data are shown in Figure 1, and the transporter genes that
were either elevated in TauTKO mice or relate to the focus of this study are highlighted. Among the
induced transporters are Slc38a2 and Slc38a4, which represent amino acid transporter system A-2
(ATA2) and A-3 (ATA3), respectively. The induction of these transporters has been observed in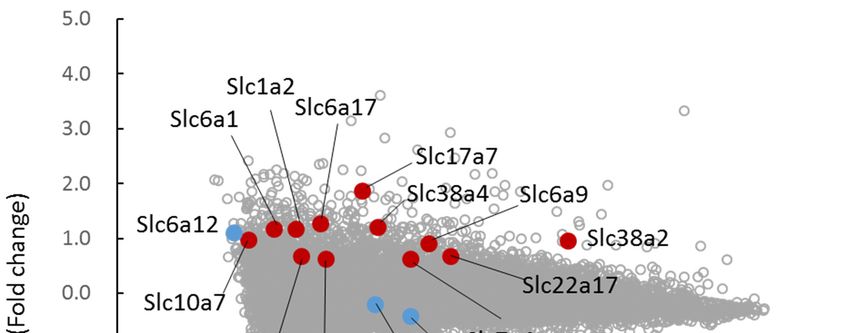
J 2018, 1                                                                                                        61

J 2018, 1, x FOR PEER REVIEW                                                                                5 of 14
previous reports [5,8]. However, the amino acid transporters Slc6a9 (glycine transporter-1) and
(cationic amino acid
Slc7a4 (cationic aminotransporter-4)  were also
                         acid transporter-4)    increased
                                             were         in the TauTKO
                                                  also increased           mouse.mouse.
                                                                  in the TauTKO      Although  both Slc6a1
                                                                                            Although   both
(gamma-aminobutyric      acid (GABA)
Slc6a1 (gamma-aminobutyric             transporter-1)
                                 acid (GABA)          and Slc6a17
                                               transporter-1) and (its substrate
                                                                   Slc6a17        is unidentified)
                                                                            (its substrate         are also
                                                                                           is unidentified)
elevated,  their expression
are also elevated,             remains
                   their expression     low. low.
                                     remains  Additionally,  the the
                                                   Additionally,  truncated
                                                                     truncatedmRNA
                                                                                 mRNAofofSlc6a6
                                                                                            Slc6a6 (taurine
transporter) was also detected by microarray analysis in TauTKO
                                                            TauTKO tissue.
                                                                      tissue.

      Figure 1. Changes in transporter genes of TauTKO mice. M-A plot showing an intensity-dependent
      Figure 1. Changes in transporter genes of TauTKO mice. M-A plot showing an intensity-dependent
      ratio of raw gene microarray data. The genes that were significantly altered and of special interest are
      ratio of raw gene microarray data. The genes that were significantly altered and of special interest are
      highlighted in red and light blue, respectively. Expression levels were normalized by 75th percentile
      highlighted in red and light blue, respectively. Expression levels were normalized by 75th percentile
      genes for each sample (75th percentile = 0 in log (expression level)).
      genes for each sample (75th percentile = 0 in log (expression level)).

      Whereas betaine/GABA transporter-1 (BGT-1; Slc6a12), which is responsible for betaine uptake,
      Whereas betaine/GABA
is induced/activated              transporter-1
                       by hyperosmotic           (BGT-1;inSlc6a12),
                                           conditions               whichexpression
                                                           certain cells,   is responsible  for betaine
                                                                                       of BGT-1   is lowuptake,
                                                                                                           in the
is induced/activated    by  hyperosmotic    conditions   in certain cells,
heart and not significantly different between TauTKO and wild-type mice.   expression   of BGT-1   is low  in the
heartMoreover,
       and not significantly  different between   TauTKO    and  wild-type   mice.
                 expression of the organic cation transporters OCTN1 (Slc22a4) and OCTN2 (Slc22a5),
      Moreover,
specific         expression
         transporters         of the organic
                       for carnitine,         cation transporters
                                      is not different              OCTN1and
                                                       between TauTKO         (Slc22a4) and mice.
                                                                                  wild-type  OCTN2  By (Slc22a5),
                                                                                                        contrast,
the expression of the other Slc22 family member, Slc22a17 (its substrate is unidentified contrast,
specific transporters  for carnitine, is not different between   TauTKO     and   wild-type  mice.  By   [12]), is
the expression of the other Slc22 family member, Slc22a17 (its substrate is unidentified [12]),
increased.
is increased.
3.2. Integrated Pathway Analysis of Transcriptome and Metabolite Data
3.2. Integrated Pathway Analysis of Transcriptome and Metabolite Data
      We also investigated changes in the metabolic pathways of the TauTKO mouse by integrated
      We also investigated changes in the metabolic pathways of the TauTKO mouse by integrated
pathway analysis of transcriptome and metabolomics data of the TauTKO mouse using the online
pathway analysis of transcriptome and metabolomics data of the TauTKO mouse using the online
database MetaboAnalyst 4.0. The analysis of differentially expressed genes and differentially
database MetaboAnalyst 4.0. The analysis of differentially expressed genes and differentially contained
contained metabolites revealed alterations in some KEGG (Kyoto Encyclopedia of Genes and
metabolites revealed alterations in some KEGG (Kyoto Encyclopedia of Genes and Genomes) metabolic
Genomes) metabolic pathways (Table 7). No pathways showed statistically significant hits scores (p
pathways (Table 7). No pathways showed statistically significant hits scores (p < 0.05), whereas seven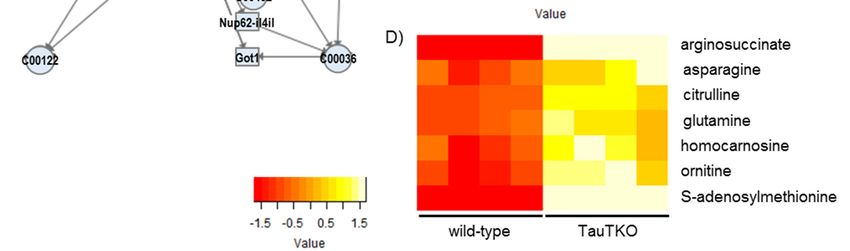
J 2018, 1 62
Table 7. Activated pathways in heart suggested from the integrated pathway analysis.
Pathway Total Expected Hits p Value Topology
Arginine and proline metabolism 102 6.4818 11 0.052661 0.43011
Synthesis and degradation of ketone bodies 15 0.95321 3 0.06475 1.3333
Fatty acid elongation 58 3.6858 7 0.069782 0.47945
Alanine, aspartate, and glutamate metabolism 58 3.6858 7 0.069782 0.4898
Fatty acid metabolism 88 5.5922 8 0.18998 0.99029
Glutathione metabolism 79 5.0203 7 0.23141 0.16981
Valine, leucine and isoleucine degradation 88 5.5922 7 0.32376 0.25556
Glycerophospholipid metabolism 119 7.5622 8 0.49038 0.26667
3.2.1. Glycerophospholipid Metabolism
Since GPC is one of the organic osmolytes that increases under hyperosmotic conditions,
we focused on its synthetic pathway. As shown in Figure 2, some metabolites and some genes
involved in glycerophospholipid metabolism are altered in TauTKO mice. The observed increase
in GPC in the TauTKO mouse heart is in agreement with the elevated expression of phospholipase
A2 (Pla2g4a), suggesting that this pathway may be responsible for an increase in GPC. Additionally,
acetylcholine cholinesterase (Ache) and CDP-choline are changed, suggesting that the stimulation
of the pathway enhances phosphatidylcholine synthesis. Moreover, phosphatidic acid phosphatase
type 2C (Ppap2c), which catalyzes the conversion of phosphatidic acid to diacylglycerol, is elevated in
TauTKO mice, indicating that this activation contributes to enhanced phosphatidylcholine synthesis.
A reduction in glycerol-1-phosphate may be caused by enhancement of diacylglycerol synthesis.
3.2.2. Arginine and Proline Metabolism and Alanine, Aspartate, and Glutamate Metabolism
As shown in Figure 3A (Arginine and proline metabolism pathway), the induction of arginosccinate
lyase (Asl) occurs concomitantly with increases in Ornitine, Citrulline, and Arginosuccinate in the TauTKO
heart. The reason why arginosuccinate is increased despite the induction in the Asl gene may be the
increase in citrulline and ornithine in the heart. Most of the genes involved in the urea cycle are
expressed in the liver. In the case of other tissues, Asl catalyzes the formation of arginine from
arginosuccinate. Arginine is a precursor of nitric monoxide (NO), whose formation is catalyzed by
NO synthase (NOS) [13]. It has been reported that Asl is a key enzyme in the production of NO in
the heart [14]. Asl and arginosuccinate overlap with Alanine, aspartate, and glutamate metabolism
(Figure 3B); this map indicates the importance of asparagine in supplying arginosuccinate. These data
indicate that the arginine metabolic pathway involving NOS generation may be activated in the heart
of TauTKO mice.
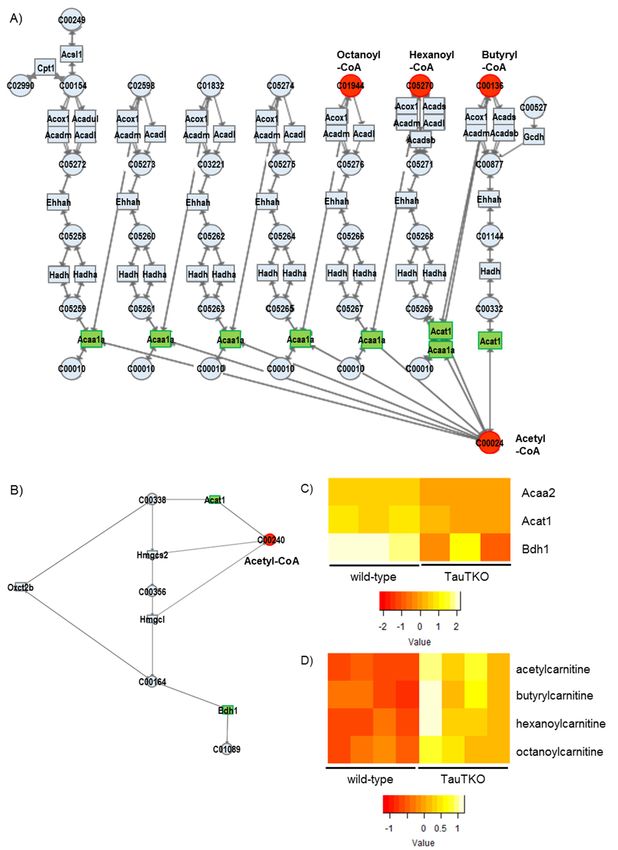
3.2.3. Fatty Acid Metabolism and Degradation of Ketone Bodies
As shown in Figure 4A, the genes of the fatty acid metabolic pathway, Acat and Acaa,
are significantly decreased. In addition to these genes, Ehhadh, Hadh, Hadha, and Echs1 are
also slightly diminished in TauTKO mice (by −1.3~−1.4-fold). According to the metabolic
profile reported previously, short-chain acylcarnitine (Butylcarnitine (C4), Hexanoylcarnitine (C6),
and octanoylcarnitine (C8)) and acetylcarnitine (C2) are higher in TauTKO mice than in wild-type
mice [8]. Since carnitine plays a role in the uptake of fatty acids by the mitochondria where they are
converted to acyl-CoA and undergo oxidation, an increase in acyl-carnitine may result from incomplete
fatty acid oxidation. Moreover, carnitine conjugation is responsible for the detoxification of excess
acyl-CoAs [15]. For example, butyrylcarnitine is increased in the plasma of the patients of Short-chain
acyl-CoA dehydrogenase deficiency [16]. Therefore, these data suggest that oxidation of short chain
acyl-CoAs is suppressed in TauTKO mice.
Additionally, as shown in Figure 4B, the genes of the ketone body degradation pathway, Bdh1 and
Acot, are decreased in TauT KO mice, suggesting that the availability of ketone bodies in the heart is reduced.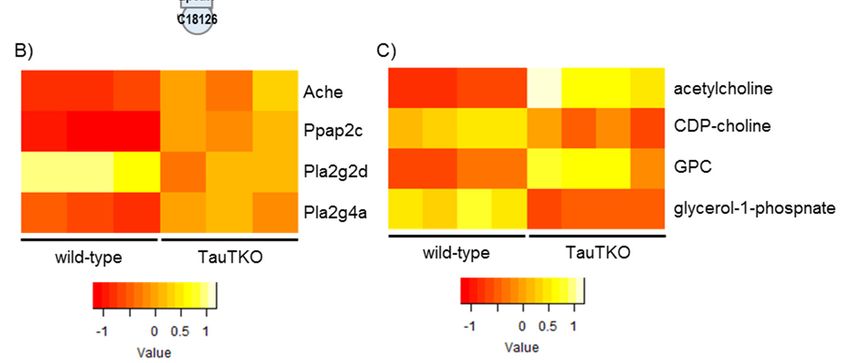
J 2018, 1                                                                                                    63
J 2018, 1, x FOR PEER REVIEW                                                                            7 of 14

3.2.4. Valine, Leucine, and Isoleucine Degradation
3.2.4. Valine, Leucine, and Isoleucine Degradation
      As shown in Figure 5, the genes of the valine, leucine, and isoleucine degradation pathways,
      As shown in Figure 5, the genes of the valine, leucine, and isoleucine degradation pathways,
such as Mccc1, Acat1, Abat1, Acaa1, and Aldh4a1, are decreased in the TauTKO heart. According to
such as Mccc1, Acat1, Abat1, Acaa1, and Aldh4a1, are decreased in the TauTKO heart. According to the
the metabolic map, a reduction of Mccc may cause a decrease in the conversion of methylclotonyl-
metabolic map, a reduction of Mccc may cause a decrease in the conversion of methylclotonyl-CoA to
CoA to methylglutaconyl-CoA, enhancing the conversion to hydroxyisovaleryl-CoA. A reduction in
methylglutaconyl-CoA, enhancing the conversion to hydroxyisovaleryl-CoA. A reduction in Abat and
Abat and Aldh7a1 may suppress the metabolism of (S)-methylmalonate semialdehyde, resulting in
Aldh7a1 may suppress the metabolism of (S)-methylmalonate semialdehyde, resulting in enhanced
enhanced generation of propionyl-CoA conversion from (S)-methylmalonate semialdehyde.
generation of propionyl-CoA conversion from (S)-methylmalonate semialdehyde.

     Figure 2. Changes in genes and metabolites of the Glycerophospholipid metabolism pathway of
     Figure 2. Changes in genes and metabolites of the Glycerophospholipid metabolism pathway of
     TauTKO mice. (A) Altered genes and metabolites are highlighted in red for increase and in green for
     TauTKO mice. (A) Altered genes and metabolites are highlighted in red for increase and in green for
     decrease. Numbers in brackets indicate fold-change of genes. (B,C) Relative levels of the enriched
     decrease. Numbers in brackets indicate fold-change of genes. (B,C) Relative levels of the enriched
     genes
     genes (B) and metabolites
           (B) and  metabolites (C)
                                 (C) are
                                     are shown.
                                         shown. The
                                                The heat
                                                    heat map
                                                         map represents
                                                             represents log
                                                                        log 22 fold-changes
                                                                               fold-changes (normalized
                                                                                            (normalized by
                                                                                                        by
     the average   of all  samples) in wild-type and  TauTKO   mice. GPC;   glycerophosphocholine,   CDP-
     the average of all samples) in wild-type and TauTKO mice. GPC; glycerophosphocholine, CDP-choline;
     choline;
     cytidine cytidine  5′-Diphosphocholine
              50 -Diphosphocholine.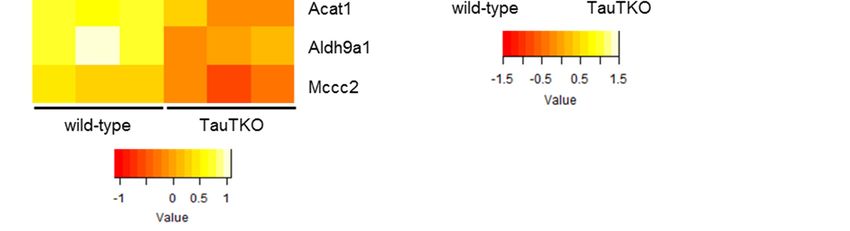
J 2018, 1                                                                                                          64
   J 2018, 1, x FOR PEER REVIEW                                                                          8 of 14

       Figure 3. Genes and metabolites altered in the Arginine metabolism pathway (A) and the Alanine
     Figure 3. Genes and metabolites altered in the Arginine metabolism pathway (A) and the Alanine
       metabolism pathway (B) of TauTKO mice. Altered genes and metabolites are highlighted in red for
     metabolism pathway (B) of TauTKO mice. Altered genes and metabolites are highlighted in red for
       increase and in green for decrease. (C,D) Relative levels of the enriched genes (C) and metabolites (D)
     increase and in green for decrease. (C,D) Relative levels of the enriched genes (C) and metabolites (D)
       are shown. The heat map represents log 2 fold-changes (normalized by the average of all samples) in
     are shown. The heat map represents log 2 fold-changes (normalized by the average of all samples) in
       wild-type and TauTKO mice.
     wild-type and TauTKO mice.
J 2018, 1 65
J 2018, 1, x FOR PEER REVIEW 9 of 14
Figure4.4. Altered
Figure Altered genes
genesand
andmetabolites
metabolitesof
ofthe
the fatty
fattyacid
acidoxidation
oxidationpathway
pathway (A)
(A) and
and the
theketone
ketone body
body
degradation pathway (B) of TauTKO mice. Altered genes and metabolites are highlighted
degradation pathway (B) of TauTKO mice. Altered genes and metabolites are highlighted in red for in red for
increase and in green for decrease. (C,D) Relative levels of the enriched genes (C) and metabolites
increase and in green for decrease. (C,D) Relative levels of the enriched genes (C) and metabolites (D) (D)
areshown.
are shown. The
The heat
heat map
map represents
representslog
log22fold-changes
fold-changes(normalized
(normalizedbybythe
theaverage
averageofofall
allsamples)
samples)in in
wild-typeand
wild-type andTauTKO
TauTKOmice.
mice.J 2018,
2018, 11, x FOR PEER REVIEW 10 of 66
14
Figure 5.
Figure 5. Altered
Altered genes
genes and metabolites of
and metabolites of the
the branched-chain
branched-chain amino
amino acid
acid (BCAA)
(BCAA) metabolism
metabolism
pathway (A) in TauTKO mice. Altered genes and metabolites are highlighted in red for
pathway (A) in TauTKO mice. Altered genes and metabolites are highlighted in red for increase and increase and
in green
in green for
for decrease.
decrease. (B,C)
(B,C) Relative
Relative levels
levels of
of the enriched genes
the enriched genes (B)
(B) and
and metabolites
metabolites (C)(C) are
are shown.
shown.
The heat
The heat map
map represents
represents log
log 22 fold-changes
fold-changes (normalized
(normalized by the
the average
average ofof all
all samples)
samples) in
in wild-type
wild-type
TauTKO mice.
and TauTKO mice.
4. DiscussionJ 2018, 1 67
4. Discussion
One of the most important functions of taurine in the cell is the regulation of intracellular
osmolality. When cells are exposed to the hyperosmolar milieu, the content of organic osmolytes,
including those of taurine, betaine, GPC, and amino acids, are increased, which contributes to the
establishment of an ionic balance and minimizes changes in cell volume [1]. In certain types of
cells, such as kidney cells, the mRNA of the TauT (Slc6a6), the BGT-1 (Slc6a12), and the amino acid
transporter system A (Slc38a2) are increased by hyperosmotic stress, which in turn stimulates the
uptake of their respective substrates. These cellular responses against a change in osmolality are
regulated by the transcription factor TonEBP (tonicity-response element binding protein; also called
NFAT5). In the case of the heart, we observed that taurine depletion (TauT knockout) also alters
organic osmolyte content, suggesting that disturbances in cellular osmoregulation caused by the loss
of taurine may be compensated for by alterations in other osmolytes. However, the expression of
BGT-1 is not significantly different between TauTKO and wild-type mice, implying the involvement of
an unidentified mechanism in the change in betaine content. Transcriptome analysis also revealed the
induction of other transporters, including Slc38a2, Slc38a4, Slc6a9 (glycine transporter-1), and Slc7a4
(a member of the cationic amino acid transporter y+ system), in the TauTKO heart. In addition to
BGT-1, other betaine transport systems exist: Slc6A20 (betaine/proline transporter) and Slc7a6 (another
member of a member of the cationic amino acid transporter y+ system, y+ LAT2), which are expressed
in mouse oocytes [17,18]. The Slc38 protein family is also a potential transport system for betaine [17].
While these transporters are candidates for betaine transport in the heart, further study is necessary to
identify the transporter which contributes to osmoregulation of betaine in the heart.
Carnitine also functions as an organic osmolyte [19]. In the transcriptome profile, levels of the
carnitine transporter genes Slc22a4 and Slc22a5 are not altered in TauTKO mice. By contrast, the content
of another member of the organic cation transporter family, Slc22a17, is increased in the TauTKO heart;
however, carnitine does not function as a substrate of that transporter [12]. Activation of carnitine
transport in TauTKO mice may be related to post-translational modifications, such as phosphorylation.
GPC is converted from phosphatidylcholine to lysophosphatidylcholine by Phospholipase A2
and Glycerophosphocholine phosphodiesterase. Alternatively, Phospholipase B (PLB) catalyzes the
direct conversion of phosphatidylcholine to GPC [1]. It has been reported that cellular exposure to
a hyperosmolar condition increases the content of PLB mRNA, which should mediate an increase
in GPC in the kidney cell. In the present study, we observed in the TauTKO heart induction of one
of the phospholipase genes, Pla2g4, but not that of the PLB gene (Fold change = 1.243, p = 0.237),
indicating that a different osmotic-related pathway may function in the heart to control GPC synthesis.
In addition, Acetylcholinesterase (Ache) is induced in the TauTKO mouse while acetylcholine level
increases and CDP-choline content falls. This pathway may provide the choline portion of GPC’s
structure. Moreover, phosphatidic acid phosphatase-2c (Ppap2c), which catalyzes the conversion of
phosphatidic acid to diacylglycerol, a precursor of phosphatidylcholine, is also induced in the TauTKO
mouse. These coordinated activations of the metabolic pathway likely contribute to the effectiveness
of GPC as an osmoregulator in the heart.
Besides examining the modulation of various osmolytes in the TauTKO heart, we observed an
induction of arginosuccinate lyase, concomitant with an increase in the levels of arginosuccinate,
ornithine, and citrulline, in TauTKO mice. Citrulline and arginosuccinate are important intermediates
in the production of NO in most tissues, the exception being the liver [13]. The knockout of Asl in
mice causes a decrease in protein nitrosylation and nitrite in the heart, evidence of an attenuation
of NO synthesis [14]. Therefore, the activation of this pathway in the TauTKO heart may increase
NO production.
We observed reductions in some genes associated with fatty acid oxidation in the TauTKO mouse,
which may cause incomplete fatty acid oxidation followed by the accumulation of the carnitine
derivatives of short chain fatty acids. Furthermore, acetylcarnitine is also higher in TauTKO mice,
indicating an accumulation of acetyl-CoA. Additionally, we observed that the gene expressions ofJ 2018, 1 68
Bdh1 and Acat1 that metabolize to acetyl-CoA from ketone bodies were decreased, but acetyl-CoA
was increased. Acetyl-CoA not only feeds carbon into the tricarboxylic acid cycle but can also control
energy metabolism by acetylation of lysine residues of key enzymes [20]. Although the enzymes
related to fatty acid oxidation, as well as the tricarboxylic acid cycle and the electron transport chain,
are targets for acetylation, the effect of acetylation on the activity of fatty acid oxidation is controversial.
In the case of the heart, hyperacetylation of mitochondrial proteins caused by a reduction in SIRT3,
a mitochondrial NAD-dependent deacetylase, in obesity and diabetes is associated with an increase
in the fatty acid oxidation rate [21]. Lysine acetylation can also control transcription of fatty acid
oxidation-related genes by modification of transcriptional regulator PGC-1alpha [21]. These acetylation
processes, which are mediated by acetyl-CoA accumulation, may slow fatty acid oxidation and ketone
degradation in the heart of TauTKO mice. Moreover, the carboxylation of acetyl CoA produces malonyl
CoA, which inhibits carnitine palmitoyltransferase, a key enzyme involved in fatty acid uptake and
oxidation by the heart. Importantly, similar transcriptome changes related to fatty acid oxidation
were observed in skeletal muscle of TauTKO mice [22]. Therefore, this may be a result of tissue
taurine depletion. Indeed, the decrease in oxidation by the taurine-deficient rat heart has been largely
attributed to taurine-mediated reductions in carnitine palmitoyltransferase-1 activity [23]. Additionally,
why acetyl-CoA is increased in the heart of TauTKO mice is unclear. It is possible that the accumulated
acetyl-CoA comes from glycolysis pathway activation and/or the reduction of the tricarboxylic acid
(TCA) cycle. We previously observed that the glycolysis is enhanced and the TCA cycle activity is
diminished in the taurine-deficient heart [23].
Finally, we observed a reduction in some genes associated with the branched-chain amino acid
(BCAA) degradation pathways. Catabolic defects of BCAA metabolism occur in heart failure. In the
case of the pressure-overload-induced failing heart of mice, most of genes of the KEGG BCAA catabolic
pathway are reduced compared to those of the sham-operated heart. Moreover, the genetic changes are
accompanied by an increase in the branched-chain keto acids (BCKAs), which are markers for a defect
in the BCAA metabolic pathway [24]. Importantly, it has been reported that elevations in BCKAs
by knocking out PP2Cm, a BCKA dehydrogenase phosphatase, lead to impaired cardiac function.
Similarly, it is attractive to suggest that suppression of the BCAA metabolic pathway in TauTKO mice
may partially contribute to the aging-dependent decline in cardiac function.
5. Conclusions
In conclusion, the integrated pathway analysis of the transcriptome and metabolome profiles
in TauTKO mice identified some metabolic pathways activated by taurine depletion. Some of the
changes may be directly caused by taurine depletion, while others may be caused by cardiac disorder.
The present study raises the possibility that taurine may play a role in the regulation of GPC metabolism,
NO synthesis, fatty acid oxidation, ketone body degradation, and BCAA metabolism in the heart.
We may be able to distinguish the direct effects or the secondary effects by comparing with the
changes of genes and metabolites in taurine-treated cells/animals. Furthermore, there are very few
studies investigating the various osmoregulatory mechanisms in the heart. The present study provides
potential molecular pathways responsible for the control of osmolytes, such as betaine, GPC, and amino
acids. Further studies are necessary to understand the genetic modulation of osmotic imbalances in
the heart.
Author Contributions: T.I. conceived and performed the experiments and analyzed the data; T.I., S.M., and
S.S. wrote the paper.
Funding: This work is supported from the JSPS KAKENHI Grant Numbers 22790097 and 25750368.
Conflicts of Interest: The authors declare no conflict of interest.J 2018, 1 69
References
1. Gallazzini, M.; Burg, M.B. What’s New about Osmotic Regulation of Glycerophosphocholine. Physiology
2009, 24, 245–249. [CrossRef] [PubMed]
2. Ito, T.; Schaffer, S.; Azuma, J. The effect of taurine on chronic heart failure: Actions of taurine against
catecholamine and angiotensin II. Amino Acids 2014, 46, 111–119. [CrossRef] [PubMed]
3. Pion, P.D.; Kittleson, M.D.; Rogers, Q.R.; Morris, J.G. Myocardial failure in cats associated with low plasma
taurine: A reversible cardiomyopathy. Science 1987, 237, 764–768. [CrossRef] [PubMed]
4. Ito, T.; Kimura, Y.; Uozumi, Y.; Takai, M.; Muraoka, S.; Matsuda, T.; Ueki, K.; Yoshiyama, M.; Ikawa, M.;
Okabe, M.; et al. Taurine depletion caused by knocking out the taurine transporter gene leads to
cardiomyopathy with cardiac atrophy. J. Mol. Cell. Cardiol. 2008, 44, 927–937. [CrossRef] [PubMed]
5. Warskulat, U.; Flögel, U.; Jacoby, C.; Hartwig, H.G.; Thewissen, M.; Merx, M.W.; Molojavyi, A.; Heller-Stilb, B.;
Schrader, J.; Häussinger, D. Taurine transporter knockout depletes muscle taurine levels and results in
severe skeletal muscle impairment but leaves cardiac function uncompromised. FASEB J. 2004, 18, 577–579.
[CrossRef] [PubMed]
6. Ito, T.; Yoshikawa, N.; Inui, T.; Miyazaki, N.; Schaffer, S.W.; Azuma, J. Tissue depletion of taurine accelerates
skeletal muscle senescence and leads to early death in mice. PLoS ONE 2014, 9, e107409. [CrossRef] [PubMed]
7. Warskulat, U.; Borsch, E.; Reinehr, R.; Heller-Stilb, B.; Mönnighoff, I.; Buchczyk, D.; Donner, M.; Flögel, U.;
Kappert, G.; Soboll, S.; et al. Chronic liver disease is triggered by taurine transporter knockout in the mouse.
FASEB J. 2006, 20, 574–576. [CrossRef] [PubMed]
8. Ito, T.; Okazaki, K.; Nakajima, D.; Shibata, D.; Murakami, S.; Schaffer, S. Mass spectrometry-based
metabolomics to identify taurine-modified metabolites in heart. Amino Acids 2018, 50, 117–124. [CrossRef]
[PubMed]
9. Huang, D.W.; Sherman, B.T.; Lempicki, R.A. Systematic and integrative analysis of large gene lists using
DAVID bioinformatics resources. Nat. Protoc. 2009, 4, 44–57. [CrossRef] [PubMed]
10. Chong, J.; Soufan, O.; Li, C.; Caraus, I.; Li, S.; Bourque, G.; Wishart, D.S.; Xia, J. MetaboAnalyst 4.0: Towards
more transparent and integrative metabolomics analysis. Nucleic Acids Res. 2018, 46, W486–W494. [CrossRef]
[PubMed]
11. Ito, T. Tissue taurine depletion induces profibrotic pattern of gene expression and causes aging-related
cardiac fibrosis in heart in mice. Biol. Pharm. Bull. 2018, in press.
12. Bennett, K.M.; Liu, J.; Hoelting, C.; Stoll, J. Expression and analysis of two novel rat organic cation transporter
homologs, SLC22A17 and SLC22A23. Mol. Cell. Biochem. 2011, 352, 143–154. [CrossRef] [PubMed]
13. Nagamani, S.C.S.; Erez, A.; Lee, B. Argininosuccinate lyase deficiency. Genet. Med. 2012, 14, 501–507.
[CrossRef] [PubMed]
14. Erez, A.; Nagamani, S.C.S.; Shchelochkov, O.A.; Premkumar, M.H.; Campeau, P.M.; Chen, Y.; Garg, H.K.;
Li, L.; Mian, A.; Bertin, T.K.; et al. Requirement of argininosuccinate lyase for systemic nitric oxide production.
Nat. Med. 2011, 17, 1619–1626. [CrossRef] [PubMed]
15. Koves, T.R.; Ussher, J.R.; Noland, R.C.; Slentz, D.; Mosedale, M.; Ilkayeva, O.; Bain, J.; Stevens, R.; Dyck, J.R.B.;
Newgard, C.B.; et al. Mitochondrial Overload and Incomplete Fatty Acid Oxidation Contribute to Skeletal
Muscle Insulin Resistance. Cell Metab. 2008, 7, 45–56. [CrossRef] [PubMed]
16. Pedersen, C.B.; Kølvraa, S.; Kølvraa, A.; Stenbroen, V.; Kjeldsen, M.; Ensenauer, R.; Tein, I.; Matern, D.;
Rinaldo, P.; Vianey-Saban, C.; et al. The ACADS gene variation spectrum in 114 patients with short-chain
acyl-CoA dehydrogenase (SCAD) deficiency is dominated by missense variations leading to protein
misfolding at the cellular level. Hum. Genet. 2008, 124, 43–56. [CrossRef] [PubMed]
17. Corbett, H.E.; Dubé, C.D.; Slow, S.; Lever, M.; Trasler, J.M.; Baltz, J.M. Uptake of Betaine into Mouse
Cumulus-Oocyte Complexes via the SLC7A6 Isoform of y+L Transporter. Biol. Reprod. 2014, 90. [CrossRef]
[PubMed]
18. Hammer, M.-A.; Baltz, J.M. Betaine is a highly effective organic osmolyte but does not appear to be
transported by established organic osmolyte transporters in mouse embryos. Mol. Reprod. Dev. 2002,
62, 195–202. [CrossRef] [PubMed]
19. Peluso, G.; Barbarisi, A.; Savica, V.; Reda, E.; Nicolai, R.; Benatti, P.; Calvani, M. Carnitine: An osmolyte that
plays a metabolic role. J. Cell. Biochem. 2000, 80, 1–10. [CrossRef]J 2018, 1 70
20. Fukushima, A.; Lopaschuk, G.D. Acetylation control of cardiac fatty acid β-oxidation and energy metabolism
in obesity, diabetes, and heart failure. Biochim. Biophys. Acta Mol. Basis Dis. 2016, 1862, 2211–2220. [CrossRef]
[PubMed]
21. Dominy, J.E.; Lee, Y.; Gerhart-Hines, Z.; Puigserver, P.; Puigserver, P. Nutrient-dependent regulation of
PGC-1alpha’s acetylation state and metabolic function through the enzymatic activities of Sirt1/GCN5.
Biochim. Biophys. Acta 2010, 1804, 1676–1683. [CrossRef] [PubMed]
22. Ito, T.; Yoshikawa, N.; Schaffer, S.W.; Azuma, J.; Ito, T.; Yoshikawa, N.; Schaffer, S.W.; Azuma, J. Tissue
Taurine Depletion Alters Metabolic Response to Exercise and Reduces Running Capacity in Mice. J. Amino
Acids 2014, 2014, 964680. [CrossRef] [PubMed]
23. Schaffer, S.W.; Shimada-Takaura, K.; Jong, C.J.; Ito, T.; Takahashi, K. Impaired energy metabolism of the
taurine-deficient heart. Amino Acids 2016, 48, 549–558. [CrossRef] [PubMed]
24. Sun, H.; Olson, K.C.; Gao, C.; Prosdocimo, D.A.; Zhou, M.; Wang, Z.; Jeyaraj, D.; Youn, J.-Y.; Ren, S.;
Liu, Y.; et al. Catabolic Defect of Branched-Chain Amino Acids Promotes Heart Failure. Circulation 2016,
133, 2038–2049. [CrossRef] [PubMed]
© 2018 by the authors. Licensee MDPI, Basel, Switzerland. This article is an open access
article distributed under the terms and conditions of the Creative Commons Attribution
(CC BY) license (http://creativecommons.org/licenses/by/4.0/).You can also read