Differentially expressed lncRNAs in liver tissues of TX mice with hepatolenticular degeneration - Nature
←
→
Page content transcription
If your browser does not render page correctly, please read the page content below
www.nature.com/scientificreports
OPEN Differentially expressed lncRNAs
in liver tissues of TX mice
with hepatolenticular degeneration
Juan Zhang1,4*, Ying Ma3,4, Daojun Xie1, Yuancheng Bao1, Wenming Yang1, Han Wang1,
Huaizhou Jiang2, Hui Han1 & Ting Dong1
Wilson’s Disease (WD), an ATP7B-mutated inherited disease that affects copper transport, is
characterised by liver and nervous system manifestations. Long non-coding (ln-c) RNAs are widely
involved in almost all physiological and pathological processes in the body, and are associated with
numerous diseases. The present study aimed to elucidate the lncRNA-mRNA regulation network in
a TX WD mouse model using RNA sequencing (RNA-seq). lncRNA expression profiles were screened
using RNA-seq and real-time polymerase chain reaction, and differentially expressed lncRNAs and
mRNAs were identified. To analyse the biological functions and pathways for the differentially
expressed mRNAs, gene ontology and pathway enrichment analyses were performed. A significantly
correlated lncRNA-mRNA relationship pair was calculated by CNC analysis to construct differential
lncRNA and mRNA co-expression networks. A total of 2564 significantly up-regulated and 1052 down-
regulated lncRNAs, and 1576 up-regulated and 297 down-regulated mRNAs, were identified. These
genes were found to be associated with key processes such as apoptosis, and KEGG analysis revealed
enrichment in the drug metabolism-cytochrome P450 pathway, PPAR signalling pathway, Notch
signalling pathway, and MAPK signalling pathway. The identified differential lncRNAs may be involved
in the pathogenesis and development of WD liver injury.
Wilson’s disease (WD), also known as hepatolenticular degeneration, is an autosomal recessive disorder of copper
metabolism caused by an ATP7B gene mutation1. WD results in a decrease in copper excretion in bile, which
leads to the accumulation of copper in various organs, including the liver and brain, causing liver, and nerve
damage, and mental s ymptoms2. While the clinical manifestations of WD patients involve multiple systems, liver
disease is most prevalent, and is more common in younger children. WD patients begin to accumulate copper
in the liver from birth; hence, most patients initially present with liver cirrhosis.
As WD is an autosomal recessive single-gene genetic disease, disease prevention and treatment based on
the pathogenesis can be investigated. Long non-coding (Inc)RNAs were once considered by-products of the
transcription process, and the “noise” of gene transcription with no biological functions3. However, it has been
demonstrated that lnc-RNAs are widely involved in almost all physiological and pathological processes in the
body, and are associated with the occurrence and development of many diseases4. Copper ions have a strong
ability to produce free radicals, making excess copper potentially toxic. The main mechanism leading to liver
fibrosis or cirrhosis in WD is through hepatic stellate cells (HSCs), which become activated by various fibrogenic
pathways, and cause an imbalance in extracellular matrix (ECM) synthesis and degradation during repair of liver
injury. HSCs are the main effectors of hepatic fibrosis. A variety of lncRNAs have been found to play important
regulatory roles in the activation of HSCs5, and are suggested to have a prominent role in hepatic fibrosis in WD;
thus, they may serve as predictive markers or therapeutic targets for disease occurrence.
In this study, lncRNA expression profiles in liver tissues of TX WD mice were assessed using RNA-seq, to
investigate the mechanism of lncRNA involvement in WD liver injury further.
1
Encephalopathy Center, the First Affiliated Hospital of Anhui University of Chinese Medicine, No 117 Meishan
Road, Shushan District, Hefei 230031, People’s Republic of China. 2Basic Department of Traditional Chinese
Medicine, Anhui University of Chinese Medicine, No 1 Qianjiang Road, Xinzhan District, Hefei 230012, People’s
Republic of China. 3Graduate School, Anhui University of Chinese Medicine, No 1 Qianjiang Road, Xinzhan District,
Hefei 230012, People’s Republic of China. 4These authors contributed equally: Juan Zhang and Ying Ma. *email:
1477210980@qq.com
Scientific Reports | (2021) 11:1377 | https://doi.org/10.1038/s41598-020-80635-0 1
Vol.:(0123456789)
www.nature.com/scientificreports/
Figure 1. Haematoxylin and eosin staining in the control group showed clearly structured hepatic lobules, and
the hepatocytes were stationary in the centre; veins radiated throughout the tissue, and the central veins, the
arteriovenous structure, and the bile duct appeared normal. In the model group, there was extensive necrosis of
hepatocytes and normal hepatic lobule structure disappeared; a large amount of inflammatory cell infiltration
was evident. Masson staining showed that, in the control group, only a few collagen fibres were found in the
manifold area and central vein. The liver tissue of the model group had extensive hyperplasia, extending from
the manifold area to the surrounding area, forming a complete pseudolobular structure of different sizes.
Results
Liver histopathology. Haematoxylin and eosin staining in the control group showed clearly structured
hepatic lobules, and the hepatocytes were stationary in the centre; veins radiated throughout the tissue, and the
central veins, the arteriovenous structure, and the bile duct appeared normal. In the model group, there was
extensive necrosis of hepatocytes, and normal hepatic lobule structure disappeared; a large amount of inflam-
matory cell infiltration was evident. Masson staining showed that, in the control group, only a few collagen fibres
were found in the manifold area and central vein. The liver tissue of the model group had extensive hyperplasia,
extending from the manifold area to the surrounding area, forming a complete pseudolobular structure of dif-
ferent sizes (Fig. 1).
Expression profile of lncRNAs in the liver. We characterised the lncRNA expression profile by per-
forming deep RNA-seq experiments on 4 tx-j and 4 control mouse liver tissues. In total, we identified 62,559
lncRNA transcripts in which fragments per kilobase of exon per million reads mapped (FPKM) were above 0
among any one of 4 CN samples or 4 tx-j samples; further, 50,079 lncRNAs were expressed in both groups in
which the FPKM was above 0 among any one of 4 CN samples and 4 tx-j samples (Fig. 2a). The most common
type of lncRNAs was intergenic, the next were intronic sense, exonic sense and exonic antisense, and intronic
antisense was the least type. In addition, we analysed the distribution of identified lncRNAs on the mouse chro-
mosomes; the 62,559 lncRNA transcripts could be found in all chromosomes, including ChrX and ChrY, and
chromosome 2 included the most lncRNAs (Fig. 2b). Almost all chromosomes (excluding Chr19, ChrX, and
ChrY) could generate more than 2000 lncRNA transcripts (Fig. 2b).
Identification of differentially expressed lncRNAs and protein‑coding genes. Intending to
explore the role of lncRNAs in the tx-j model, we performed RNA-seq to obtain the expression profiles of
lncRNAs. As a result, there were 3616 lncRNA transcripts in the control and model groups. Thereinto, 2564
up-regulated and 1052 down-regulated lncRNAs were proofed by fold change > 2, P < 0.05. Figure 3a,b (Pheat-
map-1.0.12,URL: https://i.loli.net/2020/11/05/Z6cyuBk1oEvX8AP.png) display the expression of lncRNA using
volcano plots and heatmap. Supervised hierarchical cluster analysis shows that the different mRNA can correctly
distinguish the model group from the control group (Fig. 3b). Further, we chose FPKM values greater than 1 for
further analysis. In Table 2, the top 10 up-regulated and down-regulated known lncRNAs are scheduled.
Additionally, 1873 protein-coding genes were found dysregulated in TX mice by twofold, of which 1576
protein-coding genes were up-regulated and 297 protein-coding genes down-regulated.
Scientific Reports | (2021) 11:1377 | https://doi.org/10.1038/s41598-020-80635-0 2
Vol:.(1234567890)
www.nature.com/scientificreports/
Figure 2. (a) In total, we identified 62,559 lncRNA transcripts in which fragments per kilobase of exon per
million reads mapped (FPKM) were above 0 among any one of 4 CN samples or 4 tx-j samples; further, 50,079
lncRNAs were expressed in both groups in which the FPKM was above 0 among any one of 4 CN samples
and 4 tx-j samples (a). (b) The most common type of lncRNAs was intergenic, the next were intronic sense,
exonic sense and exonic antisense, and intronic antisense was the least type. In addition, we analysed the
distribution of identified lncRNAs on the mouse chromosomes; the 62,559 lncRNA transcripts could be found
in all chromosomes, including ChrX and ChrY, and chromosome 2 included the most lncRNAs (b). Almost all
chromosomes (excluding Chr19, ChrX, and ChrY) could generate more than 2000 lncRNA transcripts (b).
Construction of lncRNA‑mRNA co‑expression network and function prediction. After selecting
the Pearson’s correlation coefficients of these lncRNAs and mRNAs equal to or > 0.98 (Table 1), a network was
founded in each of the groups mentioned above using the Cytoscape program (Fig. 4a). More than 198 lncRNAs
could connect with more than 100 protein-coding genes, and almost all of those were up-regulated, excluding
6 lncRNAs. Meanwhile, many protein-coding genes could connect with dozens of lncRNAs. Furthermore, the
details of the top10 connections of up- and down-regulated DELs and protein-coding genes in lncRNA-mRNA
co-expression network are listed in Table 2. The protein-coding genes belonging to the whole lncRNA-mRNA
co-expression network were enriched with GO and pathway analysis (Table 1), and the top 30 terms were pre-
sented (Fig. 4b,c).
Certain established lncRNAs that could connect with more than 100 protein-coding genes were identi-
fied, such as Meg3(ENSMUST00000129245 and ENSMUST00000150851), H19(ENSMUST00000136359),
and Snhg18 (ENSMUST00000181536). Next, the sub-network of four lncRNA transcripts were visualised with
Cytoscape (Fig. 5), and GO enrichment and KEGG6,7 pathway analysis were also performed with cluster Profiler
(Table 2). As shown in Fig. 5a, ENSMUST00000181536 (Snhg19) correlated with 222 protein-coding genes,
and the enrichment analysis showed that Snhg18 might be related to leukocyte transendothelial migration,
phagosome, glutathione metabolism, regulation of actin cytoskeleton, natural killer cell-mediated cytotoxicity,
focal adhesion, Fc epsilon RI signalling pathway, cell adhesion molecules, apoptosis, and Fc gamma R-mediated
Scientific Reports | (2021) 11:1377 | https://doi.org/10.1038/s41598-020-80635-0 3
Vol.:(0123456789)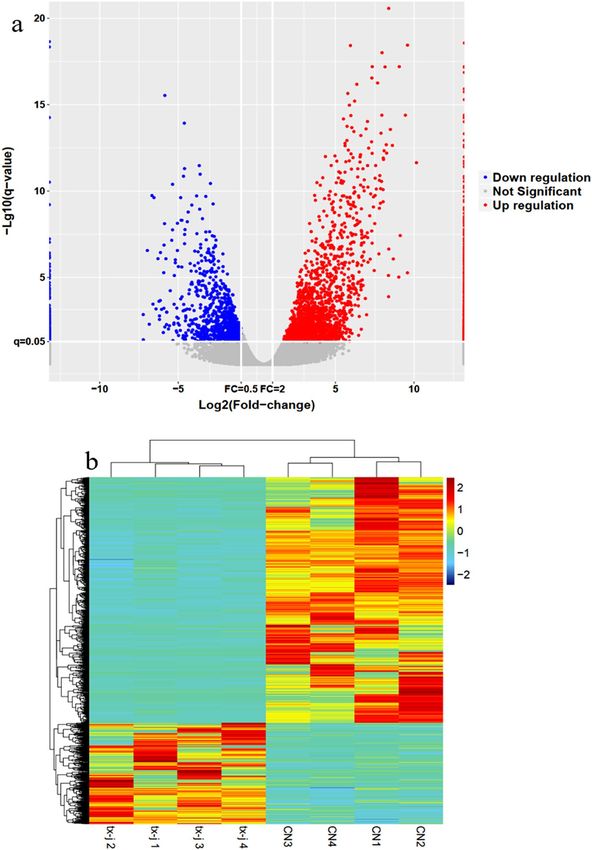
www.nature.com/scientificreports/

                                            Figure 3.  (a,b) Display the lncRNAs’ expression by use of volcano plots and heatmap. Supervised hierarchical
                                            cluster analysis shows that the different mRNA can correctly distinguish the model group from the control
                                            group.

                                            phagocytosis. As shown in Fig. 5b, ENSMUST00000150851 (Meg3) correlated with 200 protein-coding genes,
                                            and KEGG enrichment analysis pointed out that it may participate in sphingolipid metabolism, regulation of
                                            actin cytoskeleton, glycosaminoglycan degradation, complement and coagulation cascades, adherens junction,
                                            leukocyte transendothelial migration, galactose metabolism, haematopoietic cell lineage, chemokine signalling
                                            pathway, p53 signalling pathway, B cell receptor signalling pathway, Fc epsilon RI signalling pathway, ABC
                                            transporters, mitogen-activated protein kinase (MAPK) signalling pathway, and apoptosis. As shown in Fig. 5c,
                                            ENSMUST00000129245 (Meg3) correlated with 169 protein-coding genes, enriched to dozens of KEGG path-
                                            way, such as gap junction, ABC transporters, peroxisome, glutathione metabolism, GnRH signalling pathway,
                                            complement and coagulation cascades, peroxisome proliferator-activated receptor (PPAR) signalling pathway,
                                            metabolism of xenobiotics by cytochrome P450, phagosome, tryptophan metabolism, fatty acid degradation, car-
                                            bohydrate digestion and absorption, Notch signalling pathway, ribosome, and toll-like receptor signalling path-
                                            way. KEGG analysis revealed that two lncRNA transcripts were both related to ABC transporters and complement

          Scientific Reports |   (2021) 11:1377 |               https://doi.org/10.1038/s41598-020-80635-0                                                  4

Vol:.(1234567890)
www.nature.com/scientificreports/
lncRNA_id Forward primer Product length (bp) Fold change/p-vale (tx-j vs CN, qPCR)
Forward: AGCACGAAGCTGAAGGCGTC
NONMMUT149595.1 171 0.47 **
Reverse: GCTCCCTGGCCTGGAGGATTG
Forward: CCCCAAGCCTTGCTCAGGGT
NONMMUT099727.1 Reverse: CGTCCACAGTTCCGAGAC 151 0.35 **
TGGC
Forward: AGTGCCCTAGTGAGGGGGCA
ENSMUST00000129245 146 12.3 **
Reverse: CAAGGGACGACCCTCCTCGG
Forward: CGTCCTTCCCTGGTGGGTGT
ENSMUST00000150851 175 13.5 **
Reverse: GGGCAGCTCGTGGAACCTGA
Forward: CGTGGCGGCTGGTCGGATAA
ENSMUST00000136359 106 24.7 **
Reverse: CAGACGGCGGTCCTCACCTG
Forward: TTTGGCTACCCGCCCCTTGC
ENSMUST00000181536 115 9.87 **
Reverse: CAGGCCTAGCAGACGCCACG
Forward: CCTCACTGTCCACCTTCC
Beta-actin 120 –
Reverse: GGGTGTAAAACGCAGCTC
Table 1. The details of qPCR primers. **Means p < 0.01.
and coagulation cascades, although these two transcripts did not share the same gene of interaction. As shown
in Fig. 5d, ENSMUST00000136359 (H19) correlated with 169 protein-coding genes, including vitamin digestion
and absorption, galactose metabolism, carbohydrate digestion and absorption, retinol metabolism, phagosome,
gap junction, arachidonic acid metabolism, butanoate metabolism, complement and coagulation cascades, anti-
gen processing and presentation, PPAR signalling pathway, ABC transporters, Notch signalling pathway, bile
secretion, and MAPK signalling pathway.
Cis‑ and tans‑regulator of DELs. To better understand the functions of differentially expressed lncR-
NAs in tx-j mice, the functions of cis- and trans-target genes of the differentially expressed lncRNAs were pre-
dicted, and then lncRNA-mRNA pairs that had a PCC greater than 0.98 (or less than − 0.98) and p-value < 0.01
were selected. It is apparent that there are 37 cis-regulatory genes of 42 lncRNAs. In addition, the 41 lncRNAs
have 47 trans-regulatory genes, filtered by Blastn and RNAplex (Table 3). Five pairs of lncRNA-mRNA (ENS-
MUST00000156612/Apoa4, NONMMUT143909.1/C9, ENSMUST00000206226/Cyp2a4, MSTRG.62181.1/
Gsta1, and MSTRG.41324.1/Mup11) presented regulatory characteristics of both cis- and trans-. There are some
DELs target genes involved in signal pathways that have been identified as playing a role in liver injury induced
by tx-j mice, such as ABC transporters (ABCC5, ABCC9), chemokine signalling pathway (CCR5), ECM-recep-
tor interaction (Sdc4), and complement and coagulation cascades (C9).
Real‑time quantitative PCR validation. Validation of expression of DELs by RT-qPCR. Data pre-
sented from Table 1, ENSMUST00000129245, ENSMUST00000150851, ENSMUST00000136359, and ENS-
MUST00000181536 were identified to be significantly up-regulated in the TX group compared to the control
(P < 0.01), consistent with the RNA-seq data.NONMMUT149595.1 and NONMMUT099727.1 were signifi-
cantly down-regulated in the TX group compared to the control (P < 0.01), also consistent with the RNA-seq
data. The results of RNA-seq were consistent with those of RT-qPCR.In a few words, the reliability of RNA-seq
results was verified.
Discussion
Even though lncRNA, once mistaken for gene transcription "dark matter", rarely has protein-coding functions,
it has been found to be heavily involved in important biological functions, such as regulating cell proliferation
and differentiation, the cell cycle, and a poptosis8, especially in organ fibres and tumours9–13.
In this study, the differential lncRNA expression profiles and co-expression network of lncRNA-mRNA
inTX mice were assessed by deep data analysis. Our results identified 3616 lncRNA transcripts in the control
and model groups. Among these, 2564 up-regulated and 1052 down-regulated lncRNAs were identified by fold
change > 2 and P < 0.05. Go analysis of the co-expression network of lncRNA-mRNA showed key involvement
in leukocyte transendothelial migration, glutathione metabolism, regulation of actin cytoskeleton, natural killer
cell-mediated cytotoxicity, Fc epsilon RI signalling pathway, cell adhesion molecules, apoptosis,chemokine signal-
ling pathway (CCR5), ECM-receptor interaction (Sdc4),complement and coagulation cascades (C9),and ABC
transporters(ABCC5, ABCC9). KEGG analysis revealed enrichment in the drug metabolism-cytochrome P450
pathway, chemokine signalling pathway, p53 signalling pathway, toll-like receptor signalling pathway, Notch
signalling pathway, PPAR signalling pathway, and MAPK signalling pathway.
In summary, WD is a complex process involving many lncRNAs, mRNAs, and pathways. lncRNAs ENS-
MUST00000129245, ENSMUST00000150851, ENSMUST00000136359, and ENSMUST00000181536 were differ-
entially expressed and might play major roles in the development of WD. Key genes, for instance,Meg3,H19,and
Snhg18,may be key biomarkers for WD.
Scientific Reports | (2021) 11:1377 | https://doi.org/10.1038/s41598-020-80635-0 5
Vol.:(0123456789)www.nature.com/scientificreports/
Figure 4. (a) After selecting the Pearson’ s correlation coefficients of these lncRNAs and mRNAs equal to
or > 0.98 (Table 1), a network is founded in each of the aforementioned groups using the Cytoscape program.
The protein-coding genes belonging to the whole lncRNA-mRNA co-expression network were enriched with
GO and pathway analysis, and the top 30 terms were presented (b,c).
MEG3 is an imprinted gene located at 14 q32, which encodes a lncRNA associated with multiple human
cancers. It has been found that MEG3 expression decreased during liver fibrosis, and increased expression
could activate p53 and induce apoptosis through the mitochondrial pathway14, suggesting that MEG3 plays an
Scientific Reports | (2021) 11:1377 | https://doi.org/10.1038/s41598-020-80635-0 6
Vol:.(1234567890)www.nature.com/scientificreports/
lncRNA_id Locus Length tx-j CN log2FC P value Updown
NONMMUT060008.2 7:14,410,690–14,411,717 1028 0.172 172.514 − 9.973 2.52E−41 DOWN
NONMMUT060075.2 7:16,915,382–16,916,322 941 0.067 27.846 − 8.690 2.63E−38 DOWN
NONMMUT096375.1 15:89,767,563–89,768,777 817 0.057 6.597 − 6.844 1.33E−04 DOWN
NONMMUT152860.1 8:105,051,546–105,058,411 1236 0.037 3.502 − 6.546 5.83E−13 DOWN
NONMMUT008761.2 11:20,225,237–20,226,853 1617 0.206 17.552 − 6.414 1.12E−05 DOWN
NONMMUT001029.2 1:58,405,414–58,407,353 1940 0.123 9.000 − 6.196 6.17E−05 DOWN
NONMMUT050970.2 4:155,619,936–155,623,338 3403 0.132 9.308 − 6.143 3.01E−06 DOWN
NONMMUT027553.2 16:87,376,654–87,378,943 2290 0.066 3.928 − 5.903 6.59E−10 DOWN
MSTRG.41348.1 4:61,444,453–61,524,270 560 0.044 2.549 − 5.872 2.77E−11 DOWN
NONMMUT054921.2 5:137,336,283–137,338,185 1176 0.052 3.016 − 5.852 1.59E−19 DOWN
MSTRG.12342.1 12:23,832,607–23,841,289 428 23.898 0.046 9.031 8.40E−08 UP
MSTRG.64316.1 X:33,549,148–33,863,315 1414 3.692 0.007 9.060 2.41E−21 UP
MSTRG.36679.1 3:12,833,226–12,849,812 1630 3.330 0.006 9.117 1.60E−10 UP
NONMMUT089191.1 13:3,386,160–3,388,230 2071 5.325 0.009 9.139 3.52E−27 UP
MSTRG.64312.1 X:33,541,135–33,841,298 643 20.056 0.030 9.365 1.20E−25 UP
MSTRG.40589.1 4:40,651,444–40,660,004 297 22.185 0.032 9.448 2.50E−18 UP
MSTRG.47803.6 5:145,463,518–145,800,965 1195 12.340 0.016 9.584 1.03E−22 UP
NONMMUT050450.2 4:144,131,848–144,133,881 2034 59.925 0.053 10.152 3.13E−15 UP
NONMMUT089188.1 13:3,363,013–3,363,773 761 14.982 0.012 10.239 1.44E−29 UP
MSTRG.61463.4 9:58,702,406–58,712,258 1161 28.375 0.017 10.718 2.71E−31 UP
Table 2. Top10 upregulated and down-regulated DELs (FPKM > 1) between tx-j and control mice.
important role in HSC activation and liver fi brosis14,15. lncRNA H19 has been shown to play a positive role in HSC
activation and proliferation, and is closely linked to liver fibrosis16,17. A previous study showed that decreased
expression of lncRNA-H19 inhibited HSC activation and alleviated liver fibrosis in vivo and in vitro18. lncRNA
SNHG18 acts as a tumour suppressor in hepatocellular carcinoma(HCC)and an independent diagnostic marker
for liver cancer19; it promots cell motility by regulating EMT progression and remodelling the cytoskeleton20.
The clinical and diagnostic value of SNHG18 in patients with HCC was investigated for the first time, and it was
found that SNHG18 was significantly down-regulated in HCC tissues compared to the corresponding noncan-
cerous tissues21. These may be the main target genes of IncRNAs, in WD liver fibrosis. which may compete with
miRNAs. Identifying additional lncRNAs associated with liver fibrosis and further exploring their function is
important for liver fibrosis intervention strategies.
PPAR is a ligand-activated receptor body, and recent studies have shown that PPAR-γ inhibits HSC activation,
proliferation, and ECM formation22, and is closely related to liver fibrosis. The Notch signalling pathway has been
confirmed to be closely related to HSC activation. Studies have shown that the Notch1 and TGFß/BMP signalling
pathways can regulate gene expression of Hesl and thus induce HSC activation, suggesting that Notch signal-
ling pathways regulate the activation of HSCs involved in the progression of liver fibrosis. Furthermore, a high
expression of Notch3 is positively correlated with the activation of H SCs23. The drug metabolism-cytochrome
P450 pathway is a group of mixed functional oxidase systems on the smooth endoplasmic reticulum, the most
important enzymes of liver metabolism, and closely related to oxidative stress24. Excess reactive oxygen species
production can enhance lipid peroxidation and damage cell biofilms, which through synergistic cytokines and
hepatocyte apoptosis, contribute to hepatocellular inflammation, necrosis, and fibrosis25. The MAPK signal
transduction pathway, ERK1/2 signal transduction pathway, JNK, and p38MAPK signal transduction pathways
are significant in liver inflammation and apoptosis, and can affect the formation of liver fibrosis by regulating
HSC activation, proliferation, and apoptosis26. Overall, the lncRNA-mRNA co-expression network was remark-
ably enriched in the PPAR signalling pathway, Notch signalling pathways, drug metabolism-cytochrome P450
pathway, and MAPK signalling pathway; these signalling pathways might play major roles in the pathogenesis
and development of WD liver injury.
While further experiments are required, this study, nonetheless, contributes vital information regarding the
molecular mechanisms of WD. This study provides a foundation for the development of new diagnostic markers
and therapeutic targets for clinical treatment of WD. This study provides a new diagnostic index and treatment
target for clinical treatment of WD.
Material and methods
Ethics statement. Seven pairs of TX mice were obtained from the USA Jackson Experiment Centre. This
study protocol was approved by the Committee on the Ethics of Animal Experiments of Anhui University of
Chinese Medicine (Permit Number: AHAU2018008).
Animal experiments and sample collection. TX mice were selected as study subjects as they are the
most similar animal model to humans for studying hepatolenticular degeneration, with 82% sequence homology
Scientific Reports | (2021) 11:1377 | https://doi.org/10.1038/s41598-020-80635-0 7
Vol.:(0123456789)www.nature.com/scientificreports/
Figure 5. As shown in (a), ENSMUST00000181536 (Snhg19) correlated with 222 protein-coding genes, and the enrichment analysis
showed that Snhg18 may be related to leukocyte transendothelial migration, phagosome, glutathione metabolism, regulation of
actin cytoskeleton, natural killer cell mediated cytotoxicity, focal adhesion, Fc epsilon RI signalling pathway, cell adhesion molecules,
apoptosis, and Fc gamma R-mediated phagocytosis. As shown in (b), ENSMUST00000150851 (Meg3) correlated with 200 protein-
coding genes, and KEGG enrichment analysis pointed out that it may participate in sphingolipid metabolism, regulation of actin
cytoskeleton, glycosaminoglycan degradation, complement and coagulation cascades, adherens junction, leukocyte transendothelial
migration, galactose metabolism, haematopoietic cell lineage, chemokine signalling pathway, p53 signalling pathway, B cell receptor
signalling pathway, Fc epsilon RI signalling pathway, ABC transporters, mitogenactivated protein kinase (MAPK) signalling pathway,
and apoptosis. As shown in (c), ENSMUST00000129245 (Meg3) correlated with 169 protein-coding genes, that enriched to dozens of
KEGG pathway, such as gap junction, ABC transporters, peroxisome, glutathione metabolism, GnRH signalling pathway, complement
and coagulation cascades, peroxisome proliferator-activated receptor (PPAR) signalling pathway, metabolism of xenobiotics by
cytochrome P450, phagosome, tryptophan metabolism, fatty acid degradation, carbohydrate digestion and absorption, Notch
signalling pathway, ribosome, and toll-like receptor signalling pathway. KEGG analysis revealed that two lncRNA transcripts were
both related to ABC transporters and complement and coagulation cascades, although these two transcripts did not share the same
gene of interaction. As shown in (d), ENSMUST00000136359 (H19) correlated with 169 protein-coding genes, including vitamin
digestion and absorption, galactose metabolism, carbohydrate digestion and absorption, retinol metabolism, phagosome, gap junction,
arachidonic acid metabolism, butanoate metabolism, complement and coagulation cascades, antigen processing and presentation,
PPAR signalling pathway, ABC transporters, Notch signalling pathway, bile secretion, and MAPK signalling pathway.
Scientific Reports | (2021) 11:1377 | https://doi.org/10.1038/s41598-020-80635-0 8
Vol:.(1234567890)www.nature.com/scientificreports/
GENES Degee Updown Type GENES Degee updown Type
MSTRG.17166.1 430 UP lncRNA Cd84 87 UP Protein-coding
MSTRG.65889.1 415 UP lncRNA Lipn 86 UP Protein-coding
NONMMUT154173.1 374 UP lncRNA Cln6 84 UP Protein-coding
MSTRG.65372.1 371 UP lncRNA Muc13 84 UP Protein-coding
MSTRG.66158.2 369 UP lncRNA Serpina5 83 UP Protein-coding
MSTRG.65819.1 365 UP lncRNA Bmp8b 82 UP Protein-coding
NONMMUT015735.2 364 UP lncRNA Gypa 82 UP Protein-coding
NONMMUT040581.2 362 UP lncRNA Rbp2 82 UP Protein-coding
MSTRG.5191.5 359 UP lncRNA Tmem45b 82 UP Protein-coding
NONMMUT025830.2 357 UP lncRNA Rab31 81 UP Protein-coding
NONMMUT149595.1 222 DOWN lncRNA Aadac 71 DOWN Protein-coding
NONMMUT099727.1 175 DOWN lncRNA Sardh 67 DOWN Protein-coding
NONMMUT143057.1 156 DOWN lncRNA Urad 66 DOWN Protein-coding
MSTRG.22013.1 149 DOWN lncRNA C6 65 DOWN Protein-coding
NONMMUT062890.2 140 DOWN lncRNA C8g 62 DOWN Protein-coding
NONMMUT099726.1 138 DOWN lncRNA Ugt3a2 62 DOWN Protein-coding
ENSMUST00000156693 122 DOWN lncRNA Apon 54 DOWN Protein-coding
ENSMUST00000142299 121 DOWN lncRNA Cyp4v3 52 DOWN Protein-coding
NONMMUT054921.2 103 DOWN lncRNA Sdr9c7 51 DOWN Protein-coding
NONMMUT059036.2 99 DOWN lncRNA C4bp 46 DOWN Protein-coding
Table 3. Top10 connections of up- and down-regulated DELs and protein-coding genes in lncRNA-mRNA
coexpression network.
of the ATP7B g ene27. These mice exhibit biochemical, pathological, and clinical symptoms similar to hepatolen-
ticular degeneration in humans.
All the TX mice were permitted free access to food and water, and lived alone under standard conditions
(18–22 °C and 40–60% humidity). After 1 week acclimatisation, the mice were randomly assigned to two groups
(n = 2), namely the control and model groups.
Female and male mice of 8 to 10 weeks of age and TX mice (20 ± 2G) and DL mice were obtained from the
Jackson Experimental Animal Center of America. This study was rigorously carried out on the recommendation
of Guide for the Care and Use of Laboratory Animals of the National Institutes of Health. Animals use protocol
was reviewed and approved by the Institutional Animal Care and Use Committee of Anhui hospital of TCM.
In Wilson and control group, oxygen was supplied independently in isolation cage, and food and water were
obtained freely, under an alternating 12-h light/dark cycle for 4 weeks.
After the 4th week, the mice in each group were subjected to fasting for 12 h, and an aesthetized intraperi-
toneally with sodium pentobarbital (2 mL/kg; Shanghai Chemical Reagent Company). Hepatic tissues were
harvested.One section was added with 4% paraformaldehyde for 3 h, dehydrated with ethanol and xylene,
embedded in paraffin, and sliced for pathological analysis. Another liver section was sub-packaged, sealed in
freezing tubes, and stored at − 80 °C.
RNA‑seq. Library construction and RNA-seq were performed by Shanghai OG Company (Ao-Ji Biotech,
Shanghai, China). In brief, the total RNA of each sample was readied using an RNeasy Mini Kit (QIAGEN,
Germany). Libraries were created as per the benchmark TruSeq protocol. Purified cDNA libraries were used for
cluster generation and sequenced on the Illumina HiSeq 2500 according to the manufacturer’s protocol.
lncRNAs annotation and differentially expressed lncRNAs identification pipeline. After mask-
ing the adaptor sequences and the contaminated reads were removed, pure reads were processed for in silico
analysis. The reads were mapped using TopHat, with 2 mismatches allowed. The expression of RNA in the liver
was expressed in FPKM, and calculated using the TopHat and Cufflinks packages28. Transcripts with class code
“i,” “r,” “u,” “x,” and “.” were selected as novel long transcripts. New transcripts were compared to other annota-
tion databases including NONCODE (v4) (http://www.noncode.org), NCBI RefSeq, UCSC, and Ensembl29,30.
CPAT (v1.22)31 was used to estimate the coding potential of each novel transcript. Transcripts with a CPAT
score < 0.487 were considered to lack coding potential, and were subjected to a BLASTX search for similar pro-
tein sequences. In brief, 10,000 mRNA sequences and 10,000 subsequences included in the random selection
were used as a training dataset to evaluate a mouse-specific cut-off CAPT score by comparing Ensembl coding
genes by AUC analysis. Because it is the maximum sensitivity and specificity threshold, a cut-off value of 0.487
was selected. The department of operations not documented in BLASTX is considered the new lncRNA. After
the lncRNAs were identified and quantitation performed, classification was conducted based on the location
between lncRNAs and mRNAs32. Furthermore, chromosome information was also annotated.
Scientific Reports | (2021) 11:1377 | https://doi.org/10.1038/s41598-020-80635-0 9
Vol.:(0123456789)www.nature.com/scientificreports/
The lncRNA‑mRNA‑co‑expression network. Co-expression networks of lncRNA-mRNA are typi-
cally used to analyse the functional and regulatory involvement of lncRNAs. Functionally related lncRNAs are
expected to be associated with functionally similar mRNAs. To identify the interactions between lncRNAs and
mRNAs, we constructed a gene co-expression network according to the normalised FPKM of unit genes33. After
screening the data for differentially expressed lncRNAs and mRNAs, PCC between lncRNAs and mRNAs was
calculated and retained a pair(only lncRNA-mRNA) of significant correlations (PCC > 0.98 and P < 0.05)34. The
nodes degree was calculated to examine the topological property of this schematic, which was defined as the
number of directly linked neighbours. The function of four hub-lncRNAs, which have high degrees of expres-
sion, were assessed by GO and KEGG pathways terms that are enriched in co-expressed protein-coding genes
of each lncRNA.
Prediction of cis‑ and trans‑target genes. Predicting potential targets of lncRNAs, the algorithms
of Cis- or trans-acting algorithms were often credible. Based on the chromosomal location by using genome
browser, cis-acting potential target genes should be physically located within 10 kb upstream or 10 kb down-
stream of lncRNAs. The trans-acting potential target genes of lncRNAs were predicted based on the lncRNA-
mRNA sequence complementary and predicted lncRNA-mRNA duplex energy. In brief, BLASTN was per-
formed to survey mRNA sequences with identity > 95% and E-value < 1E − 5 and the RNAplex software was ued
to calculate the duplex energy with RNAplex-E-30. Pearson’s correlation coefficients were calculated with the
expression of lncRNAs and mRNAs. Cluster Profiler was ued to analyse the enrichment function of the lncRNA
target genes, and P < 0.05 was considered significant.
RT‑PCR validation. RNA-seq results were validated by RT-PCR, and six lncRNAs (ENSMUST00000129245,
ENSMUST00000150851, ENSMUST00000136359, ENSMUST00000181536, NONMMUT149595.1, and NON-
MMUT099727.1) were selected for qPCR validation. cDNA was synthesised by reverse transcription of RNA
from two groups of mouse liver tissues as templates, using 2-CT relative determination quantitative analysis,
with beta-actin as an endogenous control. To detect the non-processing group for the calibration sample of
lncRNA transfer in the sample recorded level, each sample was calculated by taking the mean of 3 tests in paral-
lel. The primers used are listed in Table 1.
Statistical analysis. Quantitative data of qPCR are presented as means ± SD. Statistic Package for Social
Science 22.0 software (SPSS, Chicago, USA) was employed for statistical analysis using the Student’s t-test and
threshold statistical significance value of p < 0.05. Using the Hmisc package in R, the PCC between lncRNAs
and mRNAs was calculated based on the expression determined using RNA-seq FPKM (PCC > 0.95, P < 0.05).
Data availability
The datasets generated during and/or analysed during the current study are available from the corresponding
author on reasonable request.
Received: 30 June 2020; Accepted: 17 December 2020
References
1. Petrukhin, K. et al. Characterization of the Wilson disease gene encoding a P-type copper transporting ATPase: Genomic organiza-
tion, alternative splicing, and structure/function predictions. Hum. Mol. Genet. 3, 1647–1656 (1994).
2. Ljubić, H. et al. ATP7B gene mutations in croatian patients with wilson disease. Genet. Test Mol. Biomark. 20, 112–117 (2016).
3. Kung, J. T., Colognori, D. & Lee, J. T. Long noncoding RNAs: Past, present, and future. Genetics 193, 651–669 (2013).
4. Sirohi, B., Singh, A., Jagannath, P. & Shrikhande, S. V. Chemotherapy and targeted therapy for gall bladder cancer. Indian J. Surg.
Oncol. 5, 134–141 (2014).
5. Yu, F. et al. MALAT1 functions as a competing endogenous RNA to mediate Rac1 expression by sequestering miR-101b in liver
fibrosis. Cell Cycle 14, 3885–3896 (2015).
6. Kanehisa, M., Sato, Y., Kawashima, M., Furumichi, M. & Tanabe, M. KEGG as a reference resource for gene and protein annota-
tion. Nucleic Acids Res. 44, D457–D462 (2016).
7. Kanehisa, M. & Goto, S. KEGG: Kyoto encyclopedia of genes and genomes. Nucleic Acids Res. 28, 27–30 (2000).
8. Sun, M. & Kraus, W. L. From discovery to function: The expanding roles of long noncoding RNAs in physiology and disease.
Endocr. Rev. 36, 25–64 (2015).
9. Arriaga-Canon, C. et al. The use of long non-coding RNAs as prognostic biomarkers and therapeutic targets in prostate cancer.
Oncotarget. 9, 20872–20890 (2018).
10. Chen, J., Liu, S. & Hu, X. Long non-coding RNAs: Crucial regulators of gastrointestinal cancer cell proliferation. Cell. Death. Discov.
4, 50 (2018).
11. Richard, J. L. C. & Eichhorn, P. J. A. Deciphering the roles of lncRNAs in breast development and disease. Oncotarget. 9, 20179–
20212 (2018).
12. Thin, K. Z., Liu, X., Feng, X., Raveendran, S. & Tu, J. C. LncRNA-DANCR: A valuable cancer related long non-coding RNA for
human cancers. Pathol. Res. Pract. 214, 801–805 (2018).
13. Moghaddas Sani, H., Hejazian, M., Hosseinian Khatibi, S. M., Ardalan, M. & Zununi Vahed, S. Long non-coding RNAs: An essential
emerging field in kidney pathogenesis. Biomed. Pharmacother. 99, 755–765 (2018).
14. He, Y. et al. Inhibitory effects of long noncoding RNA MEG3 on hepatic stellate cells activation and liver fibrogenesis. Biochim.
Biophys. Acta. 1842, 2204–2215 (2014).
15. Sun, M. et al. Downregulated long noncoding RNA MEG3 is associated with poor prognosis and promotes cell proliferation in
gastric cancer. Tumour Biol. 35, 1065–1073 (2014).
16. Li, X. et al. The role of long noncoding RNA H19 in gender disparity of cholestatic liver injury in multidrug resistance 2 gene
knockout mice. Hepatology 66, 869–884 (2017).
Scientific Reports | (2021) 11:1377 | https://doi.org/10.1038/s41598-020-80635-0 10
Vol:.(1234567890)www.nature.com/scientificreports/
17. Song, Y. et al. H19 promotes cholestatic liver fibrosis by preventing ZEB1-mediated inhibition of epithelial cell adhesion molecule.
Hepatology 66, 1183–1196 (2017).
18. Liu, R. et al. Cholangiocyte-derived exosomal long noncoding RNA H19 promotes hepatic stellate cell activation and cholestatic
liver fibrosis. Hepatology 70, 1317–1335 (2019).
19. Sun, C. C. et al. Expression and prognosis analyses of runt-related transcription factor family in human leukemia. Mol. Ther.
Oncolytics. 12, 103–111 (2019).
20. Zheng, R., Yao, Q., Li, X. & Xu, B. Long noncoding ribonucleic acid SNHG18 promotes glioma cell motility via disruption of
α-enolase nucleocytoplasmic transport. Front. Genet. 10, 1140 (2019).
21. Liu, X. F. et al. Small nucleolar RNA host gene 18 acts as a tumor suppressor and a diagnostic indicator in hepatocellular carcinoma.
Technol. Cancer. Res. Treat. 17, 1533033818794494 (2018).
22. Wang, Z. et al. Peroxisome proliferator-activated receptor gamma inhibits hepatic fihrosis in rats. Hepatobiliary. Pancreat. Dis. Int.
10, 64–71 (2011).
23. Zhang, K. et al. Hes1, an important gene for activation of hepatic stellate cells, is regulated by Notch1 and TGF-β/BMP signaling.
World J. Gastroenterol. 21, 878–887 (2015).
24. Wang, C. et al. ATF4 deficiency protects hepatocytes from oxidative stress via inhibiting CYP2E1 expression. J. Cell Mol. Med. 18,
80–90 (2014).
25. Xu, Z., Xie, B. & Wu, X. L. Advances of CYP2E1 in hepatocellular carcinoma. Int. J. Dig. Dis. 29, 271–272 (2009).
26. Chopra, P., Kanoje, V., Semwal, A. & Ray, A. Therapeutic potential of inhaled p38 mitogen-activated protein kinase inhibitors for
inflammatory pulmonary diseases. Exp. Opin. Investig. Drugs. 17, 1411–1425 (2008).
27. Theophilos, M. B., Cox, D. W. & Mercer, J. F. The toxic milk mouse is a murine model of Wilson disease. Hum. Mol. Genet. 5,
1619–1624 (1996).
28. Trapnell, C. et al. Differential gene and transcript expression analysis of RNA-seq experiments with TopHat and Cufflinks. Nat.
Protoc. 7, 562–578 (2012).
29. Liu, C. et al. NONCODE: An integrated knowledge database of non-coding RNAs. Nucleic Acids Res. 33, D112–D115 (2005).
30. Chen, Y. et al. Ensembl variation resources. BMC Genom. 11, 293 (2010).
31. Wang, L. et al. CPAT: Coding-potential assessment tool using an alignment-free logistic regression model. Nucleic Acids Res. 41,
e74 (2013).
32. Regulatory mechanisms of long noncoding RNAs in vertebrate central nervous system development and function. Neuroscience.
235, 200–214 (2013).
33. Qin X.J., et al. LncRNAs expression in adriamycin-induced rats reveals the potential role of LncRNAs contributing to chronic
glomerulonephritis pathogenesis. Gene. (2018).
34. Lim, L. J. et al. Network of clinically-relevant lncRNAs-mRNAs associated with prognosis of hepatocellular carcinoma patients.
Sci. Rep. 10, 11124 (2020).
Acknowledgements
The authors would like to thank Mr. Qiang Fan (Ao-Ji Bio-tech Co., Ltd., Shanghai, China) for help with data
analysis. The present study was financially supported by the National Natural Science Foundation of China
(grant no. 81774299), and the Anhui Provincial Natural Science Foundation of China (grant no. 170805MH19).
Author contributions
J.Z. conceived and designed the study. Y.M., D.J.X., Y.B. and W.Y. performed the experiments. H.W., H.J., H.H.
and D.T. analysed the data and drafted the manuscript. All authors read and approved the final manuscript.
Competing interests
The authors declare no competing interests.
Additional information
Correspondence and requests for materials should be addressed to J.Z.
Reprints and permissions information is available at www.nature.com/reprints.
Publisher’s note Springer Nature remains neutral with regard to jurisdictional claims in published maps and
institutional affiliations.
Open Access This article is licensed under a Creative Commons Attribution 4.0 International
License, which permits use, sharing, adaptation, distribution and reproduction in any medium or
format, as long as you give appropriate credit to the original author(s) and the source, provide a link to the
Creative Commons licence, and indicate if changes were made. The images or other third party material in this
article are included in the article’s Creative Commons licence, unless indicated otherwise in a credit line to the
material. If material is not included in the article’s Creative Commons licence and your intended use is not
permitted by statutory regulation or exceeds the permitted use, you will need to obtain permission directly from
the copyright holder. To view a copy of this licence, visit http://creativecommons.org/licenses/by/4.0/.
© The Author(s) 2021
Scientific Reports | (2021) 11:1377 | https://doi.org/10.1038/s41598-020-80635-0 11
Vol.:(0123456789)You can also read