User Project: Tidal Flyer; Innovation, Design & Evolution (TIDE) Supplementary - Phase 1b Project Acronym TIDE 1b Project Reference Number ...
←
→
Page content transcription
If your browser does not render page correctly, please read the page content below
Open Ocean Energy Ltd.

  User Project: Tidal Flyer; Innovation, Design & Evolution (TIDE)
  Supplementary – Phase 1b

  Project Acronym TIDE~1b

  Project Reference Number (18/2216094) IFREMER Ref No.

  Infrastructure Accessed Ifremer-Basin of Boulogne sur Mer
Infrastructure

                 Reports
Access

                           Status: Final

                           Version: 01

                           Date: 01/Mar/2018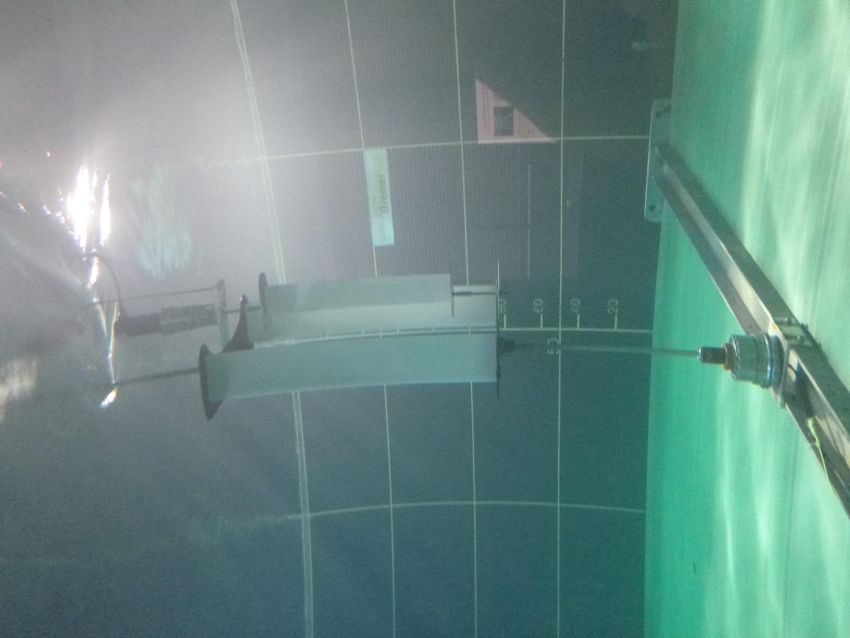
ABOUT MARINET
The MaRINET2 project is the second iteration of the successful EU funded MaRINET Infrastructures Network, both
of which are coordinated and managed by Irish research centre MaREI in University College Cork and avail of the
Lir National Ocean Test Facilities.

MaRINET2 is a €10.5 million project which includes 39 organisations representing some of the top offshore
renewable energy testing facilities in Europe and globally. The project depends on strong international ties across
Europe and draws on the expertise and participation of 13 countries. Over 80 experts from these distinguished
centres across Europe will be descending on Dublin for the launch and kick-off meeting on the 2nd of February.

The original MaRINET project has been described as a “model of success that demonstrates what the EU can
achieve in terms of collaboration and sharing knowledge transnationally”. Máire Geoghegan-Quinn, European
Commissioner for Research, Innovation and Science, November 2013

MARINET2 expands on the success of its predecessor with an even greater number and variety of testing facilities
across offshore wind, wave, tidal current, electrical and environmental/cross-cutting sectors. The project not only
aims to provide greater access to testing infrastructures across Europe, but also is driven to improve the quality
of testing internationally through standardisation of testing and staff exchange programmes.

The MaRINET2 project will run in parallel to the MaREI, UCC coordinated EU marinerg-i project which aims to
develop a business plan to put this international network of infrastructures on the European Strategy Forum for
Research Infrastructures (ESFRI) roadmap.

The project will include at least 5 trans-national access calls where applicants can submit proposals for testing in
the online portal. Details of and links to the call submission system are available on the project website
www.marinet2.eu

                                           This project has received funding from the European Union’s
                                          Horizon 2020 research and innovation programme under grant
                                                            agreement number 731084.
Document Details
 Grant Agreement Number          1125
 Project Acronym                 MaRINET2
 Title                           Tidal Flyer; Innovation, Design & Evolution (TIDE)
                                 Supplementary – Phase 1b
 Distribution                    Public
 Document Reference              1125; TIDE~1b
 User Group Leader,              Theo Devaney      Open Ocean Energy Ltd.
 Lead Author
 User Group Members,             Declan Bredin Open Ocean Energy Ltd.
 Contributing Authors             Brian Holmes Ocean Energy Consultant, Cork, Ireland
 Infrastructure Accessed         Ifremer-Basin of Boulogne sur Mer
 Infrastructure Manager          Gregory Germain
 or Main Contact

                                 Document Approval Record
                                 Name                             Date
 Prepared by                     Declan Bredin                    28/02/2018
 Checked by                      Theo Devaney                     01/03/18
 Checked by                      Brian Holmes                     05/03/18
 Approved by                     Theo Devaney                     06/03.18

                                Document Changes Record
 Revision     Date           Sections Changed  Reason for Change
 Number

Disclaimer
The content of this publication reflects the views of the Authors and not necessarily those of the European
Union. No warranty of any kind is made in regard to this material.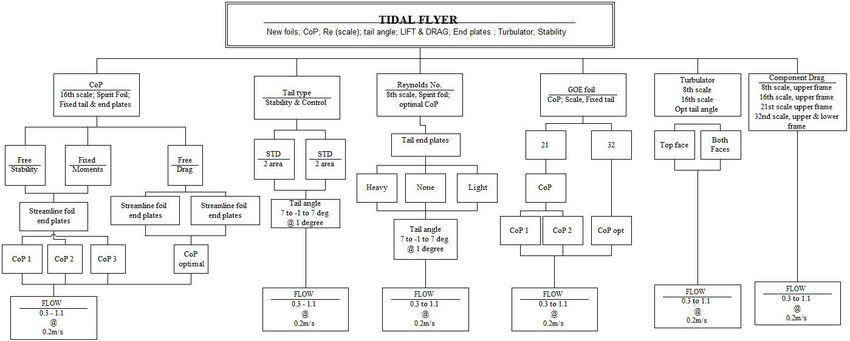
Table of Contents
Table of Contents ..................................................................................................................................... 4
1      Introduction & Background ................................................................................................................. 5
     1.1     Introduction ............................................................................................................................... 5
     1.2     Development So Far .................................................................................................................... 5
       1.2.1        Stage Gate Progress ............................................................................................................. 5
       1.2.2        Plan For This Access ............................................................................................................. 6
2.     Outline of Work Carried Out ................................................................................................................ 7
     2.1     Setup......................................................................................................................................... 7
       2.1.1        The '6-Degree of Freedom' load cells...................................................................................... 7
     2.2     Tests ......................................................................................................................................... 7
       2.2.1        Flyer Stability ....................................................................................................................... 7
       2.2.2        Xflr5 Software Validation ....................................................................................................... 9
       2.2.3        Tail Control ........................................................................................................................ 10
       2.2.4        Turbulator Performance ...................................................................................................... 10
     2.3     Results..................................................................................................................................... 12
       2.3.1        Flyer Stability ..................................................................................................................... 12
       2.3.2        Xflr5 Verification...................................................................... Error! Bookmark not defined.
       2.3.3        Turbulators ........................................................................................................................ 14
     2.4     Analysis & Conclusions .............................................................................................................. 14
       2.4.1        Flyer Stability ..................................................................................................................... 14
       2.4.2        Xflr5 Software Validation ..................................................................................................... 14
       2.4.3        Tail Control ........................................................................................................................ 14
       2.4.4        Turbulator Performance ...................................................................................................... 14
3.     Main Learning Outcomes .................................................................................................................. 15
     3.1     Progress Made .......................................................................................................................... 15
       3.1.1        Progress Made: For This User-Group or Technology ............................................................... 15
       3.1.2        Progress Made: For Marine Renewable Energy Industry ......................................................... 15
     3.2     Key Lessons Learned ................................................................................................................. 15
4.     Further Information ......................................................................................................................... 15
     4.1     Scientific Publications ................................................................................................................ 15
     4.2     Website & Social Media.............................................................................................................. 15
5.     references ....................................................................................................................................... 16
6.     Appendices ..................................................................................................................................... 16
     6.1     Stage Development Summary Table ........................................................................................... 16
     6.2     Any Other Appendices .................................................................... Error! Bookmark not defined.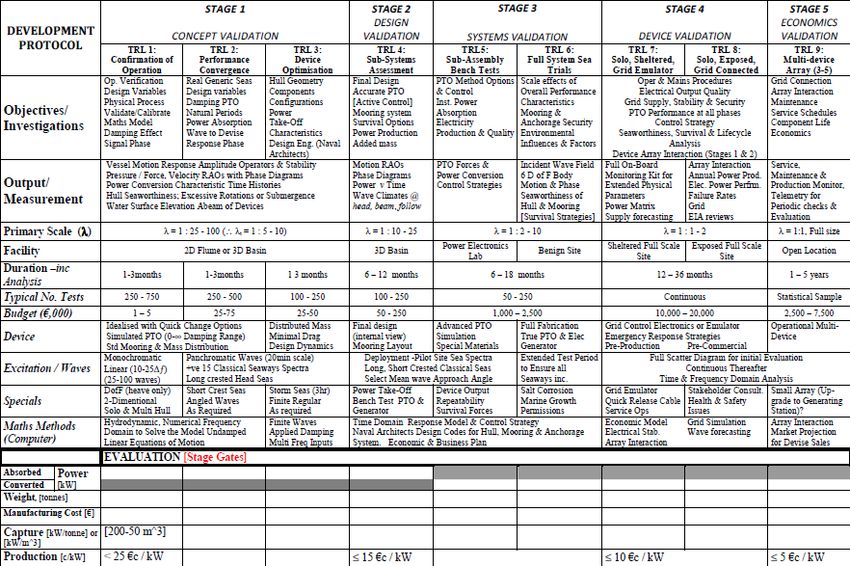
1 Introduction & Background
Introduction
Tidal Flyer is a hydrokinetic energy converter concept that uses the flowing water of tides or rivers to drive a
series of vertical underwater power hydrofoils that are connected to upper and lower drive cables laid out in the
form of a closed loop. The system can be arranged to span part way or fully across a marine channel. The
configuration can be expanded laterally by adding foils without changing the scale of the system, or it can be
developed at multiple scales (to suit the tidal channel or river where it is to be deployed). This provides for a
versatile system. In addition, this horizontal configuration provides a favourable swept area, allowing for a high
level of efficiency.
Open Ocean Energy Ltd. received access time though the MaRINET2 program to conduct model tests of key
components of the Tidal Flyer unit in the circulation tank of IFREMER in Boulogne-sur-Mer, France, over a 5-day
period. The facilities in-house measuring equipment and computerised data acquisition were utilised, whilst the
costs for additional specialist equipment and person-hours were covered by a grant from the Sustainable Energy
Authority of Ireland. The tests were performed during week 3 of January 2018. In total, 526 separate test runs
were undertaken over the 5 days and are described in this report.
The large volume of test were possible because this was not the first time Open Ocean Energy had used the
IFREMER facility, so the test programme ran efficiently and to schedule.
Development So Far
1.2.1 Stage Gate Progress
Previously completed:
Planned for this project:
STAGE GATE CRITERIA Status
Stage 1 – Concept Validation
Linear monochromatic waves to validate or calibrate numerical models of the system (25 – 100
waves)
Finite monochromatic waves to include higher order effects (25 –100 waves)
Hull(s) sea worthiness in real seas (scaled duration at 3 hours)
Restricted degrees of freedom (DofF) if required by the early mathematical models
Provide the empirical hydrodynamic co-efficient associated with the device (for mathematical
modelling tuning)
Investigate physical process governing device response. May not be well defined theoretically or
numerically solvable
Real seaway productivity (scaled duration at 20-30 minutes)
Initially 2-D (flume) test programme
Short crested seas need only be run at this early stage if the devices anticipated performance
would be significantly affected by them
Evidence of the device seaworthiness
Initial indication of the full system load regimes
Stage 2 – Design Validation
Accurately simulated PTO characteristics
Performance in real seaways (long and short crested)
Survival loading and extreme motion behaviour.
Active damping control (may be deferred to Stage 3)
Device design changes and modifications
Mooring arrangements and effects on motion
Data for proposed PTO design and bench testing (Stage 3)
Engineering Design (Prototype), feasibility and costing 
STAGE GATE CRITERIA Status
Site Review for Stage 3 and Stage 4 deployments
Over topping rates
Stage 3 – Sub-Systems Validation
To investigate physical properties not well scaled & validate performance figures
To employ a realistic/actual PTO and generating system & develop control strategies
To qualify environmental factors (i.e. the device on the environment and vice versa) e.g. marine
growth, corrosion, windage and current drag
To validate electrical supply quality and power electronic requirements.
To quantify survival conditions, mooring behaviour and hull seaworthiness
Manufacturing, deployment, recovery and O&M (component reliability)
Project planning and management, including licensing, certification, insurance etc.
Stage 4 – Solo Device Validation
Hull seaworthiness and survival strategies
Mooring and cable connection issues, including failure modes
PTO performance and reliability
Component and assembly longevity
Electricity supply quality (absorbed/pneumatic power-converted/electrical power)
Application in local wave climate conditions
Project management, manufacturing, deployment, recovery, etc
Service, maintenance and operational experience [O&M]
Accepted EIA
Stage 5 – Multi-Device Demonstration
Economic Feasibility/Profitability
Multiple units performance
Device array interactions
Power supply interaction & quality
Environmental impact issues
Full technical and economic due diligence
Compliance of all operations with existing legal requirements
1.2.2 Plan For This Access
The proposed tests, under this MaRINET2 access unit, focused on the investigation of the power hydrofoils and
control mechanism in order to improve the efficiency of the device by optimising the different components. All of
this knowledge will go towards improving the system to ensure its technical and commercial viability.
The tests measured the lift and drag forces on a single flyer unit using a '6 axis load sensor. This allowed the
comparison between CFD analyses of the device to empirical test data. The vast majority of existing data for
aero- and hydrofoils is either for significantly different Reynolds Numbers (aerofoils) or for very different
planforms (rudders and keels). It is therefore necessary to obtain the data relative to the proposed hydrofoils in
the kind of velocities the system will operate within.
The overall plan was to investigate the effects of foil shape and size; tail size;
foil and tail end plates;
foil turbulators;
centre of pressure (COP) location;
Distance from tail to COP.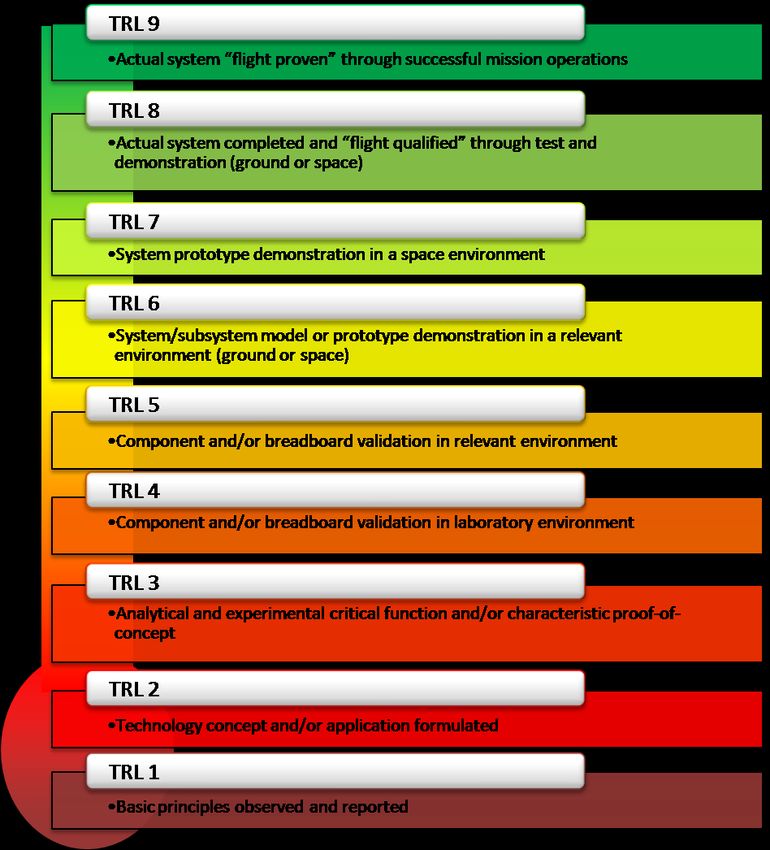
Theory suggests that locating the flyer pivot at the COP is key to the stability of the device under operating
conditions. It is therefore necessary to determine the COP of a flyer unit and find the effect of moving away
from this point has on stability.
In addition, an investigation into the affect turbulators and endplates have on the overall Lift/Drag ration (L/D)
for a tidal flyer unit, were conducted.
1. Outline of Work Carried Out
1.1 Setup
The '6-Degree of Freedom' load cells
As this series of tests were essentially optimisation tests, very similar tests were conducted throughout the week
with slight changes to the equipment for every test. In order to achieve this, it was only possible to test one
flyer (i.e. a pair of foils with either one or two tails in a frame). This meant that the tests were going to be static
tests which are different to dynamic tests of the full system but for optimisation, static tests are essential to
understanding. As with previous tests, a single flyer can be fixed within 2 No. '6-degree of freedom' load cells;
one at the top and one at the bottom. The angle of attack of the flyer is measured using an encoder mounted
below the top load cell.
1.2 Tests
Flyer Stability
During previous test campaigns instability of the flyer was found to be a concern for certain configurations.
Stability of the flyer unit relies on positioning the flyer axis of rotation at the COP. Prior to visiting Ifremer, CFD
analysis was carried out to narrow down the possible locations of the COP for the new foils to be tested, and
this provided a starting point for the COP location. The initial focus of this test campaign was to determine the
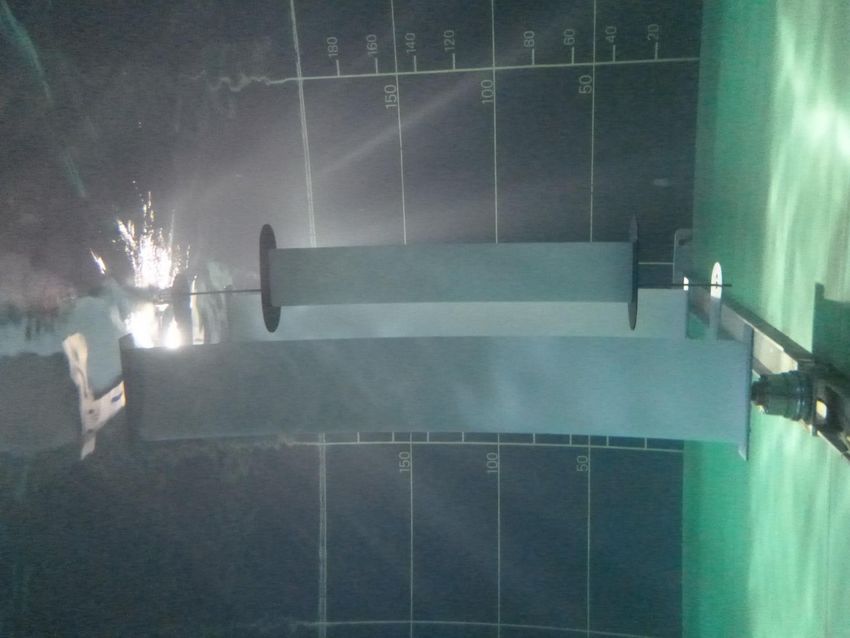
COP for the of the flyer unit with the Spirit and GOE modified foils and verify the CFD analysis.Picture 1: 8th scale Flyer with self-trimming tail
Picture 2: 16th scale Flyer with self-trimming tail – stepper motor visible over tail

          Xflr5 Software Validation
XFLR5 is an open source analysis tool for aerofoils, wings and planes operating at low Reynolds Numbers. Xfrl5
was used to identify potential optimal foil profiles for both the Tidal Flyer power foils and tail. The Xflr5 software
can only analyse a single 2D foil profile and cannot account for tip losses or end plate effects. Based on analysis
from Xfrl5, two foil profiles were identified for testing.

        Lift and drag forces were measured for different scale models over a range of current speeds and
angles of attack. This data is then compared against Xflr5 plots for idealised lift and drag coefficients.
Tail Control
Theory indicated that the flyer tail should operate close to an angle of attack (AoA) of 0° to the downwash from
the power foils. The relationship between the tail angle and the power foil angle is how the Flyer units are
controlled and is the primary control mechanism for either increasing or shedding power from each Flyer. This
relationship varies depending upon the foil and tail planforms (primarily the foil planform), the location of main
pivot and the distance the tail is located from the centre of rotation.
Turbulator Performance
Turbulators reduce the overall drag of a foil by inducing turbulent flow in the laminar boundary layer. A
turbulent boundary layer results which in turn moves the point of separation farther aft long the foil; increasing
lift and reducing drag and can potentially eliminate the separation point completely. Physical testing of flyers
with and without turbulators will be compared against computational analysis to determine the % improvement
in L/D for the two foil profiles identified previously in Xflr5.Figure 1: Test plan
1.3    Results
The majority of the results are considered commercially sensitive and are therefore not reproduced here. Some
of the Flyer stability results are shown below for different Centres of Rotation which were tested.

         Flyer Stability

                                                                     7.5% pivot
                                          6.5
                                            6
                Encoder angle (degrees)

                                          5.5
                                            5
                                          4.5
                                            4                                                          0.3 m/s
                                          3.5                                                          0.5 m/s
                                            3
                                                                                                       0.7 m/s
                                          2.5
                                            2
                                          1.5
                                                0   1000   2000     3000         4000    5000   6000
                                                                   data points

                                                             Figure 2: Pivot 7.5% behind foil

                                                                     9.5% pivot
                                          6.5
                                            6
                Encoder angle (degrees)

                                          5.5
                                            5
                                          4.5                                                          0.3 m/s
                                            4                                                          0.5 m/s
                                          3.5                                                          0.7 m/s
                                            3
                                                                                                       0.9 m/s
                                          2.5
                                                                                                       1.1 m/s
                                            2
                                          1.5
                                                0   1000   2000     3000         4000    5000   6000
                                                                   data points

                                                             Figure 3: Pivot 9.5% behind foil
12.5% pivot
6.5
Encoder angle (degrees) 6
5.5
5
4.5
0.3 m/s
4
0.5 m/s
3.5
3 0.7 m/s
2.5 0.9 m/s
2
1.5
0 500 1000 1500 2000 2500 3000
data points
Figure 4: Pivot 12.5% behind foil
15.5% pivot
6.5
6
Encoder angle (degrees)
5.5
5
4.5 0.3 m/s
4 0.5 m/s
3.5 0.7 m/s
3
0.9 m/s
2.5
1.1 m/s
2
1.5
0 1000 2000 3000 4000 5000 6000
data points
Figure 5: Pivot 15.5% behind foil
25% pivot
6.5
6
Encoder angle (degrees)
5.5
5
4.5 0.3 m/s
4 0.5 m/s
3.5 0.7 m/s
3
0.9 m/s
2.5
1.1 m/s
2
1.5
0 1000 2000 3000 4000 5000 6000
data points
Figure 6: Pivot 25.0% behind foilTurbulators
Some of the results for the turbulators are shown here.
Turbulators
2.50
0.5 m/s
2.00
0.7 m/s
1.50 0.9 m/s
Cl/Cd
0.5 m/s with
1.00
Turbulators
0.7 m/s with
0.50 Turbulators
0.9 m/s with
Turbulators
0.00
0.00 2.00 4.00 6.00 8.00 10.00
Encoder angle
Figure 7: Turbulator Lift/Drag ratio
1.4 Analysis & Conclusions
Flyer Stability
While previous physical testing and CFD analysis indicated that CoP location in relation to the flyer pivot point is
integral to flyer stability, all tests were found to be stable but with different overall relationships between the tail
angle and the foil angle. Time series data shows the oscillation of the flyer unit during tests was less ±1.5° from
the average encoder angle with no CoP location showing significant improvements over the others as shown in
figures 2-7.
Xflr5 Software Validation
Further analysis is required to fully isolate the power foil lift and drag forces from overall Fx and Fy forces
measured by the load cells during testing.
Tail Control
Initial results appear to show that the tail is controlling the flyer correctly, operating at an AOA close to 0° to the
free stream current. Tests indicate the downwash angle from the power foils is very small and has been
neglected for this initial analysis. Further work will be carried out to determine the true AOA between the tail
and the foil downwash.
Turbulator Performance
Figure 7 clearly shows the improved L/D for the flyer unit with turbulators. At an AOA of 4° on the power foils,
L/D is found to be 20% greater on average than the same tests without turbulators. The physical testing
outperformed our expectations based on Xflr5 analysis, which showed the turbulators were expected to improve
L/D by roughly 12% at 4° AOA.2. Main Learning Outcomes
2.1 Progress Made
Further work in needed to determine the true factors governing flyer stability and the significant of COP. CFD
analysis currently being conducted will add to our understanding of the parameters underpinning flyer stability.
Progress Made: For This User-Group or Technology
The addition of turbulators to the power foils have been shown to significantly improve the overall L/D ratio of
the flyer unit and will be considered for future projects.
Results from the 32nd scale model were poor compared to the 21st, 16th and 8th scale models. A combination of
testing at very low Reynolds numbers and a significantly high drag from the frame, support rods and encoder
resulted in poor readings for the lift and drag of the flyer. While testing at this scale is appealing due to low
manufacturing costs, ease of transport and availability of test facilities, the quality of test results at this scale
make this questionable. In regard to the 8th scale tests, while results were good, manoeuvring the 8th scale
flyer in and out of the tank proved quite difficult and the supporting frame was put under a lot of strain. Future
8th scale models will need more substantial frame design.
Progress Made: For Marine Renewable Energy Industry
Improved stability and tail control throughout this round of testing may be a result of improved model
manufacturing techniques. Previously, foil and tail sections were made from either formed sheet metal or
plywood cut to a template which resulted in a relatively rough finish. The current carbon fibre coated, composite
foils were produced from CNC machined moulds resulting in a far more precise foil profile and smoother finish.
As mentioned previously, choosing the correct scale for testing is important. While testing at smaller scales helps
to reduce costs and gives access to more test facilities, the quality of the tests and data obtained is the priority
and therefore testing at small scale is not considered prudent.
2.2 Key Lessons Learned
Prioritise quality of test results over savings costs on model manufacture;
Choose scales for testing carefully;
Plan a realistic number of tests, allowing for set up time and tests not going as planned first time; and
If current tests are to be compared to older models, ensure the test setup is kept consistent over visits
to the test tank.
Analysis of the data is continuing and upon completion, this report will be updated with some of those findings.
3. Further Information
3.1 Scientific Publications
List of any scientific publications made (already or planned) as a result of this work:
None at present
3.2 Website & Social Media
Website: www.open-ocean-energy.com (new site under construction)
YouTube Link(s): None
LinkedIn/Twitter/Facebook Links: Under consideration
Online Photographs Link: None4. References
None
5. Appendices
5.1 Stage Development Summary Table
The table following offers an overview of the test programmes recommended by IEA-OES for each Technology
Readiness Level. This is only offered as a guide and is in no way extensive of the full test programme that
should be committed to at each TRL.
NASA Technology Readiness Levels1
NASA TRL Definition Hardware Description Software Description Exit Criteria
TRL Definition Hardware Description Software Description Exit Criteria
1
https://www.nasa.gov/directorates/heo/scan/engineering/technology/txt_accordion1.html1 Basic principles Scientific knowledge generated Scientific knowledge generated underpinning Peer reviewed publication of
observed and underpinning hardware technology basic properties of software architecture and research underlying the
reported. concepts/applications. mathematical formulation. proposed
concept/application.
2 Technology Invention begins, practical application is Practical application is identified but is Documented description of
concept and/or identified but is speculative, no experimental speculative, no experimental proof or detailed the application/concept that
application proof or detailed analysis is analysis is available to support the conjecture. addresses feasibility and
formulated. available to support the conjecture. Basic properties of algorithms, representations benefit.
and concepts defined. Basic principles coded.
Experiments performed with synthetic data.
3 Analytical and Analytical studies place the technology in an Development of limited functionality to Documented
experimental appropriate context and laboratory validate critical properties and predictions analytical/experimental
critical function demonstrations, modelling and simulation using non-integrated software components. results validating predictions
and/or validate analytical prediction. of key parameters.
characteristic
proof of concept.
4 Component and/or A low fidelity system/component Key, functionally critical, software Documented test
breadboard breadboard is built and operated to components are integrated, and functionally Performance demonstrating
validation in demonstrate basic functionality and critical validated, to establish interoperability and agreement with analytical
laboratory test environments, and associated begin architecture development. predictions. Documented
environment. performance predictions are defined relative Relevant Environments defined and definition of relevant
to the final operating environment. performance in this environment predicted. environment.
5 Component and/or A medium fidelity system/component End-to-end software elements implemented Documented test
breadboard brassboard is built and operated to and interfaced with existing performance demonstrating
validation in demonstrate overall performance in a systems/simulations conforming to target agreement with analytical
relevant simulated operational environment with environment. End-to-end software system, predictions. Documented
environment. realistic support elements that tested in relevant environment, meeting definition of scaling
demonstrates overall performance in predicted performance. Operational requirements.
critical areas. Performance predictions are environment performance predicted. Prototype
made for subsequent development phases. implementations developed.
6 System/sub- A high fidelity system/component Prototype implementations of the software Documented test
system model or prototype that adequately addresses all demonstrated on full-scale realistic problems. performance demonstrating
prototype critical scaling issues is built and operated in Partially integrate with existing agreement with analytical
demonstration in a relevant environment to demonstrate hardware/software systems. Limited predictions.
an operational operations under critical environmental documentation available. Engineering
environment. conditions. feasibility fully demonstrated.
7 System prototype A high fidelity engineering unit that Prototype software exists having all key Documented test
demonstration in adequately addresses all critical scaling functionality available for demonstration and Performance demonstrating
an operational issues is built and operated in a relevant test. Well integrated with operational agreement with analytical
environment. environment to demonstrate performance in hardware/software systems demonstrating predictions.
the actual operational environment and operational feasibility. Most software bugs
platform (ground, airborne, or space). removed. Limited documentation available.
8 Actual system The final product in its final configuration All software has been thoroughly debugged Documented test
completed and is successfully demonstrated through test and fully integrated with all operational performance verifying
"flight qualified" and analysis for its intended operational hardware and software analytical predictions.
through test and environment and platform (ground, airborne, systems. All user documentation, training
demonstration. or space). documentation, and maintenance
documentation completed. All functionality
successfully demonstrated in simulated
operational scenarios. Verification and
Validation (V&V) completed.
9 Actual system The final product is successfully operated in All software has been thoroughly debugged Documented mission
flight proven an actual mission. and fully integrated with all operational operational results
through hardware/software systems.
successful mission All documentation has been completed.
operations. Sustaining software engineering support is in
place. System has been successfully operated
in the operational environment.Marinet2 – [Deliverable Title]
Page 19 of 19You can also read