Hydration and cooling in elite athletes: relationship with performance, body mass loss and body temperatures during the Doha 2019 IAAF World ...
←
→
Page content transcription
If your browser does not render page correctly, please read the page content below
Original research
Br J Sports Med: first published as 10.1136/bjsports-2020-103613 on 12 February 2021. Downloaded from http://bjsm.bmj.com/ on February 18, 2021 by guest. Protected by copyright.
Hydration and cooling in elite athletes: relationship
with performance, body mass loss and body
temperatures during the Doha 2019 IAAF World
Athletics Championships
Sebastien Racinais ,1 Mohammed Ihsan ,1,2 Lee Taylor ,3,4
Marco Cardinale ,1,5 Paolo Emilio Adami ,6 Juan Manuel Alonso,7
Nicolas Bouscaren,8 Sebastian Buitrago,9 Chris J Esh,1,3 Josu Gomez-Ezeiza,10
Frederic Garrandes,6 George Havenith,11 Mariem Labidi,1 Gunter Lange,6
Alexander Lloyd,11 Sebastien Moussay,12 Khouloud Mtibaa,13 Nathan Townsend,1,14
Mathew G Wilson ,1,5 Stephane Bermon6,15
►► Additional material is ABSTRACT INTRODUCTION
published online only. To view, Purpose To characterise hydration, cooling, body The Tokyo 2020 Olympics are expected to be the
please visit the journal online
(http://d x.doi.o rg/10.1136/ mass loss, and core (Tcore) and skin (Tsk) temperatures hottest in history, hence unprecedented countermea-
bjsports-2020-103613). during World Athletics Championships in hot-humid sures including the relocation of the athletic road
conditions. races from Tokyo to Sapporo.1 Despite consensus
For numbered affiliations see
Methods Marathon and race-walk (20 km and 50 statements2 and guidelines3 on how athletes should
end of article.
km) athletes (n=83, 36 women) completed a pre-race prepare, relatively little is known about the actual
questionnaire. Pre-race and post-race body weight strategies elite athletes adopt to cope with the
Correspondence to
Dr Sebastien Racinais, Research (n=74), Tcore (n=56) and Tsk (n=49; thermography) were heat4; particularly during major competitions (eg,
and Scientific Support, Aspetar Olympic Games, World Championships).
measured.
Orthopaedic and Sports An area of contention is hydration. Although 2%
Medicine Hospital, Doha, PO Results Most athletes (93%) had a pre-planned
dehydration exacerbates heat strain and impairs
Box 29222, Qatar; drinking strategy (electrolytes (83%), carbohydrates
performance,5 6 leading to the recommendation
s ebastien.racinais@a spetar.com (81%)) while ice slurry was less common (11%; of minimising body mass losses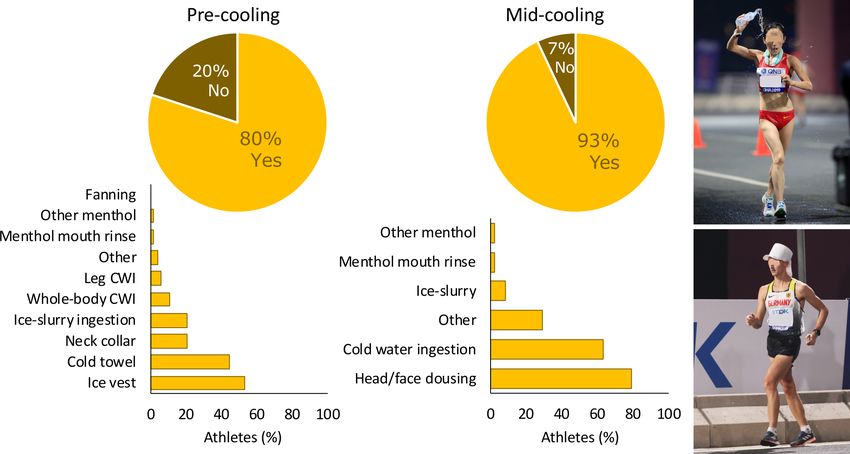
Original research
Br J Sports Med: first published as 10.1136/bjsports-2020-103613 on 12 February 2021. Downloaded from http://bjsm.bmj.com/ on February 18, 2021 by guest. Protected by copyright.
Table 1 Participant characteristics and environmental conditions per race
Marathon 20KRW 50KRW
Women Men Women Men Women Men
Participants
n 15 14 16 16 5 17
Age (years) 32.6±6.0 30.6±3.3 26.2±5.8 28.0±4.0 29.0±4.8 29.9±5.4
Height (cm) 162±5 176±7 162±7 179±7 167±6 179±7
Body mass (kg) 48.3±4.3 60.8±4.5 50.6±4.1 64.9±5.8 55.8±5.9 67.5±6.5
Environmental conditions
Temperature (°C) 32.0±0.7 29.3±0.5 31.6±0.8 32.7±0.2 31.1±0.5 31.1±0.5
RH (%) 77.9±2.3 46.3±1.0 76.6±3.2 80.6±1.1 75.7±3.0 75.7±3.0
Wind speed (m.s−1) 0.1±0.2 0.4±0.5 0.3±0.4 1.7±0.4 0.4±0.7 0.4±0.7
WBGT (°C) 29.6±0.3 23.5±0.4 28.9±0.5 30.6±0.3 28.2±0.9 28.2±0.9
Start time (hour:min) 23:59 23:59 23:59 23:30 23:30 23:30
Loop (km) 6×7 km 20×1 km 25×2 km
Performance
Personal best (hour:min:s) 2:30:33±0:02:51 2:11:40±0:03:11 1:29:01±0:02:27 1:19:35±0:01:22 4:21:37±0:09:44 3:49:26±0:04:46
Finish time (hour:min:s) 2:48:39±0:09:53 2:21:35±0:06:49 1:38:59±0:03:57 1:33:32±0:06:06 5:04:17±0:23:13 4:22:28±0:11:09
Finish time (%PB) 112.3±4.9 107.5±4.4 112.1±4.5 118.2±6.3 117.7±5.4 114.3±3.8
DNF (medical) 6 (5) 0 (0) 3 (1) 2 (1) 2 (2) 5 (3)
DQ – – 1 2 0 2
DNF (medical) means went to the medical tent (most common reasons were cramps for 5/12 and gastrointestinal issues for 4/12); DQ (during race-walk).
Values in n or mean±SD for the study participants.
DNF, did not finish; DQ, disqualified; 20KRW, 20 km race-walk; 50KRW, 50 km race-walk; %PB, percentage of personal best; RH, relative humidity; WBGT, wet-bulb globe temperature.
Pennsylvania, USA) on a tripod ~1.5 m above the floor, ~4 m finishing (before the mixed zone; post-race). Body mass loss was
from the course. expressed as a percentage of pre-race body mass (both measured
from towel-dried athletes wearing their race ensemble).
Measures
Questionnaire Skin temperature
Participants completed a pre-competition questionnaire (avail- High- resolution thermal images (FLIRT600, 480×360 pixel
able in 12 different languages, online supplemental appendix 1) infrared resolution, thermal sensitivity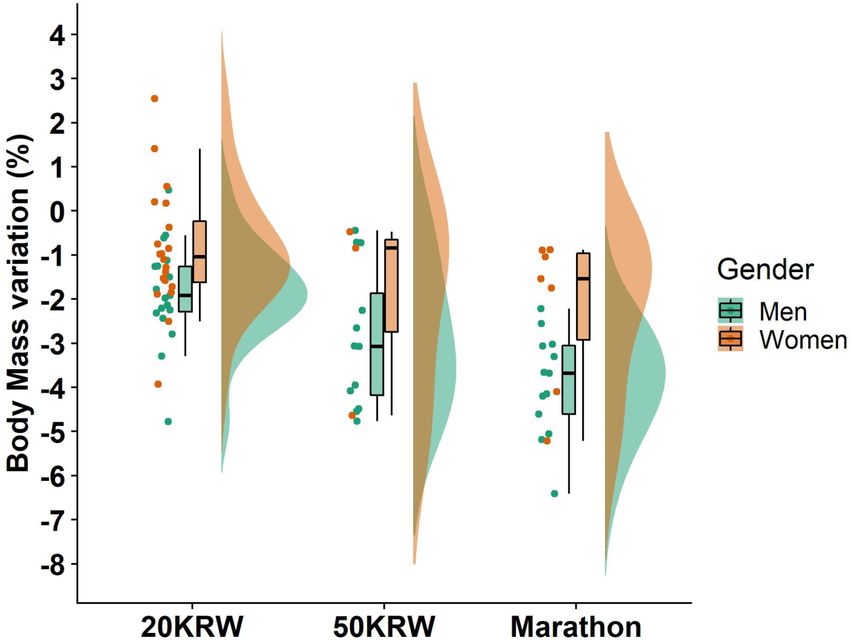
Original research
Br J Sports Med: first published as 10.1136/bjsports-2020-103613 on 12 February 2021. Downloaded from http://bjsm.bmj.com/ on February 18, 2021 by guest. Protected by copyright.
Figure 2 Pre-cooling and mid-cooling strategy during the World Athletics Championships. Upper panel: percentage of athletes declaring to plan
a pre/mid-cooling strategy. Lower panel: details of the strategy declared (in per cent of athletes). Right panel: example of water dousing plus neck
collar, and ice in cap with neck flap. Getty images for World Athletics.
temperature of the environment applied, as well as a check for hydration plan’ (potentially guided by science) or familiarity/
camera accuracy (using two 20×20 cm reference plates—mat confidence in ‘relying on thirst’. Thus, any strategy/interven-
black and crumpled aluminium foil connected to a thermistor). tion requires piloting away from competition before adoption
Skin was towel dried before measurement. The average of the 26 within a race. Coach recommendations were more influential
ROIs was computed and included in the analysis as mean Tsk.14 than personal reading (p=0.011), suggesting that practitioners
should communicate evidence- informed practice through the
Core temperature coach. Athletes relying on a ‘scientist’ achieved higher ranking
Tcore (precision 0.1°C, 1 recording every 30 s) was recorded using than those who did not (15±12 vs 24±13, p=0.013). This may
Celsius ingestible capsules (BodyCap, Caen, France) along
e- however be a function of the top-ranked athletes having superior
with instructions to ingest 4–6 hours pre-race. access to sport science support as the relative individual perfor-
mance was not different (112±4 vs 114%±7%PB, p=0.310).
Performance No effect of planned hydration volume, nor using electrolytes or
Ranking and finishing times were extracted from the official carbohydrates, was evident on %PB (all p>0.100).
race results. Times were normalised to the personal best of the Given the large variability in sweat rates (interindividual
athletes (%PB, obtained from World Athletics’ official database). differences, acclimatisation, clothing, environmental conditions,
etc.),4 17 most consensus statements recommend minimising
Statistical analyses fluid deficit, but do not mention specific fluid amounts.2 18 The
Data were analysed in Wizard (V.1.9.41, Evan Miller). Categor- current data provide insight into these amounts and how they
ical variables were compared using Χ2 tests (eg, effect of event depended on event (figure 1, p=0.033). Athletes intending to
on planning to use electrolytes). The effect of a category on a drink >2 L were most frequent in the 50 km race-walk (50KRW)
continuous variable was analysed through a two-tailed t-test (eg, compared with other events (82% vs 41%, pOriginal research
Br J Sports Med: first published as 10.1136/bjsports-2020-103613 on 12 February 2021. Downloaded from http://bjsm.bmj.com/ on February 18, 2021 by guest. Protected by copyright.
practical challenges as ice slurry machines can be difficult to
transport, and ice slurry ingestion may induce gastrointestinal
discomfort in some athletes.
Pre-cooling strategy
Several reviews (with and without meta-analyses) have suggested
pre-cooling as an ergogenic strategy for endurance exercise
performance in hot ambient conditions.10 11 23 Fifty-six per cent
of the long distance athletes (5000 m and above) planned pre-
cooling before the 2015 World Athletics Championships,13 and
72% of the cyclists planned pre-cooling before the 2016 World
Cycling Championships road races.20 The current data show that
80% of the athletes planned to use pre-cooling in 2019 (although
less common than mid-cooling, p=0.004, figure 2). While pre-
cooling effects may be overvalued in laboratory studies,12 partic-
ularly when externally valid air flow is not incorporated within
the experimental design,2 99% of athletes planning pre-cooling
were also planning mid-cooling, likely prolonging its benefits.
In 2015, before the World Athletics Championships long
distance events, the most common pre-cooling methods were
ice slurry (26%), ice vests (17%) and cold towels (12%).13 The
current data showed that in 2019, the most common pre-cooling
methods were ice vests (53%) and cold towels (45%), followed
by neck collars (21%) and ice slurry (21%) (figure 2). It appears
that athletics followed the trend already observed in cycling20 in
adopting ice vests as a common pre-cooling strategy. Pre-cooling
strategies were independent of event (p≥0.218), except for ice
vests (p=0.012) with a higher prevalence in race-walk (65%)
than marathon (31%, p≤0.028). We also observed a slight
reduction in leg cold water immersion which was planned by
11% of the athletes in 2015, 9% of the cyclists in 2016 and 6%
of the athletes in the current study. Given the potential detri-
mental effect of leg cooling on muscle function,8 20 the increase
in ice vest and decrease in leg cooling usage is in line with current
recommendations.1 20
The ranking of athletes planning to use ice vests (18±4) and
cold towels (17±12) was better than those who did not (26±14
Figure 3 Core and skin temperature in finishers, disqualified and and 25±14, respectively, p≤0.027), while athletes planning
did not finish (DNF). Pre-race skin temperature was correlated to the leg cooling were lower ranked than others (43±7 vs 20±13,
relative finishing time (in % if personal best, r=0.32, p=0.046). DNF had p=0.001). This may be due to the best athletes having superior
a higher pre-race skin temperature than finishers (*p=0.017). Square, access to sports science expertise/support,20 as the pre-cooling
diamond and triangle represent marathon, 20 km and 50 km race- strategy did not influence the relative performance of the athletes
walks, respectively. Blue and pink symbols represent men and women, (%PB, all p≥0.236). While there was no clear effect of any
respectively. %PB, percentage of personal best. specific pre-cooling method compared with others (acknowl-
edging that most athletes used at least one method), perfor-
mance was related to pre-race Tsk (as subsequently discussed).
Perceptual methods such as menthol mouth rinse and applica-
into practice (independent of event p≥0.288), with 83%, 81%
tions were nominal (figure 2).
and 85% of the road race athletes planning to use electrolytes,
carbohydrates and water during their race, respectively (figure 1).
In comparison, 59% and 31% of the long distance athletes (5000 Mid-cooling strategy
m and above) reported drinking electrolytes and carbohydrates Most athletes (93%, independent of event p=0.244) planned to
during the 2015 World Athletics Championships,13 and 72% and use mid-cooling, predominately head/face water dousing (65%)
69% of the road race cyclists planned electrolytes and carbo- and cold water ingestion (52%). Other strategies including
hydrates during the 2016 World Cycling Championships,20 menthol-based interventions (2%) were less frequently reported
respectively. This suggests that consumption of electrolytes and (figure 2), likely due to the challenges of mouth rinsing during
carbohydrates during competition has become highly preva- high-intensity running and the possibility to use ‘real’ rather than
lent in elite endurance athletes. Conversely, ice-slurry ingestion perceptual cooling. However, position statements proposing
during the race remained modest within the present data (11% menthol as an ergogenic aid for endurance in hot ambient condi-
overall, no marathon runners) and at the 2016 World Cycling tions have been published in 2020,18 24 and more commercial
Championships road races (10%).20 This is perhaps a reflection products are becoming available, suggesting that this proportion
of the lack of external validity regarding some ice slurry research, may change in the future. Yet, most of the data used in these posi-
as well as its limited performance benefit in some studies,21 with tion statements are obtained from moderately trained athletes,
a potential decrease in sweat rate.22 There are also logistical/ in laboratory settings.25 Whether these perceptual ergogenic
4 Racinais S, et al. Br J Sports Med 2021;0:1–8. doi:10.1136/bjsports-2020-103613Original research
Br J Sports Med: first published as 10.1136/bjsports-2020-103613 on 12 February 2021. Downloaded from http://bjsm.bmj.com/ on February 18, 2021 by guest. Protected by copyright.
Figure 4 Example of different pre-cooling strategies and their repercussion on pre-race skin temperature.
effects26 27 translate into performance improvements in elite be considered with extreme caution as athletes used various
athletes is not widely accepted. Lastly, several athletes replied mid-cooling approaches during the race and/or on crossing the
to an open question that they were also planning to use cold finish line. Moreover, Tsk during or after running may be affected
towels and/or various methods to apply ice on the hands, head, by the vasoconstrictor response.32 Peak Tcore (39.6°C±0.6°C,
face and neck (eg, neck ice socks, caps and bespoke legionnaire independent of event p=0.499) correlated to the pre-race Tcore
hats, figure 2). Recent data report some race-walkers may use (r=0.42, p=0.006) but was not related to performance or
a misting shower,28 but this was not available during the 2019 ranking (p≥0.225). As shown previously, World Championships
World Championships. medallists do reach extremely high Tcore (41.5°C).33 Final Tcore
and Tsk were not statistically related to any mid-cooling strate-
Pre-race temperatures gies, with most athletes using at least one such approach.
Pre-race Tsk and Tcore were 32.7°C±1.5°C and 37.7°C±0.3°C,
respectively (independent of event, p≥0.346), representing the Body mass loss
first reference for an outdoor World Championships. For compar- Average body mass loss (2.2%±1.7%) was dependent on
ison, a ~31.5°C Tsk was previously observed using a similar event (pOriginal research
Br J Sports Med: first published as 10.1136/bjsports-2020-103613 on 12 February 2021. Downloaded from http://bjsm.bmj.com/ on February 18, 2021 by guest. Protected by copyright.
Figure 5 Individual body mass variation from pre-race to post-race. Values in percentage of pre-race body mass. 20KRW, 20 km race-walk; 50KRW,
50 km race-walk.
water content.18 The current data partly support this concept and North American (91%, p=0.058) athletes planned to use
by showing higher body mass losses in men than women electrolytes. Reflective of these adopted strategies, body mass
(−2.8±1.5% vs −1.3±1.6%, pOriginal research
Br J Sports Med: first published as 10.1136/bjsports-2020-103613 on 12 February 2021. Downloaded from http://bjsm.bmj.com/ on February 18, 2021 by guest. Protected by copyright.
15
race completion. These data provide guidance for event organ- Human Motricity Laboratory Expertise Sport Health, Cote d’Azur University, Nice,
isers to support athlete needs (eg, freezers for ice vests) in mini- Provence-Alpes-Côte d’Azu, France
mising their temperature increase during a warm-up.
Twitter Sebastien Racinais @ephysiol, Mohammed Ihsan @Ihsan_mo, Marco
Cardinale @Marco_Cardinale, Paolo Emilio Adami @paolo_emilio, Juan Manuel
What are the findings? Alonso @DrJuanMAlonso, Josu Gomez-Ezeiza @goipergormance and Nathan
Townsend @DrNathanT
►► Most (93%) endurance athletes had a pre-planned drinking Acknowledgements The authors thank the World Athletics Health and Science
strategy including water (85%), electrolytes (83%) and Department for their endorsement, financial and operational support. The authors
carbohydrates (81%). also thank the local organising committee for their operational support and Dr
►► Pre-cooling (80%; mainly ice vests 53% and cold towels Marine Alhammoud for her help with data representation.
45%) and mid-cooling (93%; mainly head/face water dousing Contributors SR designed the study. All authors contributed to data collection and
65% and cold water ingestion 52%) were commonly pre- data analyses. All authors revised the manuscript and approved the final version.
planned by athletes. Funding This study was supported by World Athletics (formerly International
►► Ice slurry ingestion (pre-cooling 21%, mid-cooling 11%) and Association of Athletics Federations, IAAF).
menthol-based interventions (pre-cooling 1%, mid-cooling Competing interests None declared.
2%) were less common in athletes. Patient consent for publication Not required.
►► Although potentially underestimated due to wet clothing,
Ethics approval The project was approved by the Anti-Doping Laboratory Qatar
relative body mass loss was higher in men than women ethics committee (E2019000302). All procedures complied with the Declaration of
(−2.8±1.5% vs −1.3±1.6%), and not associated with Helsinki and written informed consent was obtained.
performance outcome (eg, race time, ‘did not finish’ (DNF) or Provenance and peer review Not commissioned; externally peer reviewed.
placing).
Data availability statement Data are available upon reasonable request.
►► Athletes who used ice vests had a lower pre-race core
temperature (Tcore, 37.5°C±0.4°C vs 37.8°C±0.3°C), but this Supplemental material This content has been supplied by the author(s).
It has not been vetted by BMJ Publishing Group Limited (BMJ) and may not
did not translate into a statistical performance benefit.
have been peer-reviewed. Any opinions or recommendations discussed are
►► DNF had a higher pre-race skin temperature (Tsk; solely those of the author(s) and are not endorsed by BMJ. BMJ disclaims all
33.8°C±0.9°C vs 32.6°C±1.4°C), while within finishers a liability and responsibility arising from any reliance placed on the content.
lower pre-race Tsk was moderately associated with faster race Where the content includes any translated material, BMJ does not warrant the
completion (r=0.32). accuracy and reliability of the translations (including but not limited to local
regulations, clinical guidelines, terminology, drug names and drug dosages), and
is not responsible for any error and/or omissions arising from translation and
How might it impact on clinical practice in the future? adaptation or otherwise.
Open access This is an open access article distributed in accordance with the
►► Drinking strategies were based predominately on personal Creative Commons Attribution Non Commercial (CC BY-NC 4.0) license, which
permits others to distribute, remix, adapt, build upon this work non-commercially,
experience, indicating the importance of piloting such
and license their derivative works on different terms, provided the original work is
strategies/interventions away from competition. properly cited, appropriate credit is given, any changes made indicated, and the use
►► Pre-race temperature management, including Tsk, is important is non-commercial. See: http://creativecommons.org/licenses/by-nc/4.0/.
for prolonged endurance exercise in hot-humid conditions.
►► Event organisers should consider the logistical facilities ORCID iDs
Sebastien Racinais http://orcid.org/0000-0003-0348-4744
required (ie, freezers) to facilitate ice vest usage at warm-up, Mohammed Ihsan http://orcid.org/0000-0001-5592-6888
as this is a common choice by athletes with good evidence to Lee Taylor http://orcid.org/0000-0002-8483-7187
minimise Tcore increase during warm-up. Marco Cardinale http://orcid.org/0000-0002-2777-8707
Paolo Emilio Adami http://orcid.org/0000-0001-5975-5342
Mathew G Wilson http://orcid.org/0000-0002-6317-0168
Author affiliations
1
Research and Scientific Support, Aspetar Orthopaedic and Sports Medicine Hospital,
Doha, Ad Dawhah, Qatar REFERENCES
2
Human Potential Translational Research Program, NUS Yong Loo Lin School of 1 Hosokawa Y, Grundstein AJ, Casa DJ. Extreme heat considerations in international
football venues: the utility of climatologic data in decision making. J Athl Train
Medicine, Singapore
3 2018;53:860–5.
School of Sport, Exercise and Health Sciences, Loughborough University,
2 Racinais S, Alonso JM, Coutts AJ, et al. Consensus recommendations on training and
Loughborough, UK
4 competing in the heat. Br J Sports Med 2015;49:1164–73.
Human Performance Research Centre, University of Technology Sydney, Sydney, New
3 Gibson OR, James CA, Mee JA, et al. Heat alleviation strategies for athletic
South Wales, Australia
5 performance: a review and practitioner guidelines. Temperature 2020;7:3–36.
Institute of Sport Exercise and Health (ISEH), University College London, London, UK 4 Bergeron MF, Bahr R, Bärtsch P, et al. International Olympic Committee consensus
6
Health and Science Department, World Athletics, Monaco statement on thermoregulatory and altitude challenges for high-level athletes. Br J
7
Sports Medicine, Aspetar Orthopaedic and Sports Medicine Hospital, Doha, Ad Sports Med 2012;46:770–9.
Dawhah, Qatar 5 Sawka MN, Cheuvront SN, Kenefick RW, Hypohydration KRW. Hypohydration and
8
Inserm CIC1410, CHU Reunion, La Réunion, France human performance: impact of environment and physiological mechanisms. Sports
9
Olympic Training and Service Centre Lower Saxony, Hannover, Germany Med 2015;45 Suppl 1:51–60.
10
Institute of Sport and Exercise Medicine, Stellenbosch University Faculty of 6 Adams JD, Scott DM, Brand NA, et al. Mild hypohydration impairs cycle ergometry
Medicine and Health Sciences, Cape Town, Western Cape, South Africa performance in the heat: a blinded study. Scand J Med Sci Sports 2019;29:686–95.
11
Environmental Ergonomics Research Centre, Loughborough University, 7 American College of Sports Medicine, Sawka MN, Burke LM, et al. American College
Loughborough, UK of sports medicine position stand. exercise and fluid replacement. Med Sci Sports
12
Normandie Univ, UNICAEN, INSERM, COMETE, CYCERON, CHU Caen, Caen, Exerc 2007;39:377–90.
Normandie, France 8 Goulet EDB. Effect of exercise-induced dehydration on endurance performance:
13
Physical Education Department, College of Education, Qatar University, Doha, evaluating the impact of exercise protocols on outcomes using a meta-analytic
Qatar procedure. Br J Sports Med 2013;47:679–86.
14
College of Health and Life Sciences, Hamad Bin Khalifa University, Doha, Ad 9 Beis LY, Wright-Whyte M, Fudge B, et al. Drinking behaviors of elite male runners
Dawhah, Qatar during marathon competition. Clin J Sport Med 2012;22:254–61.
Racinais S, et al. Br J Sports Med 2021;0:1–8. doi:10.1136/bjsports-2020-103613 7Original research
Br J Sports Med: first published as 10.1136/bjsports-2020-103613 on 12 February 2021. Downloaded from http://bjsm.bmj.com/ on February 18, 2021 by guest. Protected by copyright.
10 Bongers CCWG, Thijssen DHJ, Veltmeijer MTW, et al. Precooling and percooling 23 Ross M, Abbiss C, Laursen P, et al. Precooling methods and their effects on
(cooling during exercise) both improve performance in the heat: a meta-analytical athletic performance : a systematic review and practical applications. Sports Med
review. Br J Sports Med 2015;49:377–84. 2013;43:207–25.
11 Tyler CJ, Sunderland C, Cheung SS. The effect of cooling prior to and during exercise 24 Barwood MJ, Gibson OR, Gillis DJ, et al. Menthol as an Ergogenic aid for the Tokyo
on exercise performance and capacity in the heat: a meta-analysis. Br J Sports Med 2021 Olympic games: an Expert-Led consensus statement using the modified Delphi
2015;49:7–13. method. Sports Med 2020;50:1709–27.
12 Morrison SA, Cheung S, Cotter JD. Importance of airflow for physiologic and 25 Stevens CJ, Thoseby B, Sculley DV, et al. Running performance and thermal sensation
ergogenic effects of precooling. J Athl Train 2014;49:632–9. in the heat are improved with menthol mouth rinse but not ice slurry ingestion. Scand
13 Périard JD, Racinais S, Timpka T, et al. Strategies and factors associated with J Med Sci Sports 2016;26:1209–16.
preparing for competing in the heat: a cohort study at the 2015 IAAF world athletics 26 Stevens CJ, Best R. Menthol: a fresh Ergogenic aid for athletic performance. Sports
Championships. Br J Sports Med 2017;51:264–70. Med 2017;47:1035–42.
14 Cunniffe B, Ellison M, Loosemore M, et al. Warm-Up practices in elite boxing athletes: 27 Stevens CJ, Mauger AR, Hassmèn P, et al. Endurance performance is influenced by
impact on power output. J Strength Cond Res 2017;31:95–105. perceptions of pain and temperature: theory, applications and safety considerations.
15 Cotter JD, Thornton SN, Lee JK, et al. Are we being drowned in hydration advice? Sports Med 2018;48:525–37.
28 Stevens CJ, Ross ML, Périard JD, et al. Core temperature responses to elite
Thirsty for more? Extrem Physiol Med 2014;3:18.
Racewalking competition. Int J Sports Physiol Perform 2020;15:1–4.
16 Kenefick RW. Drinking strategies: planned drinking versus drinking to thirst. Sports
29 Byrne C, Lee JKW, Chew SAN, et al. Continuous thermoregulatory responses to mass-
Med 2018;48:31–7.
participation distance running in heat. Med Sci Sports Exerc 2006;38:803–10.
17 Cheuvront SN, Montain SJ, Goodman DA, et al. Evaluation of the limits to
30 Henderson MJ, Chrismas BCR, Stevens CJ, et al. Changes in core temperature during
accurate sweat loss prediction during prolonged exercise. Eur J Appl Physiol
an elite female rugby Sevens tournament. Int J Sports Physiol Perform 2020:571–80.
2007;101:215–24.
31 Racinais S, Cocking S, Périard JD. Sports and environmental temperature: from
18 McCubbin AJ, Allanson BA, Caldwell Odgers JN, et al. Sports dietitians Australia warming-up to heating-up. Temperature 2017;4:227–57.
position statement: nutrition for exercise in hot environments. Int J Sport Nutr Exerc 32 Tanda G. Skin temperature measurements by infrared thermography during running
Metab 2020:83–98. exercise. Exp Therm Fluid Sci 2016;71:103–13.
19 Stellingwerff T, Cox GR. Systematic review: carbohydrate supplementation on 33 Racinais S, Moussay S, Nichols D, et al. Core temperature up to 41.5ºC during the UCI
exercise performance or capacity of varying durations. Appl Physiol Nutr Metab road cycling world Championships in the heat. Br J Sports Med 2019;53:426–9.
2014;39:998–1011. 34 Zouhal H, Groussard C, Minter G, et al. Inverse relationship between percentage body
20 Racinais S, Nichols D, Travers G, et al. Health status, heat preparation strategies and weight change and finishing time in 643 forty-two-kilometre marathon runners. Br J
medical events among elite cyclists who competed in the heat at the 2016 UCI road Sports Med 2011;45:1101–5.
world cycling Championships in Qatar. Br J Sports Med 2020;54:1003–7. 35 Notley SR, Racinais S, Kenny GP. Do sex differences in thermoregulation pose a
21 Gerrett N, Jackson S, Yates J, et al. Ice slurry ingestion does not enhance self-paced concern for female athletes preparing for the Tokyo Olympics? Br J Sports Med 2020.
intermittent exercise in the heat. Scand J Med Sci Sports 2017;27:1202–12. doi:10.1136/bjsports-2020-102911. [Epub ahead of print: 01 Oct 2020].
22 Morris NB, Coombs G, Jay O. Ice slurry ingestion leads to a lower net heat loss during 36 Taylor L, Carter S, Stellingwerff T. Cooling at Tokyo 2020: the why and how for
exercise in the heat. Med Sci Sports Exerc 2016;48:114–22. endurance and team sport athletes. Br J Sports Med 2020;54:1243–5.
8 Racinais S, et al. Br J Sports Med 2021;0:1–8. doi:10.1136/bjsports-2020-103613You can also read