STARBUCKS RMAN PERFORMANCE TUNING CASE STUDY
←
→
Page content transcription
If your browser does not render page correctly, please read the page content below
STARBUCKS RMAN PERFORMANCE TUNING CASE STUDY
Starbuck’s current Enterprise Data Warehouse (EDW) has been in production since mid-2006. There has
been a fair amount of growth during that time with the warehouse growing from an initial 3 TB of data to
over 10 TB at present. As one might expect, every system will experience some level of growing pains as
it expands over time. In this case, tape backup performance became a key area of concern as the
warehouse grew. Some backup related issues were expected as they were due to limitations imposed by
the initial design, but unexpected issues arose as well.
This paper will cover the general architecture of the Starbucks EDW and the current backup
methodology. Next, it will define the backup problem and provide an analysis of the current backup
issues. Finally, the proposed solution will be given and test results examined, demonstrating tools and
practices to resolve the backup performance problem. Although the issues addressed in this paper may be
unique to this specific environment, the troubleshooting principles and methodologies discussed are fairly
universal.
BACKGROUND
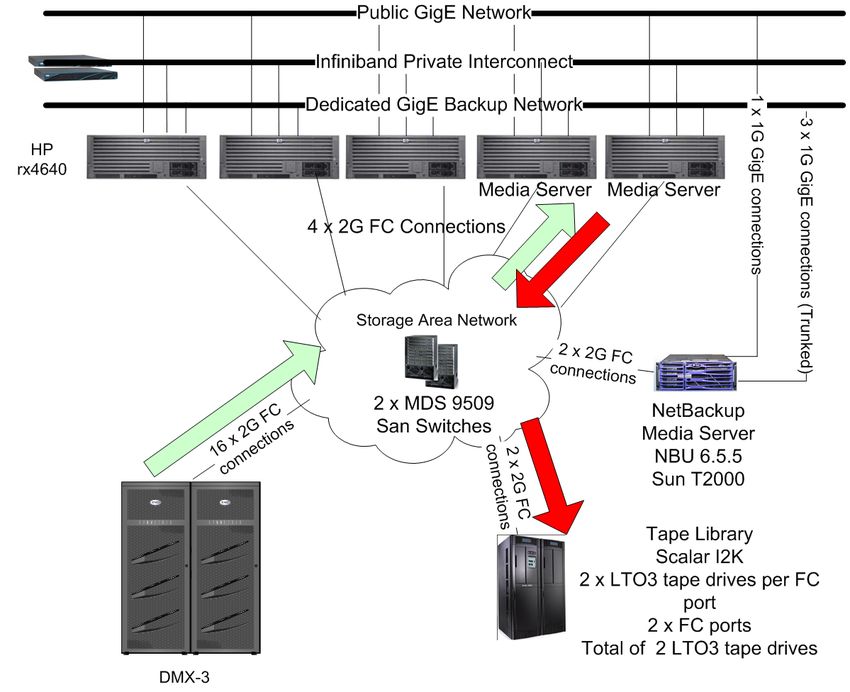
The following hardware infrastructure shown in Figure 1 currently supports the business intelligence
environment. The sources of data for this EDW have grown over time and the usage of the warehouse
has also grown more pervasive throughout the company. In addition to business analysts and other
internal users one would expect to use this information, the EDW also serves up reports to over 7,000
company owned North American retail stores on a daily basis. Microstrategy is the most common
reporting tool run against the EDW and Datastage is the Extract Transform and Load (ETL) tool used
for loading the EDW.
1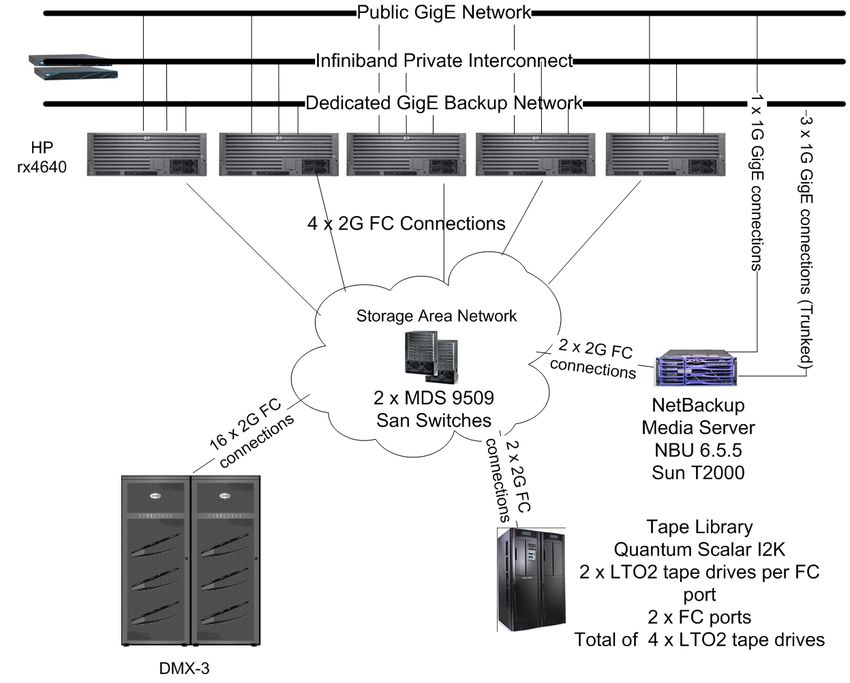
Hardware Architecture – 5 Node RAC Database

Servers – 4 CPU HP ia64 Servers 1.5 GHz CPU 16 GB memory
Network – Private Interconnect Infiniband Ib
Public Network – 1000 Mbps
Storage – SAN EMC DMX3
ASM DATA Diskgroup(s) - 12 Terabytes Raid 1+0 Storage 15k 146 GB
ASM FRA (i.e. Fast Recovery Area) Diskgroup - 14 Terabytes Raid 5 (3+1) 10K 300 GB
DB Software – Oracle 11.1.0.7 EE
Media Mgmt – NetBackup 6.5.5
Tape Hardware – Scalar I2K 4 LTO2 (400 GB Compressed per tape) Tape Drives

Operational (Non-Disaster) Backup & Recovery Requirements

Backup Window – 24 hours
RTO – 24 Hours
RPO – Ability to recover to anytime in the last 24 hours
Full backup size: 11 TB
Average daily incremental change rate: 300-400 GB

                                   Figure 1 – Current Backup Architecture

                                                                                     2
CURRENT BACKUP SOLUTION
In attempting to design the optimal backup solution, the Recovery Time Objective (RTO) and Recovery
Point Objective (RPO) were determined. In our case, the RTO and RPO could be supported by the
following solution.
Disk (FRA)
1. Daily Level 1 Incremental Backups
2. Roll Forward Image Copy until time ‘SYSDATE – 1’
Daily Script:
{ RECOVER COPY OF DATABASE WITH TAG 'WEEKLY_FULL_BKUP'
UNTIL TIME 'SYSDATE - 1';
BACKUP INCREMENTAL LEVEL 1 FOR RECOVER OF COPY WITH TAG
‘WEEKLY_FULL_BKUP’ DATABASE;
BACKUP AS BACKUPSET ARCHIVELOG ALL NOT BACKED UP DELETE ALL INPUT;
DELETE NOPROMPT OBSOLETE RECOVERY WINDOW OF 1 DAYS DEVICE TYPE
DISK; }
Tape
1. Weekly Script {BACKUP RECOVERY AREA}
2. Remainder of the Week Script {BACKUP BACKUPSET ALL}
Another objective of these scripts was to keep the solution as simple as possible while allowing a good
deal of flexibility. After selecting a complete RMAN solution for the backups, we outlined other
questions and concerns raised during the design process.
BACKUP PERFORMANCE CHARACTERISTICS
Backup Performance to Disk
Disk backup performance proved to be fairly consistent over time and was never a source of concern.
The backup will typically run for 1.5 to 2 hours with 4 RMAN channels allocated on a single database
node. On average, 300 to 400 Gigabytes of data will get backed up nightly. The first portion of that time,
roughly 50-60% is spent recovering the image copy to ‘SYSDATE - 1’, i.e. 24 hours behind the current
time. The next portion of time, 25-35%, is spent creating the incremental backup and archive log
backups. The remaining time is spent cleaning up old backups. These observed times are considered
reasonable and have worked well over the lifetime of the warehouse.
Backup Performance to Tape
Tape backup became a major source of concern over the past year. The daily tape backup, which utilizes
2 channels from a single node, typically runs for 60-90 minutes. Although we would expect these times to
be somewhat lower with LTO2 tape drives, the overall time still met our objectives. The weekly tape
backup, which utilizes 2 channels from two separate nodes (4 channels total) proved to be highly variable.
The full backup, approximately 11 TB, would sometimes run in 16-17 hours and at other times, run for
330+ hours and then fail. These long runs are unacceptable as they cause the next night’s incremental
backup to be missed and thus fail to meet the backup SLA.
The obvious question is: why would the weekly full backup exhibit such a high degree of variability?
Before delving into the question as to why the backup is experiencing so much variability, it might be
helpful to know what kind of backup rate should be expected based on the hardware configuration. Even
without the variability, is 16 to 17 hours a reasonable number? As with any system the backup will be
throttled by the slowest component. In referring to figure 1, we can run some quick calculations to
determine the limiting factor in this setup.
Determining The Slowest Component
1) What rate can the tape drives support? LTO-2 tape drives are rated at backing up as much as 80
MB/sec compressed, but experience shows us that we can achieve 85-90% of that rate on average.
Therefore 70 MB/sec compressed is a reasonable target and a number observed with other tuned
backups. Four tape drives should be capable of backing up roughly 280 MB/sec.
• 4 drives x 70 MB = 280 MB/sec (1 TB/hr)
2) What Is the I/O read rate supported by Fast Recovery Area Disk?
• Use RMAN – BACKUP VALIDATE DATAFILECOPY ALL
• Observed rate (read phase) > 1 TB/hr
3) What Is the speed supported by the GigE connection to media server?
• Maximum theoretical speed is 128 MB/sec but with overhead, ~115 MB/sec is
expected
• Maximum rate from 2 nodes is 2 x 115 MB/sec = 230 MB/sec (828 GB/hr)
Conclusion: GigE throttles overall backup rate since it is the slowest component
The point of the above calculations is to highlight that the best rate ever achieved in this architecture
would be 828 GB/hr under ideal circumstances. The full utilization of the LTO2 drives will never be
possible because the network simply cannot provide enough data. In observing the backup in progress,
the actual backup rate in aggregate from both nodes was in the range of 180-190 MB/sec, which yielded
the 16-17 hr full backup window. There were times where the backup would achieve a peak rate of 115
MB/sec on one node or the other, but in general it tended to run a little slower. This observed rate is of
more value to us when considering whether a re-architecture might be needed to solve the problem.
Although the slowest component was identified with this exercise, we have still not explained the high
variability in backup times.
PROBLEM IDENTIFICATION – DIVIDE AND CONQUER
The previous calculations showed the system has some inherent bottlenecks which will likely cause
problems when trying to scale the backup in the future. However, the variance in backup times remained
4the real mystery. Our experience as DBAs tells us a repeatable problem is fairly easy to troubleshoot;
problems that only happen some of the time are an entirely different story. If a problem cannot be
reproduced at will or isn’t easily reproducible, then enough monitors must be in place to catch the issue as
quickly as possible. As a DBA, you will likely not have the necessary access to troubleshoot the problem
by yourself unless you also have root access across the media servers, tape devices, and other system
components. In this case, it was necessary to engage a storage engineer and server engineer in addition to
the DBA, to ensure that all of the devices were monitored across the environment.
In trying to break down the problem into discrete elements, the team worked to logically break the system
apart so individual pieces could be tested. It can be daunting when initially looking at a problem like this
because there are many components one can monitor. CPU, memory, I/O, network, and other areas
could all be a source of the issue. Casting a very wide net and capturing as much data as possible proved
to be essential when troubleshooting this particular issue. Referring back to Figure 1, the first
component identified was the RAC cluster itself. If a backup was executed without writing the output to
tape, would a speed variance be found? In early discussions it was suggested that RMAN might be the
source of the performance issue. In order to prove that RMAN and the source system were not the cause
of the variance, the BACKUP VALIDATE DATAFILECOPY command was used. Running this
command repeatedly demonstrated that RMAN could read data out of the system at a consistent rate.
This proved that the source of the slow and inconsistent performance lay outside of RMAN and the RAC
cluster.
After eliminating the database cluster and RMAN as a source of the issue, it was asked whether the Scalar
I2k tape drives could be the cause of the performance issue. Although this was unlikely, test backups
were executed from other media servers to these same tape drives and consistent performance was also
observed. At this point it was recognized that the media server was the likely source of the issue and
several potential problem areas were identified:
• Link Aggregation on the Media Server
• Network Load Balancing from Network Switch
• Processor Architecture on Media Server
Link aggregation (also known as trunking or binding), involves binding several network ports to achieve
higher throughput. For example, linking two 1 Gb ports should give you a 2 Gb connection to the media
server. Unfortunately for us, this was one of only a few systems that was configured to use link
aggregation, so there was not a great deal of knowledge surrounding monitoring and troubleshooting. It
was thought that this link might be intermittently failing and causing the backup times to fluctuate. In this
specific case, three 1 Gb ports had been linked so we had to ensure we were not flooding a network
interface when the backup ran.
The second area of focus was the network load balancing from the switch. Network load balancers use
various algorithms to determine which port to use when connecting to a given server. Even though
trunking was being used, if a given network port on the media server was overloaded it could also explain
the variance in times.
Finally, the T2000 media server in this case was an older model server and had been formerly used as an
application server. The T2000 chip has 1 CPU with 4 cores, each having 4 threads. Ideally, the workload
should distribute evenly across the threads, but we would have to monitor the server during each test run
to make sure that CPU usage remained balanced and that no thread was maxed out during testing.
5During a series of tests, the link aggregation was monitored and proved to be a non-issue as it was found
to work as expected. However, the benefit of this effort was that the team did gain the knowledge of
how to quickly determine whether link aggregation was working or whether it was failing. If it had been
used more extensively in our operation, we would likely have scripts or enterprise tools in place to validate
the setup. Even with tools in place, one still needs to be prepared to go back to trusty Unix/Linux
commands, such as sar, top, vmstat, and iostat.
The second area of concern, the network switch, was also found to be behaving correctly. In monitoring
the network ports, a fairly even distribution over each port was seen even during runs that showed low
throughput and high run times. It was nontrivial proving this case, as it took multiple runs to get a run
where the extreme slow throughput was observed.
After eliminating the first two suspected bottlenecks, we started monitoring all of the CPU threads to
compare a fast run to one that was slow. Finally, the real problem started to reveal itself. Every so often,
all of the backup processes would end up on a single core of the processor and push the core to 100%.
Ideally, it should have been spreading these processes out to one per core, but it was not load balancing as
one would expect. The system engineer did a fair amount of research and came to the conclusion that the
interrupts would have to be manually set on the server so an even distribution across the cores could be
achieved. After testing with this setting we were finally able to achieve a fairly consistent performance for
some time. It was a relief to have finally found the root cause of the variability, but even with this
problem solved, we could not forget that backup times were exceeding 16 hours and with the warehouse
continuing to grow, a new plan was needed to stabilize and scale the backup.
ESTABLISHING TUNING OBJECTIVES
Two important questions that have to be asked when modifying an existing backup are: “What will the
new solution achieve?” and “How will success be measured?”.
Objectives
• Decrease Variance in Backup Time
• Simplify Backup Hardware Architecture
• Increase Backup Throughput for Future Growth
• EDW capacity increasing from 12 to 17 TB over next year
• Backup window remains at 24 hours
• Current 180 MB/s throughput will overrun backup window for 17 TB
• Desired throughput is ~ 1 TB/hr (approx. 280 MB/sec) to accommodate growth
and meet the backup window
The first objective is to decrease the variance in backup time. Backup issues can consume a fair amount
of time from cross-functional teams to resolve the issue. The new solution needs to ensure appropriate
hardware is used or a similar result, as we painfully experienced, would be expected. The second
objective, to simplify the backup hardware architecture, was a direct result of the analysis that had to be
undertaken to resolve the previously discussed backup performance variance issue. Having a less
complex solution requiring fewer components to monitor would be ideal and require fewer staff resources
to resolve any issues. For example, if the NetBackup media server software was installed directly on the
6RAC nodes as opposed to a separate media server, the DBA could monitor the server directly without the
assistance of a server engineer. Additionally, it would be one less hop across the network to monitor.
Finally, the EDW will be growing by an additional 5 TB over the next year. The new solution has to
backup at a faster rate than the current solution or the backup SLA will not be satisfied.
PROPOSED SOLUTION
There are multiple solutions that could be used to meet the objectives described above. Working with the
tuning objectives, the storage engineering team proposed the solution shown in Figure 2. As fate would
have it, this system was in fact scheduled to be moved to a new data center which would offer the new,
faster backup infrastructure.
In Figure 2, the most striking thing different than today’s infrastructure (Figure 1), is that the separate
media server has been removed from the solution. In this case, the NetBackup media software will be
installed directly on the EDW RAC nodes as opposed to a NetBackup client. Ironically, this was the
proposed solution 4 years ago for the warehouse when it was built. However, the selection of Itanium
hardware prohibited that route since the NetBackup client was not available on that platform when the
system went live.
Figure 2 – Proposed Future Backup Infrastructure
7Another important design point of this architecture is the switch from a network based backup to a SAN-
attached backup strategy over switched fabric. This removes the bottleneck of the 115 MB/sec per node
limit imposed by Gigabit Ethernet. The fiber connections, although only 2 Gigabit, are multiplexed
across 4 x 2 Gb ports which utilize EMC Powerpath Multipathing software This configuration offers a
much higher throughput potential, though it becomes more difficult to calculate the per node or aggregate
throughput number, in contrast to standard link aggregation. The system has to be measured as a whole
in order to determine the overall throughput and what capacity can reasonably be driven for a given node.
The Oracle Orion tool can give you a good baseline of how much I/O can be driven for a specified
configuration. In this case, we measured the throughput to be 1.37 GB/sec for the cluster. It is
essential to determine this number so the backup will not oversaturate the fiber network with backup
traffic. If an LTO3 tape drive can operate at ~150 MB/s compressed, then no more than 4 drives
maximum (~600 MB/s, or 60% of the available cluster bandwidth) should be used, so as not to impact
the rest of the EDW network traffic. Although the goal is to increase backup throughput, missing the
data warehouse load SLAs and adversely affecting the end user experience is not an acceptable outcome.
The arrows in Figure 2 show the path of the data over the fiber network. During the backup, the data will
flow through the warehouse nodes to the tape drives. Also as part of the new design the tape drives are
being upgraded from LTO2 to LTO3 and the storage engineers will be zoning tape drives directly to each
EDW node as opposed to a separate media server. The zoning also requires special attention to ensure
that ports on the fiber cards are properly balanced. The final aspect is that the DBA can monitor these
media servers with top, netstat, iostat and a variety of tools.
TESTING THE SOLUTION
With the Gigabit limitation connection removed and the system re-architected to remove other
bottlenecks, RMAN tuning could now begin in earnest. Once again, using BACKUP VALIDATE
DATAFILECOPY ALL served to verify if a reasonable backup read rate was being achieved.
One area of tuning that we probed was to increase the RMAN memory buffer usage, given the available
throughput on the production storage and Oracle best practice to allocate one channel per tape drive. We
reviewed Metalink Note 1072545.1 to understand the effects of adjusting _backup_ksfq_bufcnt
(the number of input buffers used by RMAN). More information on memory buffer tuning is also
discussed in the RMAN Performance Tuning Best Practices white paper available on OTN.
The FRA Diskgroup consists of 72 x 193 GB Luns and _backup_ksfq_bufcnt defaults to 16 when
not explicitly set. The first test was performed using one channel on one node of the cluster and the goal
was to ensure that RMAN could supply data at a rate sufficient to fully utilize the drive speed. At the
default level of 16, the BACKUP VALIDATE only read at roughly 100 MB/sec. As LTO3s are designed
to deliver 160 MB/sec compressed backup rates, the parameter would need to be adjusted higher. When
set to 32, 125 MB/sec of throughput was achieved and doubling the number to 64 yielded the 150
MB/sec. The read rate increased fairly linearly as the parameter was doubled and then doubled again.
Note that a 50% improvement in read rate was achieved by just tuning the _backup_ksfq_bufcnt
parameter.
8_backup_ksfq_bufcnt BACKUP
VALIDATE
Peak Read Rate
16 100 MB/s
32 125 MB/s
64 150 MB/s
Table 1 – BACKUP VALIDATE with 1 Channel on 1 Node
A natural next question would be whether we could observe similar performance gains when adding a
second channel to the same node and running the test again. Would aggregate performance be
diminished or degraded with the addition of a second channel? Since the I/O capacity is adequate, no
performance degradation was observed as shown in Table 2.
_backup_ksfq_bufcnt BACKUP
VALIDATE
Peak Read Rate
16 200 MB/s
32 250 MB/s
64 300 MB/s
Table 2 – BACKUP VALIDATE with 2 Channels on 1 Node
Users who are running Oracle Database 11g and have the Enterprise Manager (EM) Diagnostics Pack
enabled can also observe I/O throughput graphically. Although you can still calculate the I/O
throughput numbers using the V$BACKUP_SYNC_IO or V$BACKUP_ASYNC_IO views, EM can
display the same information so that one can quickly see if there are I/O intensive operations occurring
on the instance. Figure 3 shows a screenshot of the same data that is shown in Table 2.
Figure 3 – BACKUP VALIDATE (2 channels) with _backup_ksfq_bufcnt set to 16, 32, and 64
9Now that it was demonstrated that RMAN can deliver the data to the LTO3 drives at a sufficient rate,
testing of backups to tape commenced. It was fortunate that the initial BACKUP VALIDATE
commands were run since the initial round of tape backups yielded less than expected results. When the
_backup_ksfq_bufcnt parameter was set to 64, only 200 MB/sec per node as opposed to the
expected 300 MB/sec per node could be achieved when delivering the data to tape with 2 channels. After
coming so far in the tuning process, this seemed like a disturbing setback, but it just demonstrates how
one has to address new challenges as they arise during the tuning process. Several possible factors were
cited as to why 300 MB/sec was not achieved. The first consideration was that some of the data in this
database is compressed which could impact the tape speed because already-compressed data will not
further compress at the 2:1 ratio that is needed to obtain the LTO-3’s maximum compressed throughput.
However, a 33% performance degradation was too great to be attributed to that fact alone. We then
questioned how the HBAs (host bus adapters) had been zoned to the fiber switches and it was concluded
that a different configuration should be tried. The ports on the host bus adapters had to be adjusted so
that a single fiber port would not be flooded with too much data. This is a very low level system
configuration issue and if you don’t have access to the tools to measure these devices, you will need to
engage the server or storage engineers who can resolve the issue. The results shown in Figure 4 show the
results obtained after the rezoning occurred. It should be noted that the rezoning was still not an optimal
configuration since a dedicated HBA was not used to support traffic. As can be seen, the output varied
between 240 and 250 MB/sec. BACKUP VALIDATE again proved helpful to establish that the
performance issue occurred outside of the database.
Figure 4 – Backup to Tape with 2 Channels on One Node
Several additional tests were run to assess the impact of changing the _backup_ksfq_bufcnt
parameter. Would the results in backing up to tape be as clear as when simply running a BACKUP
VALIDATE? In the following tests, _backup_ksfq_bufcnt was set to 32 and 2 channels were
launched on 2 nodes (4 Channels Total). As can be seen in Figure 5, where the top graph depicts node 1
throughput and the bottom graph depicts node 2 throughput, the average throughput was around 230-
240 MB/sec.
10Figure 5 – Backup to Tape with 2 Channels / Node and _backup_ksfq_bufcnt=32
In the final test, _backup_ksfq_bufcnt was set to 64. In comparing Figures 5 and 6, it is difficult
to see a real difference with the settings being increased from 32 to 64. In both cases the tape drives
backed up at a rate of roughly 230-240 MB/sec. Although we earlier demonstrated that a read rate of 300
MB/sec could be achieved with the _backup_ksfq_bufcnt set to 64, this did not necessarily
translate to tape backup times.
Figure 6 – Backup to Tape with 2 Channels / Node and _backup_ksfq_bufcnt=64
11Some of this degradation can be attributed to the fact that compressed data is being backed up and the
tape drives cannot backup compressed data as fast as uncompressed data when tape hardware
compression is enabled. Additionally, the non-optimal HBA zoning may also contribute to not reaching
the observed read rate.
The final question to be answered is whether we succeeded in significantly cutting the overall backup time
and allowed this solution to scale for future growth. Table 4 shows the impact of changing the
_backup_ksfq_bufcnt on the overall backup throughput.
_backup_ksfq_bufcnt Peak Backup Average BACKUP
Throughput For RECOVERY
Image Copy AREA Time
16 380 Mb/Sec 11 hours 50 Min
32 450 Mb/Sec 10 hours 25 Min
64 450 Mb/Sec 10 hours 25 Min
Table 3 – BACKUP RECOVERY AREA with 2 Channels / Node (4 channels total)
As mentioned earlier, the original backup was averaging around 180-190 MB/sec from 2 nodes with 4
channels and the improved and tuned backup can now deliver data between 450-460 MB/sec when no
other significant I/O or CPU load is present on the system.
In practice, the backup throughput for the image copies can be less than we tested. When running
BACKUP RECOVERY AREA, the EDW load processes and end user queries can tend to drag down the
tuned numbers shown in the second column. Spikes in both CPU and I/O on both of the backup nodes
were observed during the full backup to tape. In addition, since these backup nodes are not dedicated
solely for backup purposes and concurrently handle various user workloads, the peak throughput
numbers in column 2 can also decrease. Of course, the original backup also had these same conditions,
but because it was highly throttled by the GigE limitation, these factors did not materially affect the
performance. Additionally, it was observed that one of the channels would tend to have slightly more
work assigned to it than the other channels, as only 1 or 2 channels would be performing the work during
the last 10% of the backup. No concerted effort was made to better balance the channels in this case
since the tuning objective was met. Recall that what was taking nearly 17 hours to backup on a good day
was now being backed up in a little over 10 hours. Finally, note that the image copy is only one
component backed up to tape via BACKUP RECOVERY AREA – this backup also includes incremental
backup sets and archive logs – so the actual BACKUP RECOVERY AREA time includes more backup
data and can take longer than just the data file copy themselves (currently at 11 TB).
SUMMARY
There were many lessons learned from the tuning exercise. Understanding what the system should be
able to deliver based on individual component specifications should yield a ballpark number of what can
be expected. Additionally, breaking down the performance problem into discrete elements is important
for identifying the source of the issue. At the outset, it may not be obvious how to dissect the problem,
12but work with your storage and server counterparts to see what can be monitored and analyzed at a
system level. It may take some trial and error, but through repeated tests and data analysis the issue will
eventually reveal itself. In this tuning exercise, the power of the BACKUP VALIDATE command proved
what could be delivered to downstream devices. In fact, we demonstrated that the overall backup read
rate could be raised by an astounding 50% by simply setting one RMAN-related parameter
(_backup_ksfq_bufcnt) in the SPFILE. Meeting the defined tuning objective reduced the overall
backup time by 40% and will allow this system’s backups to scale with the data warehouse growth well
into the future. As a final word, for those of you fortunate enough to be using Oracle Database 11g
Release 2, the use of the parameter backup_ksfq_bufcnt is no longer necessary for ASM-managed
environments, as RMAN has automated this functionality.
13Company Starbucks Coffee Company
Author Greg Green
Title Senior Database Administrator,
Database Engineering Team
Publication Date July 2011
14You can also read